Recommendations, best practices and key factors of smart city and smart citizenship
Katalin FEHER
Budapest Business School University of Applied Sciences, Senior Research Fellow Budapest, Hungary
E-mail address: feher.katalin@uni-bge.hu
Boros ISTVÁN
Hungarian Academy of Sciences, Research Assistant Budapest, Hungary
E-mail address: boros.istvan@tk.mta.hu
Abstract
Objectives The goal of the paper is to present an overview of current and future-oriented smart city concepts with particular consideration of smart citizenship. Prior work The evolution of the academic references is considered regarding the subject area. Approach Based on a systematically filtered governmental, business and university research corpus, a global insight is synthesised. Results Applying text network analysis, key factors and best practices of smart cities were mapped. The resulted summary provides the future smart city developments and the smartification of citizenship. Beyond, the analysis has explored unexpected essential metaphors from rainforest to backbone providing a specific overview of smart city and smart citizens.
Implications The resulted recommendations support the relevant strategy of the future city managements, and also, the upcoming and comprehensive academic analysis. Value The highlighted trends and metaphors contribute to the holistic view of smart city and smart citizenship by specific recommendations.
Keywords: data, business, government, university research.
1. Introduction
Smart city projects are trending worldwide. According to the BCC Research, this trend induces one of the fastest and largest growing markets globally. One hundred smart or intelligent cities have been declared and further six hundred will achieve this status in short term (https://www.bccresearch.com).
In parallel, number of news, city top lists, visions, reports and white papers is growing rapidly triggering public debate on this field. These movements put a pressure on strategic decisions of national and local governments, and also, of business and research to find the optimal way in building future cities. Decision and policy makers are persistently seeking a scope of smart city ideas. Besides, citizens are interested in higher level of local well- being, expecting repair and maintenance of the environment and infrastructure via technology and services. Presumably, advantages of changes involve them into a constructive co-operation.
The paper focuses on current and shortcoming trends of smart city projects, visions and critical approaches with global overview. A brief literature review presents a timeline of smart city concepts as an introduction and theoretical framework. Thereafter, a corpus- based analysis focuses on recent and current documents with the greatest interest promoting smart city adaptations. The first part of the analysis highlights the unavoidable key factors of technologies and services to decision makers. The second part of the analysis emphasises
on the most referenced best practices of smart cities with effective adaptations and creative experiments. Last but not least, based on key factors and best practices, recommendations are formulated to future concepts and utilisations.
The analysis presented by the paper is built on a corpus in governmental-business-research documents using text mining methods to map the most representative smart city developments including the role of smart citizenship. The visualisation of text networks supports the understanding of advanced technologies and social developments in smart city concepts with significant role.
The ultimate goal of the paper is to provide an overview of current and future-oriented smart city issues and applications with particular consideration of smart citizenship. The final output is a comprehensive insight of latest reports, visions and critical documents. The resulted recommendations support the relevant decision making of the future city managements.
2. Literature review
Checking the data bases of academic publications, the number of scholarly sources in smart cities are growing dramatically. At the beginning, visions of save green cities supported by ICT systems were on the focus in strategic or global contexts [1], [2], [3], [4]. Instead of negative or positive judgements, the neutral ‘e-topia’ term [5] was emphasised as a future output. Both of business and government services were presented in analysed case studies at the very beginning [6]. Smart citizenship did not occur as a frequented issue.
The current approaches point out the relevance of big data and algorithms ahead of any other trends [7], [8], [9]. In parallel, the practical and critical analyses proliferate in academic sources [10], [11]. This trend has been achieved following the last years’ efforts when the first applications have matured and when the project consequences have been appreciated. The most significant recent publications with growing citations have consistently started to discuss urban ecology, competitive urbanism and the optimisation via digital infrastructure [12], [13], [14]. Regarding the smart citizenship, participation, engagement, governmental incentives with public sector information [12] and user-centric challenges are the most frequented issues currently. Citizen-driven public data, social awareness, crowdsourcing, persuasive interfaces, empowerment with shared responsibility are increasingly becoming a spotlight [15], [16], [17]. Concluding, the term of smart citizen has become an integral part of smart city discussion in different dimensions.
Based on the current academic sources, the referred working definitions emphasise that a smart city supports well-being with optimised services to business and non-business participant or inhabitants with various concepts and applications. However, there is no any consensus on what the smart city really means. Branches of ongoing developments, changing trends and complex concepts mark out the currently valid approach and interpretation.
Following a logic by Albino and his co-authors [18], if we seek a relevant definition to smart city it is necessary to clarify the meaning of ‘smart’ in city context first. Based on
their in-depth literature review they decelerated a wide range of characteristics which shape a smart city. Although synonyms, such as ‘digital’ or ’intelligent’, are spreadable on this field, ‘smart’ is the determinant term with its dimensions. These dimensions contain among others info-communication technology, built environments, quality of life, mobility, natural environment, economic socio-political issues of the city, human and social capital, built critical urban infrastructure [19] and innovations. Checking only one literature summary, there is obvious how diverse is the landscape of the smart city concepts.
Referring to the original goal of this paper and considering the necessity of an up-to-date analysis, the focus was on presenting a global overview with real implementations.
Comparing the academic sources to governmental and business practice there is a chance to evaluate simplified recommendations of smart city to understand its factors and criteria.
‘Smart(er) cities have become a priority topic for academia, industry, government and policy makers alike, and need to be studied from a multi-disciplinary perspective‘ [15].
3. Key factors in smart city and smart citizenship 3.1. Corpus and methodology
The tested corpus was built by the ultimate goal of the paper. Latest reports, reviews, visions, executive summaries and critical documents are the basis of the analysis. There was a priority to focus on business and governmental sources together comparing to above presented scholarly approaches. Studying the documents, government to business (G2B), business to business (B2B) and government or business to university research (G2U/B2U) co-operations covered the possible corpus first.
After this filtering, one hundred and fifty documents were selected based on different criteria: fifty from G2B, fifty from B2B and fifty from G2U/B2U. The first criterion was to find the most searched and cross-linked public documents in English over the last three years. The reason of the three-year-term reflects on the rapidly growing urbanisation and digitalisation together. Choice of the language preference was an evident regarding the largest language volume of the sources, and also, the research methodology called text mining. According to the second criterion, there was a key consideration to analyse completed files with unified design. The format refers to the elaboration of a document and to representation goal of the content. Besides, the completed documents exclude the fluidity of contents via updates, changing information or modifications compared to the online webtexts. Last but not least, different continents, regions and cultures are presented in the corpus. In case of overlapping of contents, the latest and more detailed documents were chosen for a rich sampling.
Regarding the consideration of methodology used in this paper has conventional parts of text mining tools and network data with visualisation. In this section a quantitative text analysis is being presented, including key coefficients of basic text analysis methodology.
Visualising the collocations of words as matrix based on their co-occurrence within the text. Interpreting the structure and content of the text with the tools of descriptive network analysis and applying comprehensive analysis such as Quadratic Assignment Procedure (QAP) based on Pearson’s correlation. During the conversions of the corpus, due to technical and fundamental reasons, titles and descriptions in images and figures can not be
converted to text. The technical reason is that the algorithms can not convert images without the use of Optical Character Recognition (OCR). The fundamental reason is that we connect two words if they co-occur in the same sentence. Therefore we can not identify collocations in the titles and descriptions of images and figures because we can not distinguish sentences due to the absence of punctuations.
We applied to connect two words if they are co-occurred in the same sentences not more than in the distance of three words. For the calculation of the matrix based on this terms we used the software WORDij [20]. To visualize and analyse the text network we have chosen the software Gephi 0.9.1 [21] because of its advanced graphical and algorithmical features.
For the purpose of filtering the non-informative words from the text we applied stoplist built and customised for the task. Apart from the stoplist we only counted the words with a frequency equal or more than two, and relations between words if they appear two or more together. Connections based on word co-occurrences in text have no directions, therefore we have interpreted the results of the network analysis as undirected ones. On the network figures words indicated as nodes, their size equal to the amount of their betweenness centrality [22], [23], [24]. Therefore the sizes of the nodes are representing the amount of occasions one has to touch the node to connect two randomly chosen nodes with the shortest path in the network. Modularity algorithm [25], [26] identifies the communities within the network. Nodes ordered in the same community have more connections than it would be expected on the basis of chance in a random network with the same amount of nodes and density. The coefficient of modularity equals to the number of edges within a group of nodes minus the number of edges of the group of nodes in the random network. Gephi software uses Louvain modularity [27] with the standard 1.00 of resolution. Resolution is applied to encounter the fragmentation of poorly connected large networks. In the order of transparency and qualitative interpretation we have chosen the animation called Force Atlas [21] to render the networks with the most central nodes in the centre surrounded by connected nodes with smaller centrality from the same community.
3.2. Key factors based on frequencies
The following data tables contain the ten most frequent words within each corpus. These also represent proportions, the specific frequency of words divided by the frequency of all of the words in the corpus. The entropy coefficient computed for the corpus interprets the amount of information gained with the occurrence of a word within the corpus. Therefore, the occurrence of new words increasing the amount of information gain. Entropy computed on a word describes the amount of information gain based on the occurrence of that specific word [28].
In the corpus governance, 463640 words were counted in total with the filtering conditions, the average word frequency presents 30.392658, and the entropy coefficient computed for the corpus means 7.908343.
In the centre of this medium level, smart and city present the top and evident results regarding the selected corpus (see above). Data and information determine the decision
points and platforms. Developments and innovations are mentioned partly as synonyms and partly with overlapped opportunities. Services and public sector are in the focus of these developments and innovations guiding the local/government or the city management.
Therefore, the governmental concepts highlight data-driven proactivity and service-based society via management approach (Table 1).
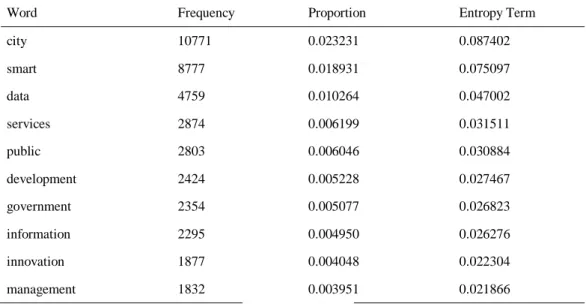
Table 1. Top 10 most frequent words of governance corpus
Word Frequency Proportion Entropy Term
city 10771 0.023231 0.087402
smart 8777 0.018931 0.075097
data 4759 0.010264 0.047002
services 2874 0.006199 0.031511
public 2803 0.006046 0.030884
development 2424 0.005228 0.027467
government 2354 0.005077 0.026823
information 2295 0.004950 0.026276
innovation 1877 0.004048 0.022304
management 1832 0.003951 0.021866
Source: Own editing
The total number of words equals to 314065. In this corpus the average word frequency is 24.402875, and 7.867626 entropy coefficient had been computed is 7.867626. The well- focused summaries was built the principle ‘less is more’. Less total words compared to the other corpus parts resulted similar rates. Besides evident smart and city, the data is also one of the most highlighted key factors. The service- and development-oriented approaches are emphasised related to public sectors. One type of additional highlights belongs to the implementations such as optimisation of energy sources and consumption or utilisation of emerging technologies. The other type of emphasised perspectives is closely related to co- operation with the government and the system level approaches (Table 2).
Table 2. Top 10 most frequent words of business corpus
Word Frequency Proportion Entropy Term
city 6308 0.020085 0.078488
smart 6225 0.019821 0.077718
data 2418 0.007699 0.037469
energy 2253 0.007174 0.035419
services 1769 0.005633 0.029172
development 1636 0.005209 0.027386
public 1572 0.005005 0.026515
technology 1492 0.004751 0.025413
system 1454 0.004630 0.024885
government 1387 0.004416 0.023947
Source: Own editing
In corpus university research the total of words is 467881, the average word frequency presents 37.177672 and the entropy coefficient computed for the corpus results 7.936007.
There are no new data in the first three places. City and smart are evident with data controls in the operation. Research projects are also emphasised, although this result is also evidence based on the selected corpus part. By reason of the business and governmental co-operations, developments and public data result also relevancy for university research.
However, the connection is strong with business developments in optimisation of energy consumption and implemented technologies. The unique patterns of this corpus part belong to the thinking on projects as interconnected modules. The above mentioned research focus supports to gain an insights bringing successful projects together. Last but not least, the frequency of social aspects is represented mostly in the university research corpus. This approach contains different dimensions of society and communities as a result of the consistently local research projects (Table 3).
Table 3. Top 10 most frequent words of university research corpus
Word Frequency Proportion Entropy Term
city 9006 0.019248 0.076038
smart 7812 0.016697 0.068332
data 4980 0.010644 0.048352
project 3105 0.006636 0.033282
development 2365 0.005055 0.026726
public 2313 0.004944 0.026249
research 2247 0.004803 0.025639
energy 2108 0.004505 0.024340
technology 1978 0.004228 0.023108
social 1644 0.003514 0.019856
Source: Own editing
It is worth noting that medium level of variance of each selected vocabulary above is in corpus. This output converges with homogeneous results in the top 10 and with standard entropy. In corpus of smart city, data seems to be the absolute centre in city planning for governments, business and university research with partnerships. Developments and public services point out overlapped fields in planning and implementation. Smart citizenship belongs to the university research focus essentially.
3.3. Comparative network-analysis of the key factors
The text network mined from governance corpus has 15255 nodes and 148046 edges. The scale of the degree of nodes takes place between 0 and 3637. The average degree or the average number of connections a node has is 19.410. Therefore nodes are lack of variety of connections because the same words often appear together in the corpus. Average path length is 3.038, that means, in average, three steps needed to connect two randomly selected nodes in the network. The longest path between two nodes is 10 steps. There are hubs on the network used as junctions, causing a relatively short average path length. The network has a density of 0.001, ergo it is poorly connected in a comprehension to a full network.
Using the Louvian modularity algorithm with a resolution of 1.0 the modularity coefficient is 0,239. Because of the positive number, groups of nodes in the network are more likely connected than it would be expected in a random network. The algorithm managed to identify 3785 communities, with the unconnected nodes forming a single community.
These results confirm the above mentioned homogeneous contents, and also, the overlapped fields.
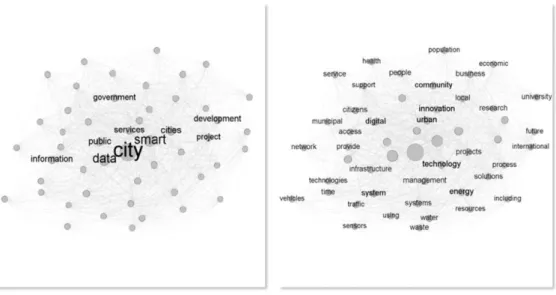
On the following network figure we have applied a filter for betweenness centrality in the sake of visibility. Only the top 50 words represented on the figure with a betweenness centrality more or equal than 312033.68924. The top 50 most central nodes own 0.7 percent
of all the edges in the whole corpus. On the left side of Figure 1. the most central nodes are labelled with betweenness centrality more or equal than 1351225.11.
Added to the resulted triad of smart-city-data in the centre, governmental issues belong to the public sector with state administration and services-oriented applications. Project- based operation with development goals presents higher impact on the data network than in the case of one dimension of frequency above. Information has strong connection to data confirming the already assumed logical connection. The further key factors are located on the periphery and between the centre and periphery constantly. Close to the centre, key factors represent the results of frequency analysis above with further synonyms. The keyword digital appears here as a key factor with strong ties to role of citizenship, such as citizen, people, community, access, population and health services. The further closely related area in the network belongs to the infrastructure, technology and energy sector.
Considering the systematic approach, optimised resources management and mobility with project-based solutions are meaningful in this corpus part.
Fig. 1. Sample of governance Source: Own editing
The text network created from business corpus has 12868 nodes and 98583 edges. The average degree is 15.322, therefore specific combinations of words are frequent in the corpus. The 3.026 average path length indicates the option of huge hubs in the network as well as 10 diameter indicates words positioned away from this central hubs. The whole of the network is poorly connected due to the 0.001 density. However, groups of nodes are more likely connected that it would be expected on the basis of chance in a random network.
Louvian modularity detected 3535 communities within the network with a resolution 1.0 used in the computation. On Figure 2. only are words with more or equal betweenness centrality than 208944.363421. The top 50 most central words obtain the 1 percent of all
the edges in the whole of the corpus. On the left side central nodes are labelled with more or equal than 956753.58 betweenness centrality.
Fig. 2. Sample of business Source: Own editing
Data is the absolute centre of the business corpus with strong tie to smart services, technology and energy sector. Presumably, the government on the periphery points out the link to the co-operations between government and business clearly representing connections to the public sector. The centrality enters into strongly distributed sub-centres emphasised in the same way. Information systems and infrastructure-based approaches are detected as the most wired links. Innovation presents a significant peripheral centre via digital technology focusing on business economy, and also, on citizens and social factors.
In parallel, implemented projects and plans are funded on people. With interpretation, business potential is connected strongly to the smart citizenship by innovation projects.
In the matrix based on university research corpus there are 12160 nodes and 96399 edges.
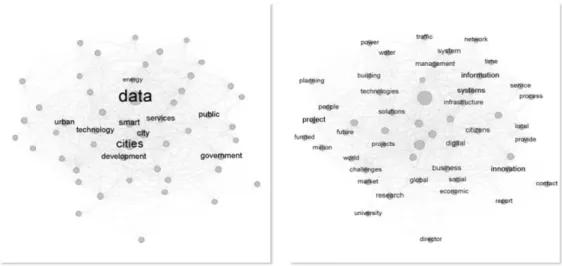
In conclusion of the average degree (15.855) special combinations of words are frequent in the corpus. The volume of the average path length is the very same, approximate 3 steps like in the two other corpuses. Therefore, the same sets of hubs are represented. However, with the diameter of 11 this corpus is the most fragmented one, at least it has the greatest amount of distance between nodes on the shortest path. With the density 0.001 this network as a whole is poorly connected, however groups of nodes are more likely connected that it would be expected on the basis of chance in a random network, the network disposes 2753 communities. On Figure 3. we have visualised top 50 most central words with betweenness centrality more or equal than 167426.086032. These most central nodes obtain more than 1 percent of the edges in total. On the left side of the figure central nodes placed in the central of the network with betweenness centrality more or equal than 660011.52.
The dual focus of city and data belongs to this part of the corpus as a result of intensive co- operation with both business and government projects. New elements in the centre present social factors and people which confirms the role of local and citizen-centric research projects by universities. Central elements push the further factors towards to the periphery with greater extent than in the earlier networks of sub-corpus above. The absolute periphery contains totally different factors, such as region, city and form of government with Africa, Berlin and republic, viewpoints and implementation of projects with time- or activity focus and infrastructure. Health service and further supporting projects are connected to the data city concepts, likewise in government corpus, where Prague is near to the centre (see details in the next chapter).
Fig. 3. Sample of university research Source: Own editing
For comparative analysis we measured the similarity of two datasets (matrixes) with the QAP Pearson’s correlation coefficient. QAP Pearson’s correlation compares the datasets with a standard number of 100 permutations expressing the similarity with the well-known correlation coefficient.
After one hundred random permutations computed there is a strong positive correlation between the collocations of business and government corpuses. P-value is 0.000, therefore the interpretation in the case of a sample data would be: if the correlation is 0 in the population (all of the correlated texts), than there is 0% probability to find the correlation.
As Table 4. shows the correlation still strong and positive between the corpuses university and business, university and government.
Table 4. Correlation between the sets of matrixes
Corpus QAP Pearson's correlation Probability Number of
random permutations
Business/Government .842 .000 100
University-research/Business .698 .000 100
University-research/Government .698 .000 100
Source: Own editing
Based on the coefficients of the correlation we can firmly say that there a strong similarity of vocabulary between the different sets of corpuses, but a highly strong correlation is between the corpuses of business and government. City projects are focusing on smartness and data. Government-supported initiatives have a strong impact on business and university research. The most wired elements in central location are the technology, information systems, digital tools, service-oriented applications and the public sector. Social factors, such as citizenship and role of communities, are emphasised in the whole corpus and in all sub-corpus. University research reflects mostly to this approach with gathering data of users and with participation via people, local business, NGOs and volunteers.
Infrastructure, and project-based developments have a focus on energy sector, mobility and health services.
4. The most referred best practices
Based on the outputs of text analysis, the most highlighted cities are in the focus in this chapter. Seeking the best practices, the most complex and versatile smart city concepts are selected to summarise ideas and visions, projects and critical approaches.
The top three cities create the scope of best practices using different perspectives, such as governmental, business and university research contexts. According to the mention frequency, London, Prague and Singapore represent the most referred and most remarkable smart city projects in the corpus. By studying the contents and contexts of the mentions, the following comprehensive pictures are drawn.
4.1. London
With governmental reference, London is the most frequently cited holistic concept in smart city context. It is important to emphasise that this city attracts the ultimate attention in the whole corpus. The background of the city is remarkable in itself via high representation, brand equity, business competitiveness, financial and technological role, creative industry, cultural values, high-ranking universities or tourist attractions. The sustainability of growing and popular city is emphasised in the corpus, regarding infrastructure and service- oriented rearrangement with different governmental models. Energy and water program for clean and cheap services with optional service providers, mitigation of climate change, environmental protection and open data platform guide the action plans and decision making. Maintaining and improving the quality of life can be achieved via these programs.
The ultimate goal is to follow the comprehensive London Infrastructure Plan for a liveable future.
The Smart London Board consists of representatives from state, academia and leading technology sectors building and updating the strategic programs of the smart city.
Developments of infrastructure and collaborative frameworks are in the focus considering the constantly decreasing costs of digital applications and computing capacity. The city is an innovation centre. By reason of this, The London Infrastructure Plan presents a holistic approach of transportation, green infrastructure, digital connectivity, housing, energy and water services, social infrastructure and the circular economy together.
The platform-based London Data Store promotes energy program with an ambitious climate project, and also, it results emerging business projects of information value chain.
Half-thousand transport apps have been developed via this data store creating a vibrant information marketplace. In connection, the free wifi in city centre, in public buildings and inside the underground trains is raising the investments into the digital infrastructure and data-driven decisions.
The Open Innovation 2.0 program is produced via diverse perspectives and the common values improving human well-being, increasing economic activity, reducing consumption and addressing environmental issues. According to the Quad Helix Model, government, industry, universities and citizens are seeking experimental and feasible developments together. The actors are focusing on the win-win model by the game theory. The goal is the common inspiration, the multidisciplinary partnership, the shared responsibility assuming an optimal, mutual satisfaction.
Regarding mobility, smart parking and congestion charge reduces the traffic primarily in sync with optimised public transport and bike sharing. Transport applications support MyLondon interactive and personalised dashboard for high mobility service quality.
User-centric innovations, living labs and applied research projects are supported by sensored environments, IoT sets and wi-fi services for real time data, for ongoing analysis and for interactive communication connecting individual or institutional/corporate users.
The most emphasised projects are designed to well-defined city nodes and hotspots, such as Hyde Park, Brixton, Enfield, Queen Elizabeth Olympic Park and the Tower Bridge.
Experience of citizens, private initiatives and volunteering are supported the co-operation and engagement to build smart citizenship.
Driving force of the citizen participation is an opportunity of the intervention, a consideration of neighbourhood, the openness to state or business smart services. Most of the aspects of city life become accurately measured, geotagged or identified. In parallel, empowerment of citizens and their access to open data allow the common planning and operation in the city. Talk London project was created to enable Londoners to participate in policy making by online discussion, polls or surveys. Meanwhile, citizens’ data privacy is protected as far as possible. Rest on these approaches, public services can be privatised via common interest and responsibility. Overcoming of digital divide is included the final
goal of building smart citizenship by training programs and enhancing the access to common knowledge. Special services to disabilities are also the part of the program called The Future Cities Catapult to help blind people navigating in the city.
Furthermore, London’s Tech City expands the local digital economies to international co- operations. All of these strategic elements create a possibility of higher quality of the services, also in telehealth, telecare or further assisted life via digital tools. Smart citizenship is an integral part of the smart city concept.
4.2. Singapore
Regarding the top city in business corpus, the city-state Singapore is highly represented via agile government and innovation economy in Asia Pacific region following Western standards of business environment, university institutions and infrastructure platform.
Smart Nation Vision by the government is engaged to construction of cutting-edge infrastructure, sustainable developments, smart culture and usable ageing population.
These cover the fields of mobility, transportation, security, energy, construction, human capital, education and health. Various government departments follow this strategy to implementation. The ultimate goal is to co-ordinate the efforts for meeting of different targets. These plans and projects are reviewed in every five years to updates and critical approach.
Rainforest is a guiding metaphor in the strategic planning to represent a decentralised concept with multiple redundancies. The industrial and service sectors claim networked interconnections and collaboration in the urban environment such as an organic system according to the metaphor. Future Cities Laboratory project works for urban metabolism with faculty and post-doctor researchers managing and calibrating various stocks and circular flows of resources in a complex city approach.
The ultimate goal is a technology platform to create a continuous digital connection among citizens, stakeholders and city services to participate in making improvements to the city.
The open data portal and visualised data summaries support transportation, healthcare, education and the business-developments. The corpus highlights the well-known strict law regime in the city-state where the surveillance technology detects actions and happenings.
This framework is built on data-surveillance and CCTV/IP cameras together. The result is a law-fearing society with remarkable low crime rates.
Model of biophilic city supports green areas and buildings via natural urban ecosystem with a unique design. Environmental modelling creates a professional planning of optimal utilisation of natural resources. It results in a reduction of unnecessary resource usage. In parallel, plan of Punggol town holds a vision of better and greener living environment for outdoor recreation activities of residents.
In utility management, the two-way flow of communication is essential between service providers and consumers. Solar energy and action plans to self-sufficient water- management are in priority. Recycling of waste and sewage are promoted by the government.
Regarding mobility issues, Singapore has already crunched data to predict traffic trends. A multi-stakeholder collaboration in R&D has been established supporting Singapore Urban Transport Solution (STARS) initiative. Electronic road pricing (ERP) and various sensors map the traffic conditions and parking system to reduce the private cars on the roads. The public transport system is world-class and cycling is also supported. Simulation of human and commercial activities, usage of transport and energy provide models with consequences for the environment planning. An on-demand driverless car service is in the long-term vision to transport of passengers.
Illustrating the creative developments in mobility, the Project Bus Stop is an architecture prototype project for commuters with slogan "transit, interact and socialise”. Interactive smart boards provide the journey planning, navigation and local information. Free WiFi and mobile phone charging docks were installed in bus stops. Library corner with e-book service, smart bike racks and swings are also available. Waiting time is supported with an extra layer by charging, data flow, downloaded books, changing for a bike, playing Pokémon GO or further geotagged games. Green roof and solar panels provide the energy sources to limit the environmental impact.
With a further example, the Marina Bay ambitious urban transformation projected a unique waterfront district in a live-work-play environment. This part of the city represents the vision of smart city ecosystem by active mobility, smart grid and lighting, green buildings with contemporary design, 3D performances about the nation.
Social services appears in different dimension. Healthcare is available not only in the hospitals or healthcare centres, but also, by tele-health service and remote patient monitoring at an online medical consultation platform. Besides, guided tracks and vehicles in hospitals facilitate the delivery of meals. Regarding elder people, caregivers are provided with notification system reducing any extra costs. Moreover, public housing program supports the social security and sustainability. Supported smart homes have an option to reduce the cost of living.
Citizens are the backbone of cities according to the corpus. Human talents play a key role of smart city. The adaptable population is essential to smart transformation and success of developments. It would therefore be favourable for the government to provide further ICT education and training. SkillsFuture program offers training and education for all citizens.
However, the priority target groups are students, junior or experienced employees and business operators for competitiveness. Silver Infocomm Initiatives focuses on older generations to integration into utilised ICT-related services in an ageing process.
OneService application enables citizens to report problems directly. Geotags, photo uploading and interactive platforms identify the reports to the governmental departments.
4.3. Prague
Prague is one of the most remarkable city in smart city rankings in university research context by the corpus. The municipality is a magnet for business investment and tourism in Central Eastern Europe. In parallel, traffic jams, air pollution, the growth of the city and
ageing population hold challenges. As a result, the city management focuses on the potential of smart city solutions via determination of strengths and weaknesses. The most highlighted weakness is the relation between the government and local government. The conflicts are rooted in distribution of financial sources by European Union.
The city government defined itself as a learning organisation focusing on flexibility in changing financial background. The smart city concept applies research and development, business incentives and education involving professional and civil partners. The conception of Smart City Think Tank was built from stakeholders who prepare discussion papers to smart city ideas and projects as critical approach.
The key initiatives in the corpus are the smart governance, smart energy, smart living, smart mobility with smart trams, and also, Prague Data Analytics Centre to data-driven decision making and to monitoring of effectiveness. It is noted that ICT data are not collected systematically and not linked with each other yet.
Starting with the first initiative, electronic registers work reliably for gathering and sharing information, for smooth administrative process and for future e-government innovations.
The wide internet access is essential. The disadvantaged social groups are supported by cheaper or free access alongside the Digital Education program.
Concerning the smart governance, a user-oriented communication system is created for the implementation and operation to increase the efficiency. The traditional urban governance and administration structure was decelerated as a too hierarchical system for citizen participation and for integrated urban planning with different sectors. Involvement of multiple stakeholders and city administration are necessary with impact monitoring.
Additionally, the municipal management tool is useful to visualise urban master plans and key factors with a direct link to the budget system. This IT-based management and decision making structure in Prague is an opportunity to apply internal communication and project management in city administration and eGovernment. With transparency goal, an open data system makes available the civic participation.
Regarding mobility, modernisation of transport systems results an integrated model in the air, in the water and on the roads. Radars, cameras, automatic scales, real-time data and advanced electronic or digital tools are applied for fast and effective traffic, and also for fewer accidents and violation. The public transport is advanced in Prague. Based on the key role of trams, Prague is developing electronic maps, communication of transfer options and automatic temperature regulation for passengers. Car sharing, E-Cars and Bikes, besides, wi-fi hotspots are prepared in mobility nodes.
For smart utility services, the government implements the first a smart grid as a fundamental infrastructural framework for smart and electronic services supported by new nuclear power plants combined with renewable energy and home-made solar energy. The ultimate goal is a storage with virtual power plant mixing several small power sources, such as biomass, small hydraulic power plants.
With further utility services including ICT infrastructure, tunnels are extending under the city. This approach allows the infrastructure reconstructions without any disruption in city life above the street level. Besides, a comprehensive communication concept for conflict- free coordination is essential with stakeholders from NGOs to public administration.
Water infrastructure management is an integral part of the utility-strategy. The SWiM project is monitoring the water production and consumption. The result is lower costs in water infrastructure management and faster repairs via integrated crisis management system. The portal-supported conception makes available maximum of information and interactive communication to partners and citizens to real-time information sharing.
Developing the city economy, an innovation district was established for R&D hub and urban labs to accelerate implementation of ideas and projects. The infrastructure-supported and creativity-driven district belongs to the Smart City Think Tank to provide co- investments and cross-sector co-operations for the higher quality of projects. As a showcase, the autonomous systems are tested here for automated mobility and robotised cleaning service. In parallel, energetic refurbishment of buildings belongs to a next planning phase.
As a touristic hotspot with the seasonal peaks and popular venues, Prague needs to promote spatially spreader attractions outside of the city centre. Avoiding the overwhelmed infrastructure and providing a viable environment to inhabitants, the city management is seeking the solutions for sustainable balance in the context of citizens vs. visitors. Bike sharing is one of the mitigation plans. According to the corpus, smartification improves the quality of stay for different user groups, such as locals, business or academic guests, tourists and students.
Illustrating the versatile approaches in the city projects, ReSITE is an international program in the smart city concept with several events and global partnerships. The mission is to create a more loveable and competitive city for the next generation of design thinking. City leaders co-operate and collaborate with connected leaders from various sectors. Sustainable mobility, promoted public space, high-quality architecture, alternative transit, opportunities of recreation are in the focus with the intersection of science, design, policy, culture and economy. The driving force of ReSITE is a leading advisory first to promote investment strategies, sustainable planning and creative banding based on emerging international trends. Second, the media platform supports the collaboration of urban projects.
4.4. Further top cities and consequences of best practices
Top cities are also Hong Kong and Austin in governmental context. Their smart city challenges are partly overlapped to the above presented top cities. However, they have also different highlights and preferences. Hong Kong has created the Digital 21 program addresses the economic, environmental and social needs for sustainability. Economic development, urban administration, shared spatial infrastructure, mobility, viability and human resources are emphasised in the concept with a strong ICT focus. Austin intents sustainability, social justice, economic opportunities and exploitation of creativity. It is a fundamental consideration to collaborate with urban agencies, communities, private sector,
companies and universities to involve them into the strategic planning and implementation.
The passage among these roles is provided by Data Rodeo open data portal. Relevant efforts will be assessed by stakeholders with both partners and users, documenting successes and failures.
Amsterdam was highly frequented with Prague and Singapore in university research context. According to the smart city ecosystem concept, the key initiatives are represented by energy themes from smart lightning to sustainable neighbourhood, mobility developments from car sharing to electrifying the city transport, and also, collaborative projects from circular economy between public and private partners to economic and social value creation.
Besides London and Singapore in business context, New York was also mentioned frequently. New York operates among others with Open Data movement. City data allow smart application developments to optimise transit plans, observe criminal records, monitor streets and find local services from banking to governmental offices. Open Innovation platform via computer resources empowers innovation in the city. Democratised technology works for a networked society, for social science and for cultural-creative outputs.
To sum it up, best practices in smart city context are open data services, development of infrastructure, collaboration, innovation, environment correction, optimised energy consumption, applied research, mobility, water and waste management in an intersection.
Citizen participation has become the part of the concept in most cases. However, the top down ideas and implementations by governments and policy maker boards are higher represented. Business works as a driving force is supported by open sources and various incentives. University research has turned into an integrated part of the applied projects.
Critical approaches of political decisions and reviews of successful or failed projects are unified part of planning in Prague and Austin.
5. Recommendations
The goal of this paper was to map the key factors and best practices of smart city and smart citizenship based on governmental, business and university research corpus. The concepts and implementations draw out central and peripheral nodes of highlighted trends in recent years. Comparing the literature review to results of the corpus analysis, the following recommendations are relevant for smart city management in decision-making.
First of all, the lack of a smart city definition allows diverse approaches and applications.
Considering the corpus and the summarised best practices, various cities have different challenges and conditions to implement emerging technologies, developments and services. Based on the cited literature review, it is necessary to consider the meaning of
“smart” in the affected city context first. The question is what kind of smart characteristics are relevant and adaptable in the social-business-cultural framework improving quality of life, competitiveness and sustainability. Collaboration of academic, business and governmental policy making has become fundamental to find local relevance in diversity of service-oriented concepts. Decisions about open data platforms for data-driven thinking,
an updated infrastructure or mobility for contemporary city design and an application of emerging technology are already incorporated into the collaborative frameworks.
On the other hand, the role of smart citizenship has been in the spotlight in last years. The involvement of all urban actors into the local decision making has turned into essential via collaboration and empowerment. Gathering and integrating citizen data by open smart platforms are only an opportunity for top-down policy-making. Besides, engagement to higher quality of life in given location has become an imperative for decision makers.
Developing a neighbourhood by civic activities, reducing the digital divide by special training, intensifying effective communication by different interest groups, preparing smart city innovations by volunteers have significant role of future cities. Additionally, local business, social services and mobility are also stimulated via these factors. Smartification has turned into an expected habit in smart citizenship facilitating the successful adaptions.
Metaphors of the corpus are worth to consider. First, the rainforest presents a decentralised concept with multiple redundancies to strategic planning. This approach is essential in context of integrated and service-centric city design to support networked society and business. In connection with the metaphor, living labs and further city laboratories test the circular flows of resources in a complex operation. Second, the citizens as backbones of urban activities are assumed as an adaptive population for success of developments.
Education and training in info-communication for different target groups with different goals improve the integration of citizens. Interactive platforms and analysed citizen data provoke feedbacks for higher level of smartness.
Last but not least, a clear message is involved into the corpus. Public communication of visions, reviews and completed milestones provide a dialogue or co-operations with the concept owners setting up the next opportunities of the smart city. Consequently, the studied documents draw attention to influence of transparent summaries. This result confirms concepts triggering evaluation, new partnerships, and also, city branding.
Acknowledgement
This paper has been written with the support and within the framework of: KÖFOP 2.1.2 – VEKOP – 15-2016-00001 Public Service Development for Establishing Good Governance:
The Digital Governance and Research Program.
References
[1]Geoff, H. (2005), Melbourne's Green Belt and Wedges: A Short History of Open Places and Spaces in the City and Their Strategic Context. Melbourne, RMIT Publishing.
[2]Odendaal, N. (2003), Information and communication technology and local governance: understanding the difference between cities in developed and emerging economies. Computers, Environment and Urban Systems, vol. 27, no. 6, pp. 585-607.
[3]Graham, S., Marvin, S. (2000), Urban Planning and the Technological Future of Cities. In: Wheeler, J. O.
and Warf, Barney (eds.) Cities in the Telecommunications Age: The Fracturing of Geographies. London:
Routledge. pp. 71-97.
[4]Hall, R. E. (2000), The Vision of a Smart City. In. Proceedings of the 2nd International Life Extension Technology Workshop, Paris, September 28.
[5]Mitchell W. J. (2000), E-topia. Cambridge, MIT Press.
[6]Tan, M. (1998), Plugging into the wired world: Perspectives from Singapore. Journal Information, Communication & Society, vol. 1, no. 3, 217-245.
[7]Srivastava, D. K., Singh, A. (2017), Big Data Analytics Towards a Framework for a Smart City. In.
International Conference on Information and Communication Technology for Intelligent Systems ICTIS 2017:
Information and Communication Technology for Intelligent Systems, vo1. 1, pp. 225-232.
[8]Beer, D. (2017), The social power of algorithms. Journal Information, Communication & Society, vol. 20, no. 1, pp. 1-13.
[9]Hashem, I. A. T., Chang, V., Anuar, N. B., Adewole, K., Yaqoob, I., Gani, A., Ahmed, E., Chiroma, H.
(2016), The role of big data in smart city. International Journal of Information Management, vol. 36, no. 5, pp. 748-758.
[10]Meijer A., Bolívar M. P. R. (2015), Governing the smart city: A review of the literature on smart urban governance. International Review of Administrative Sciences, vol. 82, no. 2, pp. 392–408.
[11]Scuotto, V., Ferraris, A., Bresciani, S. (2016), Internet of things: Applications and challenges in smart cities: A case study of IBM smart city projects. Business Process Management Journal, vol. 22, no. 2, pp. 357- 367.
[12]Barns, S., Cosgrave, E., Acuto, M. & McNeill, D. (2017), Digital Infrastructures and Urban Governance.
Urban Policy and Research, vol. 35, no. 1, pp. 20-31.
[13]Colding, J., Barthel, S. (2017), An urban ecology critique on the “Smart City” model. Journal of Cleaner Production, vol. 164, no. 15, pp. 95-101.
[14]Buck, N. T., While, A. (2017), Competitive urbanism and the limits to smart city innovation: The UK Future Cities initiative. Urban Studies, vol. 54, no. 2, pp. 501-519.
[15]Degbelo, A., Granell, C., Trilles, S., Bhattacharya, D., Casteleyn, S., Kray, C. (2016), Opening up Smart Cities: Citizen-Centric Challenges and Opportunities from GIScience. International Journal of Geo- Information, vol. 5, no. 2, p. 16.
[16]Salim, F. (2015), Urban computing in the wild: A survey on large scale participation and citizen engagement with ubiquitous computing, cyber physical systems, and Internet of Things. International Journal of Human-Computer Studies, vol. 81, pp. 31-48
[17]Valkanova, N., Jorda, S., Vande Moere, A. (2015), Public visualisation displays of citizen data: design, impact and implications. International Journal of Human-Computer Studies, vol. 81, 4-16.
[18]Albino, V., Berardi, U., Dangelico, R. M. (2015), Smart Cities: Definitions, Dimensions, Performance, and Initiatives, Journal of Urban Technology, vol. 22, no. 1, pp. 3-21.
[19]Steele, W., Legacy C. (2017), Critical Urban Infrastructure. Urban Policy and Research, vol. 35, no. 1, pp.
1-6.
[20]Danowski, J. A. (2013), WORDij version 3.0: Semantic network analysis software. Chicago, University of Illinois at Chicago.
[21]Bastian, M., Heymann, S., Jacomy, M. (2009), Gephi: an open source software for exploring and manipulating networks, Icwsm, vol. 8, pp. 361-362.
[22]Freeman, L. C. (1977), A set of measures of centrality based on betweenness. Sociometry, vol. 40, no. ,.
pp. 35-41.
[23]Brandes, U. (2001), A faster algorithm for betweenness centrality. Journal of Mathematical Sociology, vol.
25, no. 2, pp. 163-177.
[24]Paranyushkin, D. (2011), Identifying the pathways for meaning circulation using text network analysis, https://noduslabs.com/research/pathways-meaning-circulation-text-network-analysis/, date 2011, Berlin [25]Newman, M. (2010), Networks: An introduction. Oxford, Oxford University Press.
[26]Fortunato, S. (2010), Community detection in graphs. Physics Reports, vol. vol. 486, no. 3, pp. 75-174.
[27]Blondel, V. D., Guillaume, J. L., Lambiotte, R., Lefebvre, E. (2008), Fast unfolding of communities in large networks. Journal of statistical mechanics: theory and experiment, vol. 10, 10008.
[28]Kalimeri, M., Constantoudis, V., Papadimitriou, C., Karamanos, K., Diakonos, F. K., Papageorgiou, H.
(2012), Entropy analysis of word-length series of natural language texts: Effects of text language and genre.
International Journal of Bifurcation and Chaos, vol. 22 no. 09, 1250223.