CERS-IE WORKING PAPERS | KRTK-KTI MŰHELYTANULMÁNYOK
INSTITUTE OF ECONOMICS, CENTRE FOR ECONOMIC AND REGIONAL STUDIES, BUDAPEST, 2020
Gender differences in preferences of adolescents: evidence from a large-scale classroom experiment
DÁNIEL HORN – HUBERT JÁNOS KISS – TÜNDE LÉNÁRD
CERS-IE WP – 2021/3
January 2021
https://www.mtakti.hu/wp-content/uploads/2021/01/CERSIEWP202103.pdf
CERS-IE Working Papers are circulated to promote discussion and provoque comments, they have not been peer-reviewed.
Any references to discussion papers should clearly state that the paper is preliminary.
Materials published in this series may be subject to further publication.
ABSTRACT
In this study, we estimate unadjusted and adjusted gender gap in time preference, risk attitudes, altruism, trust, trustworthiness, cooperation and competitiveness using data on 1088 high-school students from 53 classes. These data, collected by running incentivized experiments in Hungarian classrooms, are linked to an administrative data source on the students’ standardized test scores, grades and family background. We find that after taking into account class fixed effects, females are significantly more altruistic (both with classmates and schoolmates), but are less present-biased, less risk tolerant, less trusting, less trustworthy and less competitive than males. At the same time we do not observe significant gender differences in patience, time inconsistency and cooperation at the 5% significance level. We also show that these initial gender differences do not change even if we control for age, family background, cognitive skills and school grades in a regression framework. Moreover, the gender gap also remains in all but one of these preferences even if we control for the other preference domains, suggesting that only risk preferences are confounded by the other preferences, at least as the gender gap in these preferences is concerned.
JEL codes: C80,C90,D91
Keywords: adolescents, altruism, competitiveness, cooperation, dictator game, patience, present bias, public goods game, risk preferences, social preferences, time inconsistency, time preferences, trust, trustworthiness
Dániel Horn
Institute of Economics, Centre for Economic and Regional Studies. 1097 Budapest, Tóth Kálmán utca 4.
and
Department of Economics, Corvinus University of Budapest. 1093 Budapest Fővám tér 8.
e-mail: horn.daniel@krtk.hu Hubert János Kiss
Institute of Economics, Centre for Economic and Regional Studies. 1097 Budapest, Tóth Kálmán utca 4.
and
Department of Economics, Corvinus University of Budapest. 1093 Budapest Fővám tér 8.
e-mail: kiss.hubert@krtk.hu
Tünde Lénárd
SOFI, Stockholm University. SE-106 91 Stockholm, Sweden and
Institute of Economics, Centre for Economic and Regional Studies. 1097 Budapest, Tóth Kálmán utca 4.
e-mail: tunde.lenard@sofi.su.se
Kamaszkori nemi különbségek a preferenciákban: egy nagyléptékű iskolai kísérlet eredményei
HORN DÁNIEL – KISS HUBERT JÁNOS – LÉNÁRD TÜNDE
ÖSSZEFOGLALÓ
Ebben a tanulmányban a nyers és kiigazított nemi különbségeket becsüljük meg az időpreferencia, a kockázattal szembeni attitűd, a nagylelkűség, a bizalom, a megbízhatóság, az együttműködés és a versengési preferenciák terén, amihez 53 osztály 1088 középiskolás diákjának adatait használtuk fel. Az adatokat, melyeket osztálytermi ösztönzött kísérletek során gyűjtöttük, a diákok adminisztratív adatforrásból származó standard tesztpontszámaihoz, jegyeihez és családi hátterét leíró adataihoz kötjük. Ha figyelembe vesszük az osztály fixhatásokat, a lányok szignifikánsan nagylelkűbbek (osztály- és iskolatárssal szemben is), kevésbé jelentorzítottak, kevésbé kockázattűrők, kevésbé bíznak a másikban, kevésbé megbízhatóak és kevésbé versengőek, mint a fiúk. Ezzel szemben nem találunk szignifikáns nemi különbséget türelemben, idő-inkonzisztenciában, és együttműködésben 5%- os szignifikanciaszinten. Azt is megmutatjuk, hogy ezek a nemi különbségek nem változnak akkor sem, ha regressziós elemzés keretein belül figyelembe vesszük a kort, a családi hátteret, a kognitív képességeket és az iskolai jegyeket. A nemi különbségek akkor is megmaradnak egy kivételével az összes preferenciát tekintve, ha az összes többi preferenciára is kontrollálunk, amiből arra következtethetünk, hogy csak a kockázati preferenciák függnek össze szorosan más preferenciákkal, legalábbis a nemi különbségek vonatkozásában.
JEL: C80,C90,D91
Kulcsszavak: bizalom, diktátor-játék, együttműködés, idő-inkonzisztencia,
időpreferencia, jelen-torzítás, kamaszok, kockázati preferencia, közjószág-játék,
megbízhatóság, nagylelkűség, társas preferencia, türelem, versengés
Gender differences in preferences of adolescents:
evidence from a large-scale classroom experiment ∗
D´ aniel Horn
§, Hubert J´ anos Kiss
¶, T¨ unde L´ en´ ard
kAbstract
In this study, we estimate unadjusted and adjusted gender gap in time preference, risk attitudes, altruism, trust, trustworthiness, cooperation and competitiveness using data on 1088 high-school students from 53 classes. These data, collected by running incentivized experiments in Hungarian classrooms, are linked to an admin- istrative data source on the students’ standardized test scores, grades and family background. We find that after taking into account class fixed effects, females are significantly more altruistic (both with classmates and schoolmates), but are less present-biased, less risk tolerant, less trusting, less trustworthy and less competi- tive than males. At the same time we do not observe significant gender differences in patience, time inconsistency and cooperation at the 5% significance level. We also show that these initial gender differences do not change even if we control for age, family background, cognitive skills and school grades in a regression frame- work. Moreover, the gender gap also remains in all but one of these preferences even if we control for the other preference domains, suggesting that only risk pref- erences are confounded by the other preferences, at least as the gender gap in these preferences is concerned.
JEL classifications: C80; C90; D91
Keywords: adolescents, altruism, competitiveness, cooperation, dictator game, pa- tience, present bias, public goods game, risk preferences, social preferences, time inconsistency, time preferences, trust, trustworthiness
∗The project has been funded by the National Research and Development Office of Hungary (project no. 124396). The experiments were run in Hungarian, and the related legal documents are available in Hungarian here: https://www.mtakti.hu/kapcsolat/altalanos-tajekoztato-a-kiserletekrol/.
§KRTK KTI (1097 Budapest T´oth K´alm´an u. 4., Hungary) and Corvinus University of Budapest (1093 Budapest F˝ov´am t´er 8., Hungary). E-mail: horn.daniel@krtk.mta.hu. Financial support from the Bolyai J´anos research scholarship and support by the ´UNKP-20-5-Corvinus-8 New National Excellence Program of the Ministry for Innovation and Technology from the source of the National Research, Development and Innovation Fund (NKFIH K 124396) is gratefully acknowledged.
¶Corresponding author. KRTK KTI (1097 Budapest T´oth K´alm´an u. 4., Hungary) and Corvinus University of Budapest (1093 Budapest F˝ov´am t´er 8., Hungary). E-mail: kiss.hubert@krtk.mta.hu
kSOFI, Stockholm University (SE-106 91 Stockholm, Sweden) and KRTK KTI (1097 Budapest T´oth K´alm´an u. 4., Hungary). E-mail: tunde.lenard@sofi.su.se
1 Introduction
Preferences matter. A large and growing literature shows that preferences strongly predict a wide array of real-life outcomes, including educational, labor market, financial and health choices (Dohmen et al., 2011; Falk et al., 2018; Golsteyn et al., 2014; Moffitt et al., 2011). Special attention has been given to gender differences in preferences as these may lead to inefficient social outcomes (Blau and Kahn, 2017; Buser et al., 2014;
Ellison and Swanson, 2010; Paglin and Rufolo, 1990).
Preferences evolve throughout childhood and adolescence, and there are several stud- ies shedding light on how gender shapes preferences, besides other important determi- nants like socioeconomic status. Understanding gender differences in preferences in childhood and adolescence is important as those preferences seem to be more malleable at younger ages (Ertac, 2020). Moreover, the gender intensification theory in psychol- ogy (Hill and Lynch, 1983) posits that adolescence reinforce societal expectations for gender-typed behavior (Rose and Rudolph, 2006), so investigating the factors that shape preferences in this age is an important endeavor.1
This paper investigates gender differences in time, risk, social and competitive pref- erences of high-school students using incentivized lab-in-the-field experiments conducted in 9 schools’ 53 school classes, with overall 1088 students in Hungary. The four most widely researched preference domains were measured in detail. We used the staircase (or unfolding brackets) method to measure time preferences (see Cornsweet, 1962; Falk et al., 2018). Following the beta-delta model proposed by Phelps and Pollak (1968) and Laibson (1997) we focus on the individual discount factor capturing the patience of the students (we often refer to it as delta), and on time consistency (we often call itbeta) as well as on present-bias (whenbeta<1). We opted for the bomb risk elicitation task (Crosetto and Filippin, 2013) to assess risk preferences. We were interested in various aspects of social preferences, so we measured altruism (proxied by the dictator game), trust and trustworthiness (with the trust game), and cooperation (with a two-person public goods game). Moreover, we used the dictator game to assess altruism toward a classmate and a schoolmate, varying the degree of social distance between the dictator and the recipient. We call our corresponding measures altruism / trust / trustworthi- ness / cooperation, higher values of the measures indicating a higher level of the given preference. Competitive preferences were estimated using the established experimental procedure by Niederle and Vesterlund (2007) and we refer to this measure ascompeti- tion. To ensure that the different tasks do not affect each other (e.g. receiving a low amount in the dictator game may influence how much a subject gives in the trust game), there was no feedback until the end of the experiment. A major strength of our study is that besides these preference measures, we obtained rich background information on the subjects from an administratively collected individual-level data source on the students’
previous cognitive abilities (proxied by their standardized test scores in mathematics
1Andersen et al. (2013) and Alan and Ertac (2019) illustrate this point related to the emergence of gender difference in competitiveness with evidence from field experiments.
and literacy), school performance (grades) and family background.
There is consensus in the literature (see meta-analyses by Croson and Gneezy, 2009;
Bertrand, 2011; Niederle, 2016) that there is a substantial gender difference in compet- itive preferences and no gender difference in time preferences.2 However, there is an ongoing debate if there are gender differences in risk and social preferences. While Eckel and Grossman (2008), Croson and Gneezy (2009) and Bertrand (2011) claim that a ro- bust gender difference exists in risk attitudes (women being more risk-averse), Niederle (2016) shows convincingly that this finding is dependent on the elicitation technique, a finding confirmed by Filippin and Crosetto (2016). Regarding social preferences, Bertrand (2011) argues that gender differences exist, Croson and Gneezy (2009) empha- size that women react in a more sensitive way to cues in the experimental context than men, and Niederle (2016) calls for further investigation to see if there are indeed gender differences. In a recent meta-analysis of the literature on the preferences of children and adolescents, Sutter et al. (2019) report findings mostly in line with the previous results that were blind to the age of the subjects. That is, there is no gender difference in time preferences, in bargaining situations (captured by the ultimatum and the trust games) and in cooperation, but there are gender differences in risk preferences (females being more risk-averse), in individual decision-making (proxied by the dictator game where females are more altruistic), and in competitiveness (females being less competitive).
This paper complements previous research on gender differences in preferences in two ways. First, we measure nine aspects of the four most widely used preferencesat once, so we can measure gender differences more precisely, conditional on correlated preferences.
The issue of correlated preferences has been addressed in some cases. For instance, risk preferences are often controlled for when measuring competitiveness, (see, for instance Buser et al., 2014), or when investigating time preferences, (see, for instance Andersen et al., 2008), but the same is typically not done when analyzing other preferences. Little is known about the rest of the potential correlations between the measured preferences and their effects on the gender gap. If there are significant correlations between the preferences - as we see in our data - not taking this into account might lead to an incorrect interpretation of gender differences in the various preference domains. While risk has been suspected of playing a role in many of the other preferences the same might be true for other preferences. For instance, we see that delta correlates significantly with the amount sent in the trust game and the contribution in the public goods game.
Therefore, estimating the gender gap in trust without taking into account the potential differences in patience could lead to under- or overestimated gender gaps. This study investigates if omitting other preferences is conducive to such issues or not.
Second and related to the previous point, given our rich data including information on family background, cognitive abilities and school performance (controls that have been found important determinants of preferences in the literature, see Sutter et al.
(2019)), we can assess how the unadjusted gender differences change as we take into
2There are just a very few papers that document no gender differences in competitiveness (Price, 2012) or that document gender differences in time preferences (Dittrich and Leipold, 2014).
account more and more controls. In other words, we are able to see when the gender difference disappears (if it does at all), which may shed light on factors mediating the gender difference in the given domain. Note also that even though our sample is not representative, by controlling for the factors mentioned above, we can account for poten- tial individual confounders in a way that if we find gender difference in a given domain, then the difference is likely to be genuine.
Without further controls, we observe gender differences in all the preferences, fe- males being less patient, less present-biased, more risk-averse, more altruistic (both with classmates and schoolmates), less trusting, less trustworthy, less cooperative and less competitive than males. However, our preferred baseline is when class fixed ef- fects are taken into account as they control for many unobserved factors that affect the same group of students. Once class fixed effects are considered, the gender difference in delta and cooperation vanishes. Interestingly, after applying an extensive set of further controls, including age, family background, cognitive abilities and school grades, the previous findings do not change. Hence, there seems to be a solid gender difference in risk preferences, altruism, trust, trustworthiness, competitiveness, time-consistency and present bias in adolescence. If we take the analysis one step further and control also for the rest of the preferences (risking over-control), then the gender gap disappears also in time-consistency and risk preferences, but significant gender difference (at 5%) remains in altruism, trust, trustworthiness, competitiveness and present-bias. Interestingly, fe- males are more altruistic (independently of the social distance from the recipient), while males are more trusting. We observe that in the dictator game females are more likely to split their endowment evenly than males, while in the trust game males are more likely to send all their endowment. These results are in line with previous findings in the literature according to which females are more egalitarian and concerned about payoff inequality (Fehr et al., 2013), while males are more efficiency-oriented and so more likely to make decisions that enhance the pie (Alm˚as et al., 2010; Sutter et al., 2018).
The study is organized as follows. Section 2 contains information about the exper- imental tasks that we used, the procedures, the rest of the variables and a descriptive analysis of the data. In section 3 we present the results, and section 4 concludes.
2 Data
From March 2019 to March 2020, we visited 9 secondary schools in Hungary to assess the economic preferences of students. Overall, we measured time, risk, social and com- petitive preferences of 1088 students in 53 school classes (groups of students studying the major subjects together as of the start of their upper-secondary education). The ex- periments were anonymous, but we can link the preference measures to individual-level data from the National Assessment of Basic Competences (NABC) (for details see Sinka, 2010), providing useful information about the participants’ previous standardized test scores, school grades and family background. With the detailed preference map of the students and the additional information on their background and school performance,
we can study how gender differences in preferences observed in adolescence depend on other observable factors.
In this section, first we briefly describe the procedures related to the experiments and the experimental tasks that we used. Then, we present our variables related to family background and cognitive abilities. We finish the section with some descriptive statistics of the variables. For a more detailed description of the collection of the experimental data see Horn et al. (2020).
2.1 Procedures
At the beginning of the project, we contacted all educational providers in Hungary with at least one secondary school to request permission to run the experiment in their institutions. Our sample contains schools that were either suggested by the provider and schools that - once the provider gave permission - indicated voluntarily their willingness to participate. Half of the sample operates in Budapest and the other half in smaller rural towns of Hungary.
Our sample is not representative of the total school population of Hungary. The so- cioeconomic status of the participating students is higher than that of the corresponding population. In terms of school performance, students in our sample achieved a higher average mathematics test score on the NABC in 6th grade than the population of all 6th-grade students in 2017.3
After arranging the schedule with the schools, but before the experiment, we sent out a data protection statement to all parents and children, explaining that we would ask for the students’ IDs used in the NABC so that we would be able to connect our experimental data to anonymous NABC data on school performance and socioeconomic background at the individual level.4 Participation was voluntary and anonymous.5
On experiment day, we unpacked our laptops in the school in a designated classroom, turning it into our laboratory for the day. The experiment was conducted using the z- Tree (Fischbacher, 2007) software. We ran the experiments during school hours (courses in Hungary are 45 minutes long followed by 15-minute break), so we had at most an hour to conduct the experiment with a given class and pay the participants. Participants knew each other as they were classmates in all sessions. After entering the classroom, participants were free to choose a seat. Once seated, the experimenter read aloud the instructions that students could also read from the sheet in front of them. Importantly, we explained in the instructions that participants would make decisions in 8 situations, many of them involving interaction with other participants, but we did not tell anything about the concrete experimental tasks. We emphasized that the experiment was not an exam, there were no correct answers, and that we were interested in how they would
3In Horn et al. (2020) we provide more information on the differences between the sample used in this study and the overall student population in Hungary.
4The NABC ID is a hash-code of the educational IDs of the students used only to identify students within the NABC surveys. It is not linked to any other data set. We notified the education providers that we would collect NABC IDs.
5There were two students who opted out from our experiment.
decide in a given situation. After that, questions and doubts were answered. Participants were assured that all decisions remained confidential. The experimenters made sure that participants did not speak with each other or disturb each other in any way during the experiment.
There were no time limits in the different tasks (except for the real-effort task to measure competitiveness), the only constraint being that we had to end the experiment before the next class. We asked participants to occupy themselves silently after they have finished, because potentially there could be large differences in how much it would take for different participants to make all the decisions. Even though there was a large variance in the time that participants spent with the tasks, there were no incidents related to it.
Time and risk preferences were measured using individual tasks, so the payoffs did not depend on the choices of other participants. The measurement of social and competitive preferences involved strategic interaction, so payoffs were interdependent. To create random student pairs, we used z-Tree (Fischbacher, 2007). Matching pairs was carried out always at the end of the experiment, after each student made the decisions in each task.6
We incentivized the participants with meal vouchers that could be used in the school cafeterias as cash. We made clear to the students that from the 8 experimental tasks one would be randomly chosen by the computer for payment, and that the game for payment would be the same for all participants. We explained carefully that if a task involved several choices (as the time preference measures did), only one randomly picked choice would be payoff-relevant. We paid no show-up fee, as we went to the schools during school hours. Payoffs in the different tasks were designed so that the expected payoff was around 1000 HUF (around 3 EUR), approximately the price of a full meal at an average school cafeteria.
We informed participants about the details of the payment (e.g. random selection of tasks for payment, use of vouchers) at the beginning of each session. Payoffs not involving delay were handed out in private at the end of the session.
2.2 Experimental tasks
Time preferences Time preferences reveal how an individual trades off earlier and later benefits. Using the beta-delta model proposed by Phelps and Pollak (1968) and Laibson (1997) we can differentiate between patience (delta) and time consistency (beta).
Patience indicates how an individual values the future relative to the present, while time consistency indicates if this relative valuation is the same at different points in time.
Patient individuals value the future more relative to the present than their less patient counterparts. Time consistency implies the same trade-off between earlier and later benefits at different points in time when separated by the same time interval. In con-
6With an odd number of students in the room, the last pair of students was in fact a group of three participants and the payments of students in this group were affected by the decision of only one of the other students who was also randomly chosen by the program.
trast to time consistent individuals, present-biased (future-biased) ones are more (less) impatient now than later. To capture both aspects of time preferences, we measured decisions at two different time horizons. Participants had to choose between receiving a smaller amount today or a larger amount in 2 weeks (task 1) and they made the same decision also for the dates 4 weeks vs. 6 weeks (task 6). In both cases, participants made 5 interdependent choices using the staircase (or unfolding brackets) method (see Corn- sweet, 1962; Falk et al., 2018). The benefit of this method is that it uses the available number of questions efficiently to find the approximate indifference point between the earlier and the later payoffs. In each case, the earlier amount was fixed (1000 HUF∼ 3 EUR) while the later amount (X) was changed in an adaptive way, depending on the previous choices. For instance, a choice of 1000 HUF today instead of X=1540 HUF in 2 weeks indicated that the indifference point was higher than 1540 HUF, so in the next question X was increased. X ranged from 1030 to 2150 HUF. After five questions we have a fairly accurate information about the indifference point.7 If the same participant in task 6 (4 weeks vs. 6 weeks) ends up with the same indifference point, then she is time consistent. A lower indifference point indicates present bias.
When one of the two time preference tasks was payoff-relevant, the computer chose randomly one of the 5 decisions and participants were paid according to their choice.
That is, students who chose to receive a larger amount two, four or six weeks later were asked to put their vouchers in an envelope, that indicated the name of the student and the date when the payment was to be received, which we placed at the school secretariat from where the students could claim their payment in two, four or six weeks.8
Risk preferences Attitudes toward risk are informative about an individual’s atti- tude toward uncertainty, so the corresponding tests generally involve some situation with uncertainty, mainly gambles (e.g. Eckel and Grossman, 2002; Gneezy and Potters, 1997; Holt and Laury, 2002). Based on our experience in a pilot experiment, gambles may seem strange to our student pool, so instead of gambles, we decided to use the bomb risk elicitation task by Crosetto and Filippin (2013), which is a more game-like measure of risk preferences, where higher values indicate higher risk tolerance.9 Crosetto and Filippin (2016) examine four, widely used risk elicitation methods in experimental eco- nomics, including the bomb risk elicitation method, and report that it is a valid measure
7If the participant in the last question chooses 1730 HUF in 2 weeks instead of 1000 HUF today, then (by the construction of the payoffs) we know that her indifference point is between 1730 HUF and the closest lower amount (1650 HUF). For simplicity, in this case, we assign the indifference point of 1650 to the participant, so she needs a 650 HUF compensation for waiting 2 weeks to receive the payment.
8We made sure to choose dates for the experiments so that these later payments can be received and the vouchers could be used without any problem, e.g. no later payment occurred during holidays.
The Covid-19 outbreak and the sudden school closures have affected some of the later payments, so we agreed with the schools to distribute these later payments to the students when normal routine returns.
Since the outbreak and the ensuing school closure was unexpected, the choices of the students should not have been influenced by these events.
9In this task, there is a store with 100 numbered boxes, one of which contains a bomb with uniform probability. Participants decide how many boxes to collect, following the numbering. If the bomb is in one of the boxes collected, then the participant earns no money, otherwise earnings increase with the number of boxes collected. The number of boxes collected is a proxy for risk preferences.
of risk preferences. We measured risk attitudes in task 4.
When this task was selected for payment, the computer generated a random number between 0 and 100 that determined the outcome of the risky situation and the earnings of the participants.
Social preferences There are many aspects of social preferences. In our experiment, we focused on four of them: altruism, trust, trustworthiness and cooperation.
Following standards of the profession, we measured altruism with the dictator game.
In fact, there were two dictator games. In both tasks, participants were endowed with 2000 HUF. In the first one (task 2), the participants had to decide how to split their endowment with a classmate in the room, while in the second one (task 3), the other party was not somebody from the room, but a random schoolmate. Task 2 was in- centivized, but task 3 was hypothetical as implementing the choice was not feasible.
When this task was payoff-relevant, the computer paired the participants randomly and selected randomly a member of each pair to be the dictator and her / his choice was implemented.
We measured trust and trustworthiness using a modification of the trust game (also known as investment game) by Berg et al. (1995). The modification consisted in that the receiver did not have an initial endowment. The game (task 7) consisted of two steps. In step 1, in the role of the sender, each participant decided how much of their endowment of 1000 HUF to send to a randomly selected receiver in the room, knowing that the amount would triple at the receiver, and in the second step, the receiver could send back any portion of that larger amount. The sent amount had to be a multiple of 100 and it is a measure of trust. In step 2, everybody assumed the role of the receiver and they had to choose how much they would return of the 3*X of sent X amount (X=0, 100, 200,...1000). That is, we have answers for all contingencies, and this stage provides information on the trustworthiness of the participants. More concretely, we calculate for every amount sent and tripled the share of the amount sent back, and we use the average of theses shares as our measure of trustworthiness.10 Everybody made a decision in both roles (as a sender and as a receiver). We modified the trust game to link it more to the dictator game where the recipient depends on the altruism of the dictator. Here this motive is still present, but it is complemented with the possibility of reciprocity by the receiver. In the role of the receiver, the reciprocity motive may become stronger relative to the standard trust game as without the sender sending money, she would end up with nothing. Hence, the modification both intensified the senders’ and the receivers’
motives to be prosocial. When this game became payoff-relevant, students were paired, and one student in each pair was randomly selected as sender. We used the decision of the receiver that corresponded to the sent amount to determine the players’ payoffs.
The third dimension of social preferences that we measured was cooperation. Using a two-person variant of public goods game (task 5), we endowed everybody with 1000 HUF and matched each participant randomly with somebody else from the room. They
10For instance, if X=300 and the receiver returns 450 HUF, then the share sent back is 3∗300450 = 0.5.
had to decide how much of the endowment to contribute to a common account, without knowing the decision of the other participant. The amount not contributed to the common project added to their payoff. The marginal per capita return was 75%, so each of the two participants received 75% of the total contributions, independently of the individual contribution. Our proxy for cooperation is the contribution to the common project: the more a participant contributes, the more cooperative she is.11 When this task was chosen for payment, the computer randomly paired the participants and based on their decisions the payoffs were calcualted and paid.
Competitiveness We measured competitiveness in the last task (task 8), using the setup by Niederle and Vesterlund (2007), but instead of adding up numbers, participants faced a real-effort task where they had to count zeros in 5x5 matrices (as in Abeler et al.
(2011)) for one minute. In the first stage (piece-rate) the number of correctly solved matrices determined the participants’ earnings. In stage 2, the outcome of a tournament defined the payoffs, where only the best 25% of the participants earned money for the task, though in this case, earnings were 4 times as high per matrix solved as in stage 1. At the end of stage 1 and 2 we provided feedback about how many matrices the participants solved correctly, but no information was given about their relative performance. In stage 3, students could decide whether to get paid by the piece-rate or by the tournament scheme. The tournament choice is the indicator of a participant being competitive. After stage 3, participants were asked to rank themselves (being in the 1st / 2nd / 3rd / 4th quartile) based on their performance in stage 1 and 2. This belief elicitation was incentivized, those who guessed correctly received 300 HUF. At the end of the experiment, when this task was selected for payment, the computer picked one of the stages randomly and participants were paid according to their performance in that stage.
Order It was not obvious in which order to implement the 8 tasks. The following considerations governed our decision when establishing the order. Since participants might have unwittingly tried to be consistent in their choices in the two time preference tasks, we wanted to have them somewhat apart, introducing other tasks between them.
In the two dictator games, the only difference was the reference group so we put these questions close to each other, since we did not think that participants would want to be consistent in giving the same amount to classmates and schoolmates. Our aim was that participants consider the different tasks as separate and independent decisions, so in the first 7 tasks, we did not give any feedback to them. Note that in the first 7 tasks there is no clear good choice. However, in last one, the competitiveness task participants received feedback about their absolute performance (that is, the number of matrices
11To make the decision easier, on the decision screen, participants had two sliders, both of them going from 0 to 1000, the first representing their contribution and the second corresponding to their co-player’s contribution. By moving the sliders, they could see the payoff consequences of different contribution combinations. Figure 7 in Horn et al. (2020) contains a screenshot of the decision screen.
solved) and the (potential) earnings that those performances implied.12 Knowing the absolute performance may affect the participants emotionally (e.g. having earned a lot of money in the piece-rate stage may cause elation), so we put the competitiveness task at the end. All participants made decisions in the same order. An advantage of having a fixed order of tasks for all students is that students’ decisions are directly comparable, while the drawback is that we do not know whether order effect influenced the choices (e.g., would students make the same decisions in the time preference tasks if those tasks are the last ones?). As a consequence, all our findings are conditional on the special order that the participants played the games.
2.3 Family background and cognitive abilities
Besides the preferences that we measured at schools, the other main variables of in- terest are related to demography (age, gender), the family background of the students, their school performance and their cognitive abilities. We obtained these student-level variables from the NABC database. Data on gender and age are missing only for a few cases, but socioeconomic status is missing in 16% of the cases and GPA in 24% of the cases, because these were self-reported in the NABC questionnaire. For family back- ground, we transformed all categorical variables into dummy variables, where missing was a separate category. For the GPA, we imputed missing values with the sample mean and controlled for the imputed values with a separate missing dummy.
The family background variables that we consider are: the highest level of parents education, father’s employment status, whether the family receives regular child pro- tection support and the number of books at home. We proxy cognitive ability with standardized mathematics and reading test scores measured in grade 6 (around age 12).
As a further set of controls for school performance, we use teacher-given class-marks from grade 6: GPA, as well as separate grades in mathematics, Hungarian language, literature, sedulity and conduct.
2.4 Some descriptive statistics about the sample
In our sample of 1088 students, we have 611 females and 477 males. Table 1 shows the pairwise correlations of the preference measures as well as their significance level while Table 2 shows the average difference between males and females in all observed characteristics and the corresponding t-statistic.13
Unsurprisingly, different preference measures within a preference domain are well correlated - i.e. altruism, trust, trustworthiness and cooperation within social prefer- ences, as well as delta and beta within the time preference domain. Risk is correlated
12We did not inform participants after stage 2 if they were in the best 25% of students. We only let them know the number of correctly solved matrices and the payoff if they happened to be in the best 25%, but we did not tell them if they were or were not.
13Table 4 in the Appendix gives descriptive information about all utilized controls as well as about the measured preferences by gender.
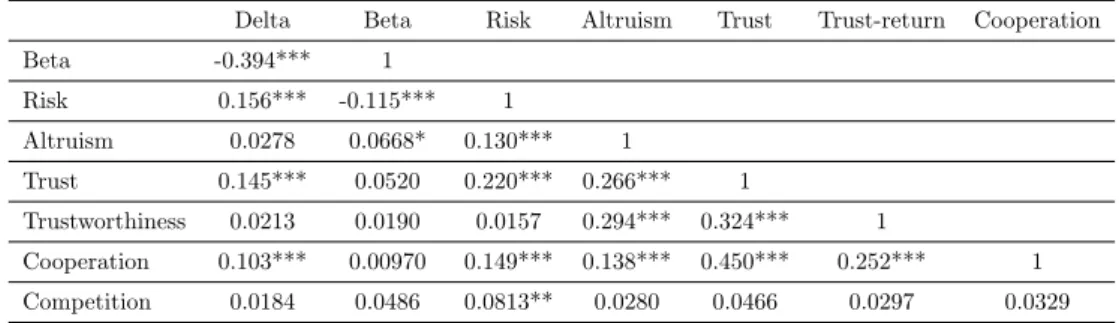
Table 1: Pairwise correlations between preferences
Delta Beta Risk Altruism Trust Trust-return Cooperation
Beta -0.394*** 1
Risk 0.156*** -0.115*** 1
Altruism 0.0278 0.0668* 0.130*** 1
Trust 0.145*** 0.0520 0.220*** 0.266*** 1
Trustworthiness 0.0213 0.0190 0.0157 0.294*** 0.324*** 1
Cooperation 0.103*** 0.00970 0.149*** 0.138*** 0.450*** 0.252*** 1 Competition 0.0184 0.0486 0.0813** 0.0280 0.0466 0.0297 0.0329
with most of the measured preferences, suggesting that it has a prime role among pref- erences. There are also some less straightforward associations: delta is correlated with trust and cooperation.14 Competition seems to be the most unique preference as it correlates only with risk.
According to Table 2, while in most cases there is no statistical difference between females and males, some variables are significantly different. Apparently, males in our sample have better family background, as their parents are relatively more educated and less likely to be self-employed. The number of books also indicates a higher socioeco- nomic status of males. Males have higher mathematics and reading test scores in grade 6 in our sample, indicating better cognitive abilities. These differences are likely to be interrelated as better test scores may be due to better family background. If we look at within class differences in these variables, only very few of them remain significant (e.g. females’ parents are more likely to be medium level educated, but not less or more educated), and few reverse their sign (e.g. females have higher GPA within class due to their higher Hungarian and literature grades, but males have significantly higher math test scores).15 This suggests that while our sample of classes are far from being representative, the within class gender differences resemble that of the total population better.16
3 Results
Our main variable of interest is the gender dummy (female) that indicates if females make different decisions in the given preference task. For each preference measure, the first specification is the raw difference between the genders: the female coefficient with- out any control variables. But as we have shown above, our sample is quite imbalanced if we do not control for the fact that our respondents are clustered within classes. Hence, the second specification adds the class fixed effects (class FE). Their inclusion allows us
14This might be due to the fact that both the trust game and the public goods game have a slight time element in the sense that one has to wait until the other player decides to know the outcome.
15See section A in the Appendix for more details.
16In the 2017 NABC 6th grade full database females have 8 points lower maths scores and 55 points higher reading scores than males. Females also have a 0.24 points higher GPA, 0.4 points higher Hungarian and 0.33 higher literature grades than boys, while boys score 0.15 points higher in maths than females.
Table 2: Average difference of all variables between males and females T-test
Diff. t-stat NABC data
Age (in months) 0.684 (0.83)
Family
parental ed.: low 0.00496 (0.62)
parental ed.: medium 0.124*** (4.27) parental ed.: high −0.108*** (−3.55) parental ed.: missing −0.0216 (−1.17) father: employed −0.0421 (−1.45) father: self-employed 0.0549* (2.55) father: regural work 0.00405 (0.46) father: occasional work −0.00741 (−1.01) father: childcare −0.00368 (−0.50)
father: retired 0.00890 (1.53)
father: unemployed 0.00609 (1.35)
father: disabled 0.00563 (1.08)
father: missing −0.0264 (−1.29)
child support: no −0.0109 (−0.42)
child support: yes 0.0364 (1.81)
child support: missing −0.0255 (−1.34)
No. books: 0-50 0.00140 (0.09)
No. books: cca. 50 0.0337* (2.01) No. books: max. 150 0.0256 (1.11)
No. books: max 300 0.0246 (1.13)
No. books: 300-600 0.00239 (0.11) No. books: 600-1000 −0.00712 (−0.32) No. books: over 1000 −0.0599** (−2.81) No. books: missing −0.0206 (−1.14) Cognitive skills
Math score, 6th grade −106.9*** (−9.08) Reading score, 6th grade −25.48* (−2.16) Grades
GPA, imputed 0.0361 (1.35)
GPA, missing −0.00721 (−0.30)
Math grade, imputed −0.105* (−2.03) Hungarian grade, imputed 0.0839 (1.92) Literature grade, imputed 0.0768 (1.94) Math grade, missing −0.0305 (−1.42) Hungarian grade, missing −0.0251 (−1.17) Literature grade, missing −0.0298 (−1.37) Experiments
Payoff −23.01 (−0.45)
Delta −0.0402*** (−4.27)
Beta 0.0532*** (3.85)
Risk −6.294*** (−5.39)
Competition −0.101*** (−3.40)
Altruism 5.932*** (5.34)
Altruism (school mate) 4.550*** (3.67)
Trust −8.215*** (−5.36)
Trust-return −3.058** (−3.08)
Cooperation −3.842* (−2.28)
/***/**/* denote significance at 1 / 5 / 10%.
to take into account the following: i) all experiments were conducted within a classroom at a given time and place under similar circumstances; ii) participants play some of the games with their peers in the classroom; iii) students are likely to be selected into different classes (and hence our imbalance in the covariates). In fact, we believe that the results of this specification would probably be closer to a representative sample, had we have one. Henceforth, when including additional controls to our models, we will use the class fixed-effect model as a reference. In the next specification, we control for age as it has been shown to be an important determinant of preferences during adolescence (see Sutter et al., 2019). Then, we control for family background by considering various aspects of the socio-economic status (family), see section 2.3. In the next specification, we include the mathematics and reading test scores from grade 6, assuming that they are good proxies ofcognitive skills. Then, we also addgradesto control for school perfor- mance. Besides the grade point average, we also take mathematics, Hungarian language and literature into account. In the last specification we control for all other preferences, thereby testing if the association of gender with the preference of interest is confounded by the other preferences.17
By controlling for exogenous factors like age, family characteristics, cognitive skills and school performance, we not only control for the biases in our sample but also try to speculate about the mechanisms through which gender associates with preference measures. Finally, by controlling for all other measured preferences, we test whether the given preferences have a direct (ceteris paribus) effect on the differences between genders.
To ease the exposition of the results, we use coefficient plots that visualize the esti- mation of the coefficient of the female dummy with the corresponding 95% confidence intervals. Section C in the Appendix contains the full regression tables. To present our findings in a structured way, we use the same descriptive statistics and the same specifications in all of the regressions for the analysis of the different preferences below.
3.1 Time preferences
The existing literature did not produce a clear-cut finding if there is a gender difference in the patience of adolescents. Some studies report females being more patient (Bettinger and Slonim, 2007; Castillo et al., 2011, 2019), while others document the opposite result (Golsteyn et al., 2014). Some individual factors are argued to have a direct effect on time preferences. Patience is shown to increase with age (Bettinger and Slonim, 2007), while low social status is likely to predict more impatient choices (Castillo et al., 2011).
There is also some evidence that better cognitive abilities associate with more patience (Luehrmann et al., 2018). Regarding present bias, Tymula (2019) and Luehrmann et al.
(2018) do not find gender differences.
17We only control for the ”main” preferences from the four domains - delta, risk, altruism, trust, cooperation and competition - and we never control for preferences from the same domain. So we do not take delta into account when we look at beta, nor do we control for the other social preferences, when we look at altruism, trust or cooperation.
Our measure of patience (delta) is the individual discount factor that we calculate based on task 6, the intertemporal choice between a lower amount of money in 4 weeks and a larger amount of money in 6 weeks. Assuming linear utility, the indifference amount of 1000 HUF to be received in 6 weeks (denoted byx6) comes from the equation 1000 =delta∗x6, weredelta denotes patience. In our sample, delta ranges from 0.33 to 0.97. The mean for females is 0.73 and for males is 0.77.
0.05.1.15.2
Fraction
.2 .4 .6 .8 1
Male Female
Figure 1: Distribution of time-discounting (delta) by gender
Figure 1 shows the distribution of delta by gender and reveals that the difference between females and males is mainly due to the fact that there are more males at the upper end of the distribution. More precisely, more males exhibit the maximum level of patience than females.18
Figure 2 represents the coefficient plot of the regression analysis (see Table 6 in the Appendix for the full regression). The first point in Figure 2 shows the difference in the raw data, confirming that there is a significant gender difference in patience. However, once we add class fixed effects, the gender difference disappears and remains so in the rest of the specifications. Therefore, if the individual characteristics of the participants and features of the environment are controlled for, there seems to be no gender difference in patience.
We compute the time inconsistency parameter (beta) by applying the delta - beta model (Phelps and Pollak, 1968; Laibson, 1997) to the observations from experimen- tal tasks 1 and 6. Using the previously computed delta parameter and denoting the indifference amount of today’s 1000 HUF to be received in 2 weeks by x2, beta is given by 1000 =beta∗delta∗x2. In our sample,beta ranges from 0.34 to 2.91. The
18The Wilcoxon rank-sum test (p-value<0.001) indicates that overall, males are more patient than females. The Kolmogorov-Smirnov test shows that the two distributions are not equal (p-value<0.001).
−.06−.04−.020.02
Female
none +class FE
+age +family
+cogn. skills +grades +preferences
Figure 2: Adjusted gender differences in time-discounting (Delta)
mean for females is 1.05, while for males it is 1.19 These values near 1 indicate that on average, females and males are quite time consistent. Even though the distribu- tions of beta illustrated in Figure 3 seem to be very similar for females and males, the Kolmogorov-Smirnov test rejects the equality of distributions (p-value<0.01). The Wilcoxon rank-sum test indicates that the beta of females is different from the beta of males (p-value<0.001). In order to be able to test time inconsistency in a linear regres- sion framework we have transformed the beta parameter: the greater the distance from the value 1 the greater the time inconsistency. Hence, we subtracted 1 from beta and took its absolute value, before running the regressions below. Thereby, the female coef- ficient can straightforwardly be interpreted as gender differences in time inconsistency.
Figure 4 shows that there is no significant gender difference in time inconsistency.
The initial raw significant difference disappears after taking into account class fixed effects and the lack of gender gap remains even after we control for all observable char- acteristics and the rest of the preferences.
Time inconsistency comprises any deviation from time consistency: individuals be- ing more impatient now than in the future (known as present bias) or the other way around (known as future bias). However, more attention has been given to present bias as it relates to procrastinating behavior and suboptimal life outcomes (Ariely and Wertenbroch, 2002; Moffitt et al., 2011; Daly et al., 2015; Wang and Sloan, 2018). To study present bias, we restrict our attention to beta<1, and generate a dummy variable where present bias=1 if beta<1 and beta=0 if beta≥1. 32.8% of the students, 29.8%
of the females and 36.7% of the males are present biased. The test of proportions re- veals that there is a significant difference in the proportion of present-biased students
19Luehrmann et al. (2018) report similar range of values for time inconsistency.
0.1.2.3.4
Fraction
.5 1 1.5 2 2.5 3
Male Female
Figure 3: Distribution of time inconsistency (beta) by gender
−.04−.020.02.04
Female
none +class FE
+age +family
+cogn. skills +grades +preferences
Figure 4: Adjusted gender differences in time inconsistency (|beta-1|)
between females and males (two-tailed test, p-value=0.0179), indicating that males are more present-biased than females. Figure 5 shows that this difference is persistent and though it diminishes somewhat when adding the observable characteristics, it remains statistically significant throughout our analysis (see Table 8 in the Appendix).
When we compare the female coefficients statistically across models, it is apparent, that the included exogenous covariates or preferences do not have a significant effect on its size, that is, no observable individual characteristic affects the gender gap in time preferences (see Table 5 in the Appendix that shows the direct comparison of the female coefficients across models).
−.15−.1−.050
Female
none +class FE
+age +family
+cogn. skills +grades +preferences
Figure 5: Adjusted gender differences in present bias (beta<1)
3.2 Risk preferences
Studies about risk preferences during adolescence mostly find that females are more risk- averse than males (Borghans et al., 2009; Booth and Nolen, 2012b; Eckel et al., 2012;
Sutter et al., 2013). There seems to be an age trend, older children are less risk-taking (Harbaugh et al., 2002). Moreover, Khachatryan et al. (2015) find that the gender gap in risk-taking becomes larger in adolescence. Socioeconomic status also seems to matter, as low status associates with more risk-taking, though the evidence here comes mainly from the childhood (Deckers et al., 2015, 2017; Alan et al., 2017).
Regarding risk attitudes, there is mounting evidence that the type of risk elicitation task matters, as some tasks are more likely to reveal gender differences than others (see Filippin and Crosetto, 2016; Niederle, 2016). Crosetto and Filippin (2013, 2016) show that there is no general gender difference in risk-taking in the bomb risk elicitation task that we use, although the participants where older in both studies than the students in our sample.
0.05.1.15.2
Fraction
0 20 40 60 80 100
Male Female
Figure 6: Distribution of risk preferences by gender
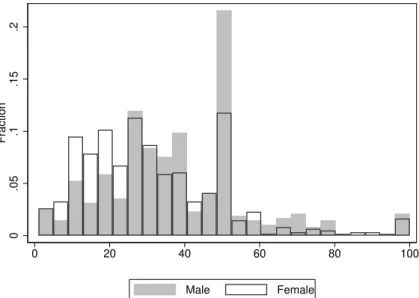
The distributions in Figure 6 indicate that females tended to take out fewer boxes in the bomb risk elicitation task, that is, they are less risk-taking. There is also a marked difference in the choice of 50 boxes that seems to be a focal point. Males chose this number more often than females.20
While males were willing to take an average of 37.7 boxes out of the store, females chose to take out only 31.4.21 Figure 7 indicates that this difference is statistically sig-
20The Kolmogorov-Smirnov test reveals that the distributions are not equal (p<0.001), and the Wilcoxon rank-sum test indicates that males are more risk-taking (p<0.001).
21Usually, both females and males are willing to take more risk in this task than our sample of students. For instance in Crosetto and Filippin (2013) females / males take out 43.4 / 44.2 boxes.
−8−6−4−202
Female
none +class FE
+age +family
+cogn. skills +grades +preferences
Figure 7: Adjusted gender differences in risk preferences
nificant at 5% and persists even if we take into account class fixed effects, age, variables related to the family background and proxies for cognitive abilities and school perfor- mance. However, when we control for the other preferences the difference becomes insignificant (though the sign of the coefficient does not change). When only the prefer- ence measures are considered, all preferences except trustworthiness associate with risk at a significance level of at least 5%, see Table 1. Moreover, many preferences (delta, altruism, trust and competition) associate with risk significantly ceteris paribus, even if we control for all other preference measures, which suggests that risk is a preference present in many other domains (see Table 9 in the Appendix). This result might also be interpreted as the result of risk preferences mirroring the gender effects of the other preferences, or conversely the gender difference in risk preferences drives some of the gender effect in the other preferences. While using these data we cannot tell which of these directions is more pronounced, it is important to underline that risk is a preference that is inherent in many of the other preference domains and that the gender gap in risk also associates with gender differences within the other preferences.
A caveat is in order. We have used a risk preference elicitation task that generally does not lead to gender difference with university students. We do not know whether we would have obtained the same conclusions, had we used an elicitation task that usually leads to gender difference in risk-taking, like the investment game by Gneezy and Potters (1997) (see Charness and Gneezy (2012)). Potentially, with such a task the gender difference would survive, a conjecture that future research will confirm or reject.
3.3 Social preferences
3.3.1 Altruism
During adolescence, females tend to be more altruistic (Harbaugh et al., 2003; Bettinger and Slonim, 2006) and altruism increases with age (Harbaugh et al., 2003; Bettinger and Slonim, 2006; Fehr et al., 2013).22 The association of socioeconomic status with altruism is less clear. For younger children, low status correlates with giving less in the dictator game (Bauer et al., 2014; Deckers et al., 2017; Kosse et al., 2020). For adolescents, on the other hand, the only evidence (Alm˚as et al., 2017) that we are aware of shows that low-status individuals are more egalitarian than individuals from a different background.
Following the literature, we proxy altruism with the amount given in the dictator game. While females in our sample gave 41.7% of their endowment to their classmates, males gave only 35.8%. Figure 8 indicates that females chose the egalitarian split more often than males (in line with findings by Fehr et al. (2013)), while the latter are more likely to give zero.23
0.2.4.6
Fraction
0 20 40 60 80 100
Male Female
Figure 8: Distribution of altruism (proxied by giving in the dictator game with class- mate) by gender
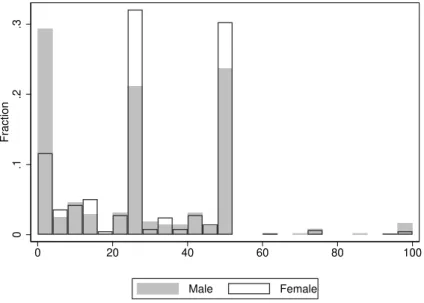
We observe similar patterns when we consider how much the students give to a ran- dom schoolmate, but understandably the amount given decreases substantially. Figure 9 shows that females chose the egalitarian split more often and gave zero less frequently than males. Moreover, giving 25% of the endowment seems to be the focal point, and the
22The effect of age is more complex as the change in altruism is intertwined with the application of meritocratic principles (Alm˚as et al., 2010) and an increasing concern for efficiency (Maggian and Villeval, 2016; Sutter et al., 2018).
23The Wilcoxon rank-sum test and the Kolmogorov-Smirnov test indicate that the differences in the median and the distributions are significant (p-values<0.001 in both cases).
share of females giving this percentage is higher than that of males. As to classmates, more males gave zero to a random schoolmate than females. Overall, both females and males gave less to a schoolmate than to a classmate (29.6% and 25.1% of their endow- ment) in our sample, but the significant gender difference remains.24 This suggests that the gender difference in altruism does not depend on the social distance between the dictator and the recipient.
0.1.2.3
Fraction
0 20 40 60 80 100
Male Female
Figure 9: Distribution of altruism (proxied by giving in thedictator game with school- mate) by gender
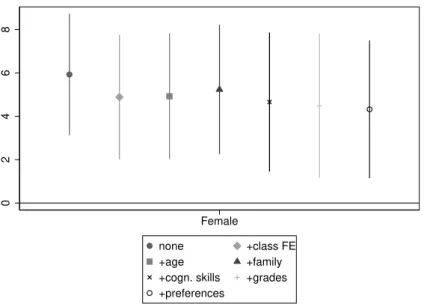
Figures 10 and 11 indicate that in line with the literature, females are significantly more altruistic than males, even if we add all the controls that we can observe. Hence, the significant difference is not due to differences in socioeconomic status, cognitive abilities, school grades or correlation with other preferences. There is no significant difference between the female coefficients across models (see Table 5 in the Appendix).
24Again, both the Wilcoxon rank-sum test and the Kolmogorov-Smirnov test indicate that the dif- ferences are significant (p-values<0.001 in both cases).
02468
Female
none +class FE
+age +family
+cogn. skills +grades +preferences
Figure 10: Adjusted gender differences in altruism (proxied by giving in the dictator game with classmate)
02468
Female
none +class FE
+age +family
+cogn. skills +grades +preferences
Figure 11: Adjusted gender differences in altruism (proxied by giving in the dictator game with schoolmate)
3.3.2 Trust and trustworthiness
No gender differences have been reported for the trust game in the literature, but the amount sent by the trustor and the amount returned by the trustee tend to increase with age (Harbaugh et al., 2003; Sutter and Kocher, 2007).
We played a modified version of the trust game as the receiver had no initial endow- ment. The modification of the game implies that the receiver ends up without money if the sender does not send her / him anything. Thus, altruistic motives behind the sending behavior of the sender are stronger than in the standard game. This small mod- ification allows us to directly compare both stages of the trust game with the dictator game as both differ from the dictator game in one aspect only. The sending stage of the trust game differs from the dictator game in that the sender can expect some reciprocity, while the altruistic motives behind the decisions are similar (and certainly stronger than in the standard trust game). The return stage of the trust game differs from the dictator game only in that the trustee received the amount from the sender and not from the experimenter, but there is no reciprocity, just as in the dictator game. Overall, the modification increases the altruistic motives compared to the standard trust game.
In this light, it seems important that we find that males sent more of their endowment than females in both stages of the trust game, while females sent more in the dictator game (41.7% vs. 35.8% of their endowments, as shown above). In the first stage of the trust game, males sent 59.8% and females sent 51.6%. In the second stage, males - again - sent more than females (40.3% vs. 37.3%).25
Figure 12 indicates that the gender difference in the first stage of the trust game is due to the fact that almost 25% of the males sent their entire endowment to the receiver, while only less than 7% of females did so.26 An explanation may be the difference in the weight that females and males assign to equality and efficiency (that is, making the overall pie bigger). Alm˚as et al. (2010) and Maggian and Villeval (2016) point out that efficiency seeking becomes an important motive in adolescence (while egalitarianism matters less), and efficiency concerns are stronger in the case of males (Sutter et al., 2018).
Figure 13 shows that as we add controls, the gender difference in trust shrinks, but it does not disappear. Males still send more of their endowment in the first stage of the trust game, even after all their observable characteristics - including their time, risk and competitive preferences - are controlled for.
Turning to trustworthiness (the second stage of the trust game), Figure 14 indicates that males’ decisions are more extreme: they are more likely to send nothing back, but they are also more likely to send half of the received (and tripled) amount back, or even
25In the experiment, when playing the role of the receiver, students made a decision on how much to send back to the sender for each possible amount that they could receive. That is, we asked for ten separate decisions. We asked that if s/he received 100/200/.../900/1000 HUF, how much s/he would send back from the tripled 300/600/.../2700/3000 HUF. We calculated the corresponding shares for each decision and computed the average. This is our proxy for trustworthiness.
26Both the Wilcoxon rank-sum test and the Kolmogorov-Smirnov tests indicate that males and fe- males behave differently in the first stage of the trust game (p-value<0.0001 in both cases)
0.1.2.3.4
Fraction
0 20 40 60 80 100
Male Female
Figure 12: Distribution of trust by gender
−12−10−8−6−4−2
Female
none +class FE
+age +family
+cogn. skills +grades +preferences
Figure 13: Adjusted gender differences in trust
0.05.1.15.2.25
Fraction
0 20 40 60 80 100
Male Female
Figure 14: Distribution of trustworthiness by gender
above that.27 Figure 15 shows that the gender difference remains significant at 5% even if we add all the controls we have, including preferences.
Overall, we see that females tend to be more altruistic when they cannot expect anything in exchange and when the endowment is independent of the co-player. If any of these changes, males tend to send more. Figure 16 shows the distribution of residuals from the three separate models of altruism, trust and trustworthiness, where we have controlled for all observable characteristics (including preferences) except the gender of the students. The more the distribution of trust and trustworthiness residuals differ from the dictator game, the more responsive students are to the changes between games. For females both the trust and the trustworthiness residuals are shifted to the left, indicating a general tendency to lower the amounts if parameters of the models change. Males, on the other hand, seem to react much less to the changes between the dictator game and the second stage of the trust game (albeit there is a slight bump at the lower end of the dictator game distribution), but much more to the changes between the dictator game and the trust game. That is, males react more to changes concerning reciprocity but less to changes in the source of the endowment, while females respond strongly to both.
27The differences in the medians and the distributions are significant according to the Wilcoxon rank-sum test and the Kolmogorov-Smirnov test (p-values<0.0005 in both cases).
−6−4−20
Female
none +class FE
+age +family
+cogn. skills +grades +preferences
Figure 15: Adjusted gender differences in trustworthiness
0.01.02.03.04
−50 0 50
Female
0.005.01.015.02.025
−100 −50 0 50 100
Male
Altruism Trust
Trustworthiness
Figure 16: Distribution of residuals