UN CORRECTED PR
OOF
https://doi.org/10.1007/s12104-017-9792-1 ARTICLE
Chemical shift assignments of the partially deuterated Fyn SH2–SH3 domain
Fabien Kieken1,2,3 · Karine Loth4,5 · Nico van Nuland1,2 · Peter Tompa1,2 · Tom Lenaerts3,6,7
Received: 3 July 2017 / Accepted: 28 November 2017
© Springer Science+Business Media B.V., part of Springer Nature 2017
Abstract
Src Homology 2 and 3 (SH2 and SH3) are two key protein interaction modules involved in regulating the activity of many proteins such as tyrosine kinases and phosphatases by respective recognition of phosphotyrosine and proline-rich regions. In the Src family kinases, the inactive state of the protein is the direct result of the interaction of the SH2 and the SH3 domain with intra-molecular regions, leading to a closed structure incompetent with substrate modification. Here, we report the 1H,
15N and 13C backbone- and side-chain chemical shift assignments of the partially deuterated Fyn SH3–SH2 domain and structural differences between tandem and single domains. The BMRB accession number is 27165.
Keywords SH3–SH2 · Tandem domains · NMR · Fyn kinase · Src family
Biological context
The Src family consists of 11 non-receptor tyrosine kinases involved in a plethora of fundamental biological processes including cell growth, differentiation, cellular adhesion, cell migration (Manning et al. 2002). The structural organization of each family member is equivalent: They are composed of
four different domains—SH1 to SH4—with a C-terminal negative regulatory tail. The SH4 domain located in the N-terminus anchors the proteins to the plasma membrane and is attributed with the varying physiological functions of the family members (Sato et al. 2009). SH3 and SH2 domains are involved in regulating kinase activity and medi- ate the interaction of the kinase with its protein partners, and SH1 is the kinase domain (Boggon and Eck 2004; Sicheri and Kuriyan 1997). Src family kinases (SFK) catalytic activ- ity is determined by intermolecular interactions and equilib- rium of phosphorylation-dephosphorylation states. Activa- tion of the kinase is triggered by the dephosphorylation of the phospho-tyrosine in the C-terminus, which in turn results in the initiation of signaling cascades that drive basic cel- lular function (Huculeci et al. 2016; Xu et al. 1999). Given their important role in fundamental physiological and patho- logical processes, members of the SFK have been widely investigated in various biological contexts.
Fyn, one of the SFK members, regulates numerous cel- lular processes including motility, growth, differentiation and signal transduction in various cell types (Saito et al.
2010). The Fyn gene has three splice variants, one of which is deemed inactive. FynT is highly expressed in cells of hematopoietic lineage and regulates immune cell functions and inflammatory responses. The other active form FynB is ubiquitous, with the highest expression in the synaptic architecture of the central nervous system, playing impor- tant roles in glutamate receptor trafficking and synaptic
* Tom Lenaerts
Tom.Lenaerts@ulb.ac.be
1 Structural Biology Brussels, Vrije Universiteit Brussel, Pleinlaan 2, 1050 Brussel, Belgium
2 Center for Structural Biology, VIB, Pleinlaan 2, 1050 Brussel, Belgium
3 AI-lab, Vakgroep Computerwetenschappen, Vrije Universiteit Brussel, Pleinlaan 2, 1050 Brussels, Belgium
4 Centre de Biophysique Moléculaire, Centre National de la Recherche Scientifique (CNRS) UPR 4301, Université d’Orléans, rue Charles Sadron, 45071 Orléans Cedex 2, France
5 Collegium Sciences et Techniques, Université d’Orléans, rue de Chartres, 45100 Orléans, France
6 MLG, Départment d’Informatique, Université Libre de Bruxelles, Boulevard du Triomphe, CP 212, 1050 Brussels, Belgium
7 Interuniversity Institute of Bioinformatics Brussels (IB2), ULB-VUB, La Plaine Campus, Boulevard du Triomphe, CP 1
2 3
4
5 6
7 8 9 10 11 12 13
14
15
16 17 18 19 20 21
22 23 24 25 26 27 28 29 30 31 32 33 34 35 36 37 38 39 40 41 42 43 44 45 46 47 48 A1
A2 A3 A4 A5 A6 A7 A8 A9 A10 A11 A12 A13 A14 A15 A16 A17 A18 A19
UN CORRECTED PR
OOF
plasticity (Grant et al. 1992; Kojima et al. 1998; Nakazawa et al. 2001; Prybylowski et al. 2005; Suzuki and Okumura- Noji 1995). Beyond it’s basic physiological functions, Fyn has been widely investigated as a therapeutic target due to its implication in the pathophysiology of various cancers, neurodegenerative and psychiatric diseases (Nygaard et al.
2014; Ohnuma et al. 2003; Panicker et al. 2015). Fyn has been found significantly upregulated in cancer tissues, with its level correlating with aggressive disease progression and metastasis [review (Elias and Ditzel 2015)], which results from promoting cancer cell proliferation and inhibition of cell death (Elias et al. 2015; Li et al. 2003). Inhibition of Fyn function is thought to have therapeutic potential in cancer and neurodegenerative conditions. Various inhibitors of Fyn kinase domain are available; however these carry various safety liabilities and long term toxicity due to lack of speci- ficity in inhibiting kinase functions (Grant 2009).
Fyn’s SH1 activity is regulated by the intramolecular interactions with two of its domains, SH3 and SH2. SH3 domains interact primarily with sequences rich in proline, such as PxxP motifs, although they can also bind other sequences that deviate from the canonical one [review (Sak- sela and Permi 2012)], whereas SH2 domains recognize and bind phosphotyrosine residues (Pawson 1995). Fyn SH2 is responsible for the state of activation of the kinase. Phos- phorylated Tyr527 allows a direct interaction between Fyn SH2 with the C-terminus, resulting in an inactive kinase state. The kinase self-activation occurs during the dephos- phorylation of Tyr527 and/or the binding of protein partners, allowing the dissociation between SH3, SH2, and the kinase domain [review in (Roskoski 2015)].
The mechanism of propagation of the information or cross-communication between the two domains is not well investigated and has led to controversial reports. While the SH3 domain enhances Fyn SH2-mediated ligand binding (Panchamoorthy et al. 1994) and the replacement of the SH3–SH2 linker residues with glycines activates c-Src (Young et al. 2001), the analysis of the dynamics of Fyn SH3–SH2 by nuclear magnetic resonance (NMR) T1/T2/ NOE, domain alignment by residual dipolar couplings and crystallographic structure showed very little structural modifications (Ulmer et al. 2002). Nonetheless, recent work showed that sidechain dynamics plays a role in the activation process (Huculeci et al. 2016).
As no solution structure by NMR of human wild type Fyn SH3–SH2 is available, we report here on the full backbone and side-chain 1H, 15N and 13C assignment of partially deu- terated 13C, 15N-labeled Fyn SH3–SH2 in its free form using high-resolution NMR techniques. The anticipated structural resolution of the tandem domains by NMR will provide additional information on changes of structure and dynam- ics between domains, hopefully providing an explanation
for the mechanism of information propagation throughout the structure.
Methods and experiments
Protein expression and purificationThe human Fyn SH3–SH2 domain (residues 82–248), SH3 domain (82–147) and SH2 domain (148–248) were sub- cloned into a pet15b (Novagen) vector containing a throm- bin-cleavable N-terminal hexa-His tag by standard cloning methods.
Transformed BL21(DE3)star cells (Invitrogen) were grown at 37 °C in 1 L of minimal medium implemented with 0.75 g 15NH4Cl and 2 g 13C-glucose (Cambridge Isotope Laboratories). The bacteria were induced at a cell density of 0.6 by addition of 0.5 mM IPTG and were then incubated at 22 °C overnight. The cells were pelleted by centrifugation at 7000×g and the pellet kept and stored at − 80 °C for further processing. The expression of the partially deuterated and uniformly 13C/15N-labeled protein was achieved by making the minimal medium 60% in D2O (Cortecnet) complemented with 0.75 g 15NH4Cl and 2 g 13C-glucose.
The pellets were thawn and resuspended in lysis buffer (20 mM Hepes pH 7.6, 100 mM Na2SO4, 20 mM imidazole, 10 mM β-mercaptoethanol (BME), 10% glycerol containing 0.2 mM 4-(2-aminoethyl) benzenesulfonyl fluoride hydrochlo- ride (AEBSF), 5 μg/mL leupeptin and 4 units/mL of DNAse I). The cells were lysed by sonication using a Sonics Vibra- CellTM CV18 model ultrasonic processor (70% amplitude, 3 s pulse on/off for 10 min) and the lysates were centrifuged at 20,000×g for 1 h at room temperature. The supernatant was then loaded into a prepacked HisTrap column (GE Health- care). The resin was washed with 10 column volume of lysis buffer without protease inhibitor and DNAse. The proteins were eluted with 20 mM Hepes pH 7.6, 100 mM Na2SO4, 500 mM imidazole, 10 mM BME and 10% glycerol. The eluted proteins were loaded into a gel filtration Econo-Pac 10DG column (Biorad) equilibrated with 20 mM Hepes buffer pH 7.6, 100 mM Na2SO4, 10 mM BME, 10% glycerol.
The protein were eluted using the same buffer and were con- centrated by using 20 mL spinning Vivaspin 20 filters with a 10 kDa cut-off (Sartorius AG) to a concentration of 10 mg/mL.
The proteins were either snap frozen and stored at − 80 °C or incubated with 1 unit of thrombin (Calbiochem) per mg of protein overnight at room temperature to remove the His-tag.
The cleaved Fyn SH3–SH2 was separated from the tag by gel-filtration using a Superdex75 16/90 column (GE Health- care) in 50 mM sodium phosphate buffer pH 6.5, 100 mM Na2SO4, 2 mM BME. The fractions containing the protein were concentrated using a Vivaspin 20 filter with a 10 kDa
49 50 51 52 53 54 55 56 57 58 59 60 61 62 63 64 65 66 67 68 69 70 71 72 73 74 75 76 77 78 79 80 81 82 83 84 85 86 87 88 89 90 91 92 93 94 95 96 97 98 99 100
101 102
103
104
105 106 107 108 109 110 111 112 113 114 115 116 117 118 119 120 121 122 123 124 125 126 127 128 129 130 131 132 133 134 135 136 137 138 139 140 141 142 143 144 145 146 147 148
UN CORRECTED PR
OOF
cut-off (Sartorius AG). SDS-PAGE was used to determine the purity of the sample.
NMR spectroscopy
The concentration of partially deuterated 15N/13C sample of Fyn SH3–SH2 used for assignment was 0.7 mM in 50 mM sodium phosphate buffer pH 6.5, 100 mM Na2SO4, 2 mM BME, 10% D2O. NMR data were acquired at 25 °C on a Varian Direct-Drive System 600 MHz and an Avance III HD Bruker 700 MHz spectrometers, both equipped with a cryoprobe. Sequential assignments of the protein were car- ried out using 15N-HSQC, 13C-HSQC, HNCO, HNCA, HNCACB, following classical procedures Side-chains assignments were carried out using trosy-HBHANH, trosy- HBHA(CO)NH, HCCH-TOCSY, [1H,15N]-HSQC NOESY and [1H,13C]-HSQC NOESY. Backbone assignments were obtained using 2D 15N-HSQC, 13C-HSQC, 3D 15N and 13C NOESY-HSQC (mixing time: 100 ms) and triple-resonance experiments CBCACONH, HNCACB, HCCH-TOCSY, HBHANH, HBHACONH. 1D 1H-detected 15N-edited relaxa- tion experiments were used to calculate the average 15N T1 and T2 relaxation by fitting the integrated signal in the backbone amide 1H region of the spectrum (10.5–8.5 ppm) as a function of delay time to an exponential decay. 15N T1 and T2 spec- tra were acquired with a recycle delay of 8.0 s. T1 relaxation delays of 100, 200, 300, 400, 600, 800, 1000, 1500, 2000, 3000 and 5000 ms and T2 relaxation delays of 10, 30, 50, 70, 90, 110, 130, 150, 170 ms were used for data collection. At high magnetic field (above 500 MHz), the correlation time of a molecule (τC) can be estimated for a rigid protein with τC > > 0.5 ns as a function of the ratio of the longitudinal (T1) and transverse (T2) 15N relaxation times. By considering J(0) and J(ωN) spectral density terms and neglecting higher fre- quency terms, the correlation time of a molecule can be esti- mated using the following equation:
where νN is the 15N resonance frequency (in Hz) (Kay et al.
1989).
All 3D experiments were acquired using non-uniform sampling. All NMR spectra were processed using NMRPipe (Delaglio et al. 1995) or Bruker’s Topspin 3.2™ and analysed by NMRVIEW and CCPNMR (Johnson and Blevins 1994;
Vranken et al. 2005).
τC≈ 1 4πνN
√ 6T1
T2
−7,
Assignment and data deposition
Analysis of Fyn SH3–SH2 domain 1D 1H-detected
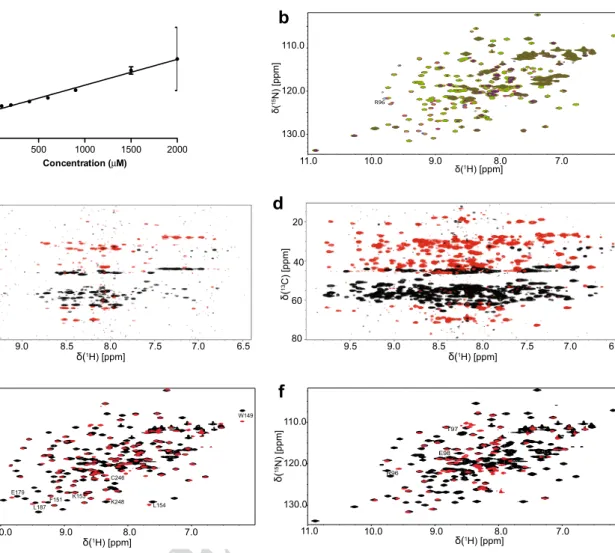
15N-edited relaxation experiments in solution showed a direct relation between the protein correlation time (τC) with its concentration, suggesting that the protein under the conditions of the NMR experiments is a mono- mer–dimer mixture (Fig. 1a) (Rossi et al. 2010). The cor- relation time of a monomeric protein in solution in nano- seconds is approximately 0.6 times its molecular weight in kDa. For Fyn SH3–SH2, τC is estimated to be 11.8 ns. At classical sample concentration for NMR structure deter- mination (> 0.6 mM), the τc for Fyn SH3–SH2 is above 16.5 ns. The quality of HSQC spectra decreases with incremental concentrations (Fig. 1b) and as a consequence, use of uniformly-labeled 15N/13C sample yielded no signal in all 3D experiments (Fig. 1c).
Nietlispach et al. showed that 50–60% random frac- tional deuteration increases the sensitivity of the NMR experiments due to the reduction of R2 of the molecule, allowing structure determination by NMR using 15N and
13C NOESY-HSQC (Nietlispach et al. 1996). Using this methodology on the Fyn SH3–SH2 domain, we observed a significant improvement on the quality of the NMR spectra (Fig. 1d). Using this approach with a 50% deuterated uni- formly-labeled 15N and 13C Fyn SH3–SH2 resulted in 97%
of the backbone and 94% of all 1H side chains assignment.
Due to the random nature of the deuteration processes, the chemical shifts were not corrected for 2H isotopes shifts.
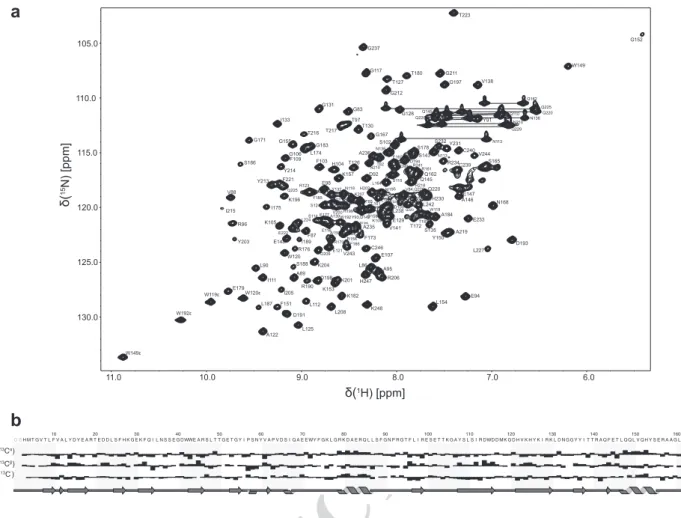
The 15N-HSQC spectrum and assignment are displayed in Fig. 2a. The 1H, 13C and 15N chemical shifts were depos- ited into the BioMagResBank database (http://www.brmb.
wisc.edu/) accession number 27165.
To determine the percentage of monomer/dimer com- plexes, we performed an analysis of 1D 15N T1/T2 at 50–2000 μM concentrations (Fig. 1a). The estimated KD was calculated at 500 and 600 mM, suggesting that more than 60% of Fyn SH2–SH3 exists as a dimer at 0.7 mM. For maintenance of dominant monomeric FYN—
SH3–SH2 in solution, lower concentrations (0.1–0.2 mM) are necessary; however, such experimental prerequisites hinder spectral assignment and structure determination due to lack of signal.
Increasing sample concentrations above 1 mM also resulted in loss of NMR signal (broadened peaks; Fig. 1b).
Dimer formation favoured by higher sample concentra- tions exhibited as broadened peaks with the exception of one peak (R96), which slightly shifted without creating ambiguity for its assignment. Analysis of this chemical shift perturbation enabled KD determination in the range of 500–700 mM. Thus a concentration of 0.7 mM was subsequently selected for all the experiments in this study.
149 150
151
152 153 154 155 156 157 158 159 160 161 162 163 164 165 166 167 168 169 170 171 172 173 174 175 176 177 178 179 180 181 182 183
184 185 186 187 188 189 190
191
192 193 194 195 196 197 198 199 200 201 202 203 204 205 206 207 208 209 210 211 212 213 214 215 216 217 218 219 220 221 222 223 224 225 226 227 228 229 230 231 232 233 234 235 236 237 238 239 240 241
UN CORRECTED PR
OOF
The chemical shift index (CSI) function and DANGLE (Cheung et al. 2010) modules in CCPNMR were used to predict the secondary structure of Fyn SH3–SH2 from backbone chemical shifts (Fig. 2b). The predicted second- ary structure is an arrangement of 6 β-strands for the SH3 domain and 5 β-strands and 2 α-helices for SH2 domain, with a short α-helix in the linker between the two domains.
These data further corroborate previous reports on the structure of SH2 and SH3, as a β-sandwich consisting of six strands flanked by 2 α-helices and connected by three loops and a β-sandwich consisting of five strands flanked by three loops and a short 310 helix, respectively (Xu et al. 1999).
The structure of Fyn SH2 free in solution and in com- plex with the phosphorylated tail of the protein has been solved recently (Huculeci et al. 2016). We compared the
15N HSQC spectrum of the SH3–SH2 domain with the single SH2 domain under identical conditions to investi- gate if there is an effect of the SH3 domain on the struc- ture of SH2 domain. We observed the expected changes in the N-terminal region, but also throughout the sequence (Fig. 1e) suggesting a change in the structure of the SH2 domain when linked to the SH3 domain. A similar experiment using the free SH3 domain resulted in similar changes in the SH2 domain, with some still present, espe- cially in the loop area between b1 et b2 (Fig. 1f). These data underline the importance of studying these domains within the context of the tandem SH2–SH3 domain or even the full-length protein, as these differences may have an impact on the potential sidechain-induced communication between different parts of a protein.
a b
e f
9.5 9.0 8.5 8.0 7.5 7.0 6.5
δ(1H) [ppm]
20 40 60 80 δ(13C) [ppm]
20 40 60
80 9.5 9.0 8.5 8.0 7.5 7.0 6.5
δ(13C) [ppm]
δ(1H) [ppm]
11.0 10.0 9.0 8.0 7.0
δ(1H) [ppm]
130.0 120.0 110.0
δ(15N) [ppm]
K248 C246
L187 L154
F151 K153 E179
W149ε
W149
R96
T97 E98
11.0 10.0 9.0 8.0 7.0
δ(1H) [ppm]
130.0 120.0 110.0
δ(15N) [ppm]
c d
0 500 1000 1500 2000
0 10 20 30 40 50
Concentration (µM) CorrelationTimec(ns)
11.0 10.0 9.0 7.0
δ(1H) [ppm]
130.0 120.0 110.0
δ(15N) [ppm]
8.0
R96
Fig. 1 Effect of protein concentration and deuteration on the NMR experiment and structural differences between Fyn SH3–SH2 and Fyn single domains SH2 and SH3. Plot of Fyn SH2–SH3 correla- tion time (τC) in function of protein concentration (a). Overlay of
15N-HSQCs of the Fyn SH3–SH2 domain collected at different pro- tein concentrations (b) (black: 50 μM; gray: 100 μM; light blue:
200 μM; dark blue: 400 μM; red: 600 μM; green: 900 μ; purple:
1.5 mM and dark green: 2 mM). 2D 1H/13C projection of the 3D HNCACB for a deuteration level of 0% (c) and 50% (d). 15N-HSQC overlay spectra of Fyn SH3–SH2 domain (black) in the presence of the His tagged Fyn SH2 (e) and SH3 (f) domains (red). Residues affected by the presence of the tandem domains have been labeled
242 243 244 245 246 247 248 249 250 251 252 253 254 255 256
257 258 259 260 261 262 263 264 265 266 267 268 269 270 271
UN CORRECTED PR
OOF
Acknowledgements This research is funded by the Flemish Scientific Fund (F.W.O.) via the grant G025915N. The VIB and the Jean Jeener NMR Center provided further support for our work.
References
Boggon TJ, Eck MJ (2004) Structure and regulation of Src family kinases. Oncogene 23:7918–7927
Cheung MS, Maguire ML, Stevens TJ, Broadhurst RW (2010) DAN- GLE: A Bayesian inferential method for predicting protein back- bone dihedral angles and secondary structure. J Magn Reson 202:223
Delaglio F, Grzesiek S, Vuister GW, Zhu G, Pfeifer J, Bax A (1995) NMRPipe: a multidimensional spectral processing system based on UNIX pipes. J Biomol NMR 6:277–293
Elias D, Ditzel HJ (2015) Fyn is an important molecule in cancer pathogenesis and drug resistance. Pharmacol Res 100:250–254 Elias D, Vever H, Laenkholm AV, Gjerstorff MF, Yde CW, Lykkesfeldt
AE, Ditzel HJ (2015) Gene expression profiling identifies FYN as an important molecule in tamoxifen resistance and a predictor
of early recurrence in patients treated with endocrine therapy.
Oncogene 34:1919–1927
Grant SK (2009) Therapeutic protein kinase inhibitors. Cell Mol Life Sci 66:1163–1177
Grant SG, O’Dell TJ, Karl KA, Stein PL, Soriano P, Kandel ER (1992) Impaired long-term potentiation, spatial learning, and hippocam- pal development in fyn mutant mice. Science 258:1903–1910 Huculeci R et al (2016) Dynamically coupled residues within the
SH2 domain of Fyn are key to unlocking its activity. Structure 24:1947–1959
Johnson BA, Blevins RA (1994) NMR view: a computer program for the visualization and analysis of NMR data. J Biomol NMR 4:603–614
Kay LE, Torchia DA, Bax A (1989) Backbone dynamics of proteins as studied by 15N inverse detected heteronuclear NMR spec- troscopy: application to staphylococcal nuclease. Biochemistry 28:8972–8979
Kojima N, Ishibashi H, Obata K, Kandel ER (1998) Higher seizure sus- ceptibility and enhanced tyrosine phosphorylation of N-methyl- D-aspartate receptor subunit 2B in fyn transgenic mice. Learn Mem 5:429–445
Li X et al (2003) Alphavbeta6-Fyn signaling promotes oral cancer progression. J Biol Chem 278:41646–41653
a
K248 H247
C246
V244
V243
L242 R241
C240 C239
L238 G237
A236
A235
R234
E233 T223
L224 F221
E148
Q220
A219 R218 T216 T217
I215
Y214 Y213
G212
G211
N210
D209
L208 K207
R206 I205
K204 Y203
K201 H202
V200 H199
D198
G197
K196
M195 D194
D193 W192
D191 R190 I189 S188
L187 S186
Y185
A184 G183
K182
T172T181 G171
F173 L174
I175
R176 E177
S178
R170
N168 G167
L164
A159 D158
R161
S165
F166
W149
E222
A146E147 Q145
I144, R156
S143
Y93,D142 V141 A139
V138
Y137 N136
S135 I133
Y132 G131
T130
E129 G128 T127
T126
L125 S124 R123
A122
E121 W120
W119 N118
G117
E116
S115
S114
N113
L112 I111
Q110 F109
K108
E107 6
0 1 G
10 K 5
4 0 1 3H 0 1 F
2 0 1 S
1 0 1 L D100
9 9 D 8
9 E
7 9 T
6 9 R
5 9 A
4 9 E 8
8 V
9 8 A 0 9 L
Y91
2 9 D
F 78
8 L 6 5 8 T
6 2 2 Q , 4 8 V 3 8 G
2 8 T
k n il M 5
5 1 G
L154 5
1 K 3
2 5 1 G
1 5 1 F
5 1 Y 0 7
5 1 K
L227 V228
9 2 2 Q
H230 S232Y231
Q225
E179
T180
3 6 1 L
Q162 E160
W149ε W192ε
W119ε W120ε
0 . 8 0
. 9 0
. 0 1 0
. 1
1 7.0 6.0
δ(1H) [ppm]
130.0 125.0 120.0 115.0 110.0 105.0
δ(15N) [ppm]
N210 N113
Q110 N136 Q162
Q220 Q229 Q226
Q145 Q225
SH M T G V T L 10 F V A L Y D Y E A R
20 T E D D L S F H K G
30 E K F Q I L N S S E
40 G DWWE A R S L T
50 T G E T G Y I P S N
60 Y V A P V D S I Q A
70 E E WY F G K L G R
80 K D A E R Q L L S F
90 G N P R G T F L I R
100 E S E T T K G A Y S
110 L S I R DWD D M K
120 G D H V K H Y K I R
130 K L D N G G Y Y I T
140 T R A Q F E T L QQ
150 L V Q H Y S E R A A
160 G L C C R L V V P C
170 H K
δ(13Cα) δ(13Cβ) δ(13C’)
G
b
Fig. 2 Assigned 15N-HSQC spectrum and secondary structure pre- diction of the Fyn SH3–SH2 domain. a 15N-HSQC spectrum of Fyn SH3–SH2 domain in 50 mM sodium phosphate buffer pH 6.5, 100 mM Na2SO4, 2 mM BME, 10% D2O. The assignments of back- bone side chain amides and tryptophan indole groups are labeled.
b Threshold deviation from random coil 13CO, 13Cα and 13Cβ were plotted as a function of residue number using the chemical shift index (CSI) module in CCPNMR. The cartoon represents the secondary structure of Fyn SH3–SH2 predicted by the CSI and DANGLE mod- ules in CCPNMR
272 273 274
275
276 277 278 279 280 281 282 283 284 285 286 287 288
290 291 292 293 294 295 296 297 298 299 300 301 302 303 304 305 306 307 308 309 310 311 312
UN CORRECTED PR
OOF
Manning G, Whyte DB, Martinez R, Hunter T, Sudarsanam S (2002) The protein kinase complement of the human genome. Science 298:1912–1934
Nakazawa T et al (2001) Characterization of Fyn-mediated tyrosine phosphorylation sites on GluR epsilon 2 (NR2B) subunit of the N-methyl-D-aspartate receptor. J Biol Chem 276:693–699 Nietlispach D et al (1996) An approach to the structure determina-
tion of larger proteins using triple resonance nmr experiments in conjunction with random fractional deuteration. J Am Chem Soc 118:407–415
Nygaard HB, van Dyck CH, Strittmatter SM (2014) Fyn kinase inhibi- tion as a novel therapy for Alzheimer’s disease. Alzheimers Res Ther 6:8
Ohnuma T, Kato H, Arai H, McKenna PJ, Emson PC (2003) Expres- sion of Fyn, a non-receptor tyrosine kinase in prefrontal cortex from patients with schizophrenia and its correlation with clinical onset. Brain Res Mol Brain Res 112:90–94
Panchamoorthy G et al (1994) Physical and functional interactions between SH2 and SH3 domains of the Src family protein tyrosine kinase p59fyn. Mol Cell Biol 14:6372–6385
Panicker N et al (2015) Fyn kinase regulates microglial neuroinflam- matory responses in cell culture and animal models of parkinson’s disease. J Neurosci 35:10058–10077
Pawson T (1995) Protein modules and signalling networks. Nature 373:573–580
Prybylowski K, Chang K, Sans N, Kan L, Vicini S, Wenthold RJ (2005) The synaptic localization of NR2B-containing NMDA receptors is controlled by interactions with PDZ proteins and AP-2. Neuron 47:845–857
Roskoski R Jr (2015) Src protein-tyrosine kinase structure, mechanism, and small molecule inhibitors. Pharmacol Res 94:9–25
Rossi P et al (2010) A microscale protein NMR sample screening pipe- line. J Biomol NMR 46:11–22
Saito YD, Jensen AR, Salgia R, Posadas EM (2010) Fyn: a novel molecular target in cancer. Cancer 116:1629–1637
Saksela K, Permi P (2012) SH3 domain ligand binding: What’s the consensus and where’s the specificity? FEBS Lett 586:2609–2614 Sato I et al (2009) Differential trafficking of Src, Lyn, Yes and Fyn is specified by the state of palmitoylation in the SH4 domain. J Cell Sci 122:965–975
Sicheri F, Kuriyan J (1997) Structures of Src-family tyrosine kinases.
Curr Opin Struct Biol 7:777–785
Suzuki T, Okumura-Noji K (1995) NMDA receptor subunits epsilon 1 (NR2A) and epsilon 2 (NR2B) are substrates for Fyn in the postsynaptic density fraction isolated from the rat brain. Biochem Biophys Res Commun 216:582–588
Ulmer TS, Werner JM, Campbell ID (2002) SH3-SH2 domain orienta- tion in Src kinases: NMR studies of Fyn. Structure 10:901–911 Vranken WF et al (2005) The CCPN data model for NMR spectros-
copy: development of a software pipeline. Proteins 59:687–696 Xu W, Doshi A, Lei M, Eck MJ, Harrison SC (1999) Crystal structures
of c-Src reveal features of its autoinhibitory mechanism. Mol Cell 3:629–638
Young MA, Gonfloni S, Superti-Furga G, Roux B, Kuriyan J (2001) Dynamic coupling between the SH2 and SH3 domains of c-Src and Hck underlies their inactivation by C-terminal tyrosine phos- phorylation. Cell 105:115–126
313 314 315 316 317 318 319 320 321 322 323 324 325 326 327 328 329 330 331 332 333 334 335 336 337 338 339 340 341
342 343 344 345 346 347 348 349 350 351 352 353 354 355 356 357 358 359 360 361 362 363 364 365 366 367 368 369