András Giday – Szilvia Szegő
Towards the “Child-to-Parent”
Based Pension Allowance (“C2P”)
Proposal for the Reduction of the Population and the Finance Twin-Deficit
1Summary
Our basic assumption is that the pension reform, paid employment and child rearing (including housework) are inextricably interlinked and a policy for one “life stage”
cannot be reformed without consideration to the entire family life. The proposed child-to-parent based pension allowance (“C2P”) aims at remedying the worsening interconnectedness of two different deficit types: population and financial deficit in the pension regime. The demographic basis of a sustainable population and pension scheme necessarily includes children. We discuss a model which can improve interac- tion between child-rearing and the pension scheme. The current pension schemes typically allocate only a minimal allowance (about 2-3 per cent of the total pension budget) to those who raise children. We propose that the “regular” pension should be supplemented with a child-to-parent based (“C2P”) element. This would be a fixed amount of about HUF 20,000 per month per child raised by the parents. This ex- tra allowance would be financed from contributions paid by working children to the central budget. Parents would be entitled to this pension element if their child has worked a sufficient number of years and has paid contributions.
Dr András Giday CSc, Editor, Pénzügyi Szemle (andras.giday@gmail.com); Dr Sz il- via Szegő, CSc, Doc toral School, Uni versity of Szeged (szeszego@gmail.com).
Pre-hypotheses of the analyses2
Approximately two-thirds of state expenditure are spent on a special type of financing for a human lifespan as a redistribution of a part of the income produced during the productive lifespan in favour of the non-productive lifespan.
According to the definition articulated by Mária Augusztinovics, the four phases of human lifespan are: childhood, the so-called gestation period, the productive period and old age (Augusztinovics, 1996).
– The central budget can be viewed as the nationalisation of certain parts of these redistribution processes: family allowances, education, the pension scheme, and in some respects, the healthcare system, too.
– The investigation presented in this study does not rely on an abstract concept of a human being, as do the investigations of Augusztinovics, but on the specific social reality:3 the family and the economy of the family.4
– This study relies on a life stage investigation of family economies.
– Life stages in family economies have been determined on the basis of the inves- tigation of elementary data of Hungarian households (HSO statistics, 2000). As this year’s data was also available for us, the processes we have observed in a very sophisti- cated database have current relevance.
Interaction between the two kinds of deficit (population and financial)
For the purposes of this study,5 population deficit is a substantial and deepening gap in generational reproduction. Population deficit is characterised by the following:
1) A significantly curtailed childbirth period: it begins late and ends soon.
2) A significantly curtailed employment period. The negative effects of the con- flicting timing of the reproduction and employment periods are aggravated by a con- siderably difficult employment period. This means that while families with small chil- dren are often overburdened by employment, mature families (families with teenage children) are more likely to be underemployed, although they are less constrained by family duties.
3) As a consequence, there are sharp conflicts between the demographic and em- ployment life stages of families. The number of employed parents is the highest in the stage when families have small children, and thus in this stage parents are typically overloaded: reproduction, childcare duties and intensive career duties all take place at the same time, in the same period.
4) Increasingly extended child-rearing and training period, which conversely, de- creases the working stage. Young adults do not begin work before 20 to 30 years of age, in the life stage when we would traditionally expect young adults to start reproducing.
So any “year gained for productive work” as a result of curtailing the child-bearing period is offset by the delay in entering work. At the same time, the pressure to have a sustainable job is increasing, as the new parents are expected to provide for their
children for up to thirty years. In fact, what we see in many cases is that because of this conflict, parents are made redundant shortly after they give birth to their last child.
5) A sharp decrease in successive generations, compared to sustainable generation- al reproduction (shown later in our narrowing population pyramid in Figures 3 and 4).
6) An increasing dependency at both ends of the life stage, with “child” depend- ents up to 30, and “pensioner” dependents between 60 and 90. If this coincides with low, insecure, and low-paid employment in the working population segment in be- tween, the situation is doubly unsustainable.
Characteristics of the curtailed childbirth period of families in Hungary
The end of the childbirth period is to a major extent determined by parents’ increas- ingly shorter period spent in work. The childbirth period depends to a large extent on the period of work. (In our investigation we follow the lifespan of the parents together, Figure 1: Correlation between the duration and timing of childbirth and child-rearing periods
and the termination of the working period
0 5 10 15 20 25 30 35 40 45
15–19 20–24 25–29 30–34 35–39 40–44 45–49 50–54 55–59 60–65
% and normalised number of employed parents
Distribution of parents according to their average age at first childbirth Distribution of parents according to their average age at last childbirth Normalised number of average working parents in the family
Distribution of parents according to the average age at the conclusion of the child-rearing period
Note: The figure is devised from the elementary database of the Central Statistical Office of Hungary’s sur- vey of households made in 2000. A basic (elementary) household database was needed to monitor family life stages, and the 2000 household survey was found suitable. The trends showed in the figures are long-term.
Source: HCSO Household Survey 2000, elementary database own calculations
as the family lifespan is more connected to interdependent family functions than to individual functions.) The Figure 1 shows this strong correlation.6
The first two lines in the figure show the spiked distribution of parents at the age of having the first and last child. The average distance between the two lines is very small, indicating a significantly curtailed childbirth period, not caused by biological or health constraints. The third line is the job line, slightly more arched and slightly less spiked than the lines denoting the childbirth period, but the shape broadly echoes the other two, with a similarly significant peak. The peak on the job line is very short.
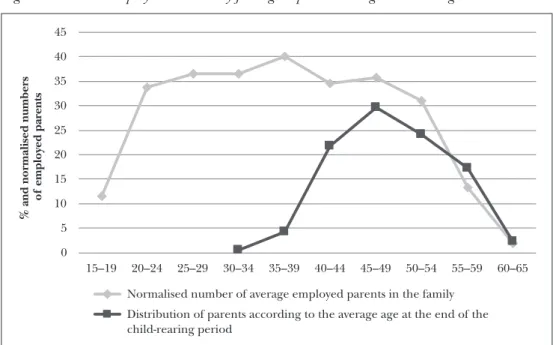
The Figure 2 shows that the fall of the work distribution line along the age of the parents is also very similar to the fall in the reproduction lines. This means that the last child, the youngest one in the family, is typically dependent when the parents are often made redundant from the workplace in a very sudden way. (Recently, the conflict between demography and work has become considerably milder than it was in the beginning of the 2000’s, but there are signs of a new conflict evolving between a more intensive female career life stage and childbirth timing.) Figure 2 shows the distribution of parents according to child-rearing age.7 This is the age at which the youngest child reaches 20. The line shows that the number of parents in child-rearing age is still growing when they are made redundant from the workplace.
Figure 2: Parents’ employment intensity falling despite declining child-rearing burdens
0 5 10 15 20 25 30 35 40 45
15–19 20–24 25–29 30–34 35–39 40–44 45–49 50–54 55–59 60–65
% and normalised numbers of employed parents
Normalised number of average employed parents in the family Distribution of parents according to the average age at the end of the child-rearing period
Source: HCSO Household Survey 2000, elementary database own calculations
Thus, the period of childbirth, although very short, is still “too long” in terms of workplace demand. Paradoxically the child-rearing period would need to be cut even further in order to align with the line of the working period.
This shows that reduction in the childbirth period is highly determined by the decreasing period spent in work by parents. The length of the childbirth period depends greatly on the length of the period spent in work and with a career. The birth of the first child is delayed, on the one hand, by work-related needs, and the childbirth age is pushed towards younger ages by the fact that earning ends sooner. Families undertake the last child even earlier so as they can expect a solid earning status until their child is dependent on them.
Effects on the pension scheme
The shorter childbirth and working period have the following consequences on the pension scheme:
1) An unbalanced population structure and consequent disintegration of inter- generational social cohesion, due to successive generational population decrease.8 The situation is deteriorating so badly that no reform performed in the state re- distribution systems are able to remedy the resultant structural deficits. As a con- sequence, the reduced productive period cannot finance the gestation and elderly periods in life.
2) The devaluation of housework compared to paid work has many side effects. Re- ductions in family time require the outsourcing of necessary family functions: unpaid housework is replaced by paid work. Consequently, families must earn even more to pay the costs of outsourced housework. Thus the encroachment of “paid” employ- ment on family life has paradoxical effects: increase in the intensity of the active phase in the productive period at the expense of housework might lead to growing financ- ing burdens of families. On the other hand, this concentration overvalues paid work and undervalues housework, i.e. self-directed activity, over the whole life stage.
As a consequence, the whole life stage becomes ever more dependent on paid work and the income earned from it. In other words, even though employment is growing, the demand (and cost) for outsourced services of caring and rearing the family is growing simultaneously. Thus the deficit would be reproduced even under the mask of higher employment rates. (Note the trade-off between housework and job. In general, paid work replaces self-directed structures, and the nursing of chil- dren and care for the elderly are increasingly less performed within the family).
Consequently, despite higher employment rates, the dependency of the family life stage on paid services increases, and moreover, it increases more intensively than work:
dependency on services (in this respect it is indifferent whether public or private) is growing faster than income in many cases. As a consequence, paid work presses out housework, including child-rearing.
3) Deterioration in the balance between paid work and housework in the low- income strata. The heavy focus on paid work and career causes another distortion in lifestyles: paid work reduces the status of non-paid work, not only in families with good jobs but also, and paradoxically, often more so, in underemployed and low-income families.
In the low-income strata, it is observed that less money/employment does not trans- late into a higher status for, or more time dedicated to, housework. Rather, members of these strata lose their motivation to work and become ever more dependent on the redistribution (Wallace, 2002).
The impacts of unsustainable population growth on financing old age population needs In a modelled population pattern of four generations living together, a mother born in 1919 is considered as the “null” generation, giving birth to her first child in 1934.
From that year we calculated the normalised population headcount, in other words, the age-specific birth and the mortality rates of male and female members of the newly born generation. Thus the normalised numbers of the first generation is ob- tained, and is presumed to give birth to children at the age of 15. The actual size of the population decreases according to the mortality rate. The Figure 3 shows that the emerging population achieves balance by the second and third generations. So the size of the co-existing generations remained the same, although the living population experienced birth and death events every year (calculated by the specific statistical birth and mortality ratios for the year 1934). The population pattern is thus depicted as it would be today if the birth and mortality rates have remained at the 1934 levels.
In a sustainable population the outflow and inflow processes of the successive genera- tions are in equilibrium, as if the population were a river.
The figure shows a sustainable population structure (with the population movement characteristics from the year of 1934). The model shows the four generations marked as f1, f2, f3 and f4.
This pyramid (Figure 3) shows a sustainable population: the size of co-existing generations becomes and remains nearly identical. The first generation is seen at the top of the pyramid: the children of the first mother. In the middle of the pyramid four co-existing generations are seen. In this case the four-generation population shows a strong sustainability in time: the size of the population remains roughly the same in the successive generations. This means that decrease in the size of one generation is offset by increase in the size of the successive generations.
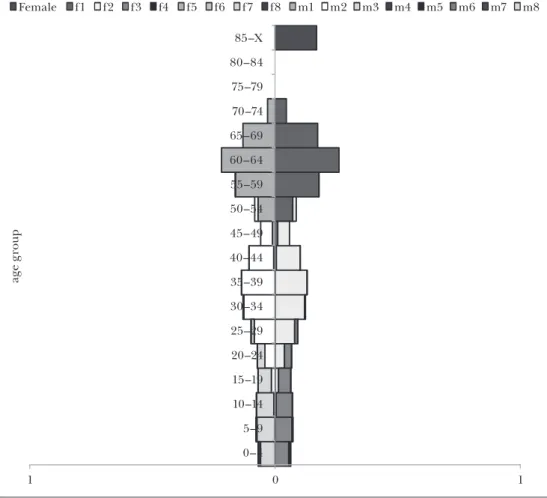
The 1970s and 1980s show a rather different picture in Hungary. The Figure 4 shows an unsustainable population structure. The population pyramid shows the change in the structure and an even greater change in the size of the population. (To some extent the structure of the population hides the full significance of the change because the elderly generations with their more extended numbers have a greater weight in the size of the population.)
This pyramid (Figure 4) shows a very unsustainable population. The size of the co-existing four generations decreases sharply. The successor generation can no longer offset decrease in the size of the older generations, and the life expectancy at birth does not increase at a pace comparable to the population modelled in the previous figure. The uninterrupted decrease in the size of the successive gen- erations cannot then be offset by an increasing size in the older generations, so
the population begins to decrease and this process accelerates. Faster population decrease is not the only negative effect in this process, as there is a general popula- tion ageing. This structural change is not merely a transition from one stage to the next, but actually a population decline with a growing deficit in terms of care for the elderly.
Figure 3: Population pyramid according to the birth and mortality rates of the year 1934.
(Sustainable population model: Population pyramid of 4 successive co-existing generations, counted according to the age-specific birth and mortality rates of the male and female members of the 4 generations. Mother born in 1919, beginning to give birth to children in 1934.)9
1 0
1
age group
Female f1 f2 f3 f4 f5 f6 f7 f8 m1 m2 m3 m4 m5 m6 m7 m8
0–4 5–9 10–14 15–19 20–24 25–29 30–34 35–39 40–44 45–49 50–54 55–59 60–64 65–69 70–74 75–79 80–84 85–X
Note: The left side of the pyramid shows the relative extent of female population in 5-year periods born to the ancestor (who began to give birth to children at the age of 15 and ended fertility at the age of 50). Three gene- rations born to the children of the “first mother” follow. The relative number of the population depicted in the figure were counted by the age-specific birth and death probabilities. The right side shows the male population.
Source: HCSO Demographic Yearbooks own calculations
Figure 4: Population pyramid according to the birth and mortality rates of the year 1987 (Unsustainable population model: Population pyramid of 4 successive co-existing generations, counted according to the age-specific birth and mortality rates of the male and female members. Mother born in 1972, beginning to give birth to children in 1987.)10
age group
Female f1 f2 f3 f4 f5 f6 f7 f8 m1 m2 m3 m4 m5 m6 m7 m8
0–4 5–9 10–14 15–19 20–24 25–29 30–34 35–39 40–44 45–49 50–54 55–59 60–64 65–69 70–74 75–79 80–84 85–X
1 0
1
Source: HCSO Demographic Yearbooks own calculations
The impacts of the unsustainable population growth on financing the old-age population needs to be analysed
The population change in the late 1980s was characterised in Hungary by a sharp decrease with a deteriorating structure. The labelling of this process as “an ageing population” is misleading. First of all, population ageing is less a result of growing life expectancy and far more a consequence of the rapidly decreasing number of births.
Secondly, long-term population sustainability depends far more on birth rates than on the life expectancy of the elderly. The effective “relay race” of the successive gen-
erations depends absolutely on the inflow of births. The correlation between living longer and having children can be described by a surprising formula: senior generations do not live long enough to compensate for decrease in the number of new births. Consequently, relationships are distorted, which in turn results in further distortion in the complex reproduction process.
Thus deficit in financing is reproduced (no matter how well the pension schemes are reformed) as long as the population structure remains deteriorating: when an in- creasingly deteriorating population structure is reproduced. In other words, pension reforms, paid employment and child-rearing (and housework) are inextricably linked and the policy of reforming one “life stage” can not be efficient without consideration of the entire life course.
Remedies of the population deficit and the resultant unsustainable pension scheme Remedies can only be effective if they serve the followings:
1) Improvement in the entire working life stage of families (in addition to the number of employed also the harmonised timing of work).
2) Improvement in the trade-off between paid and unpaid work, to ensure con- siderably higher prestige and compensation for unpaid work (for example in family economics and in the national performance (in GDP) (see Jager et al., 2003).
3) Improvement in the harmonisation of work to better fit the population and the working life stage and with it the reproduction of the population.
4) Decrease in the high dependency of overloaded families on “imported” services and their high expenditures caused by the sharply decreasing housework and home- time.
5) Improvement of work done by families without undervaluing housework, in other words, preventing paid work from displacing housework.
Summary
1) The characteristic features of population deficit and the correlation between the population and the structural deficit in financing the pension scheme result in con- flicts regarding the working stage and in a deterioration in the population structure.
2) Deterioration in the population structure is the core cause of underfinancing the reproductive life stages and the resulting deficit in the central budget, while the state remains an important actor in financing the human life course.
3) Due to the sharp conflicts between work and the reproductive life stages, im- provement in the conditions of work for the active age population can cut both ways.
The underemployment of mature and low-income families is accompanied by over- work done by working young families.
4) The population structure and the central budget deficit cannot be improved by increasing families’ workload if it goes hand-in-hand with a growing dependency on family economies in terms of monetary expenditures and monetary inflows.
5) If paid work displaces housework, the deficit in the financing of the life stage will be reproduced and so the deficit of the central budget as well.
6) Harmonised life stage financing represents a better combination of paid and housework. A solution must be found for changing the costly way of life for both fami- lies who work too much and those who do not have sufficient work. How to change the way of life to better balance paid and unpaid work in family life?
Towards the child-to-parent based pension allowance (“C2P”)
The demographic basis of a sustainable population and pension scheme necessarily includes the child. Below, we propose a model which can improve the connection be- tween child-rearing and the pension system. The currently applied pension schemes typically allocate only a minimal allowance (about 2-3 per cent of the total pension budget) to those who raise children. This rests on the following two false assumptions:
1) The pension scheme can function independently of child-rearing.
2) A balanced and static generation structure exists across the total population.
The incorrectness of these assumptions is easily evidenced by the aging popula- tions seen across the developed world and the growing deficits in pension schemes that have resulted.
Remembering that a cure lies in the nature of an illness, we suggest a pension scheme based on the expenses of child-rearing families. The proposed child-based allowance amounts to 12-13 per cent of the total amount of pensions (about 17 per cent of a par- ent’s pension). The financial resource for this scheme can be an earmarked and clearly defined by the ratio of children’s contributions to their parents’ pensions, paid for 4 (5) years, until the child reaches 25 or 29 years of age, according to the time when the child completes education. Parents reaching the retirement age can obtain the recommended amount of pension supplement (approximately HUF 240 thousand per year per child).
As the pension allowance paid in this system would be obtainable only after dec- ades, we also propose a temporary child-based pension element to be introduced from 2019. In the financial balance of our scheme, the net effect on the public pension budget would amount to a net deficit of HUF 145 billion in 2018, increased to HUF 220 billion by 2026. The total net amount of the pension fund, including the changes concerning parents, would amount to about 12 percent of the total pension budget (according to our forecasts). Such a structure clearly favours families raising children and could have a highly positive impact on the social preferences of the population.
Modern pension schemes reward child-rearing by no more than 2-3 per cent of the pensions. This lack of incentive arguably contributes to a low or negative fertility rate and thus to the aging (and even decline) of the population. In the above-described model, this situation would be corrected by the contributions paid by children to their parents’ pensions as presented below. In our proposal, the main difference is that we require adult, working children to contribute to the provisions of their parents’
pensions. The economic performance of contributors, importantly, should cover the
preceding generation’s needs. We have developed a model adjusted to the Hungarian demographic and public finance conditions, with approximately one eighth of the pen- sion expenditures spent on parents financed by their employed children.
Contribution to parents’ pension by working children
The total cost of raising a child in Hungary is approximately HUF 60 million. The family directly contributes HUF 36 million and the government contributes HUF 4 million indirectly, in the form of tax credits. HUF 20 million is financed directly from public funds, of which HUF 2.7 million is the family allowance and HUF 16 million is the cost of education.11
The above-specified family contribution was calculated using the data of the Time Use Survey (HCSO) for parents with 2 children. The hours spent by earning activities was multiplied by HUF 1350, and work done at home by HUF 1200. (The first is the average hourly net wage of the employees; the second is the net wage paid to women per hour in 2018).12
Accordingly, two parents with two children facilitate future production and make an additional investment (“added” to their accumulated pension claims) of HUF 72 million to the Hungarian “pension economy” of the future.
In our opinion the pension scheme should reward child raising and the help pro- vided to children to ensure they are healthy and trained for the labour market as a form of value creation and pension investment. The modern two-generation family model evolved via family strategies that adjusted first to industrial structures and later to the rise of the global economy. Thus there is a great need to reconfirm intergenera- tional family ties, in a way that is relevant to the current needs, with a pension scheme facilitating old-age provision.
Traditional pension schemes focus on the individual (without family reproduction) and on financing from contributions in proportion to earnings, with limited redistri- bution on the basis of social standing. The challenges posed by the rapidly aging popu- lations and the related deficit in budgeting pensions, and reduction in the value of subsequent pensions press for responses and only allow limited modifications (higher retirement age, changed systems in establishing the value of the pension, etc.).
Currently, the majority of European countries are making efforts at rewarding child raising and the value it adds to pension schemes. However, the scale and effect of these efforts is very modest: a 2-3 per cent adjustment of pensions towards families raising children undervalues much of the performance of these initiatives.13 We think that a pension scheme which places a considerably higher emphasis on family reproduction (via taxpaying children) can reduce the financial deficit as well as the population deficit.
C2P, the child-to-parent based pension allowance
We propose a system partly supported by working children who contribute to the pension allowances of their parents. The main point of the proposal drawn up in this
article is that, for each child raised, a child-to-parent based element should be added to a person’s regular pension. This means that a specified amount of the parents’ pen- sion would be covered directly by their working children, as part of the children’s pub- lic budget contributions. In other words, parents who have raised taxpaying citizens would receive provisions from their children’s accounts. The child-to-parent based pension element would reward child-raising with a monthly fixed amount in the par- ents’ pension (after their child has worked for a specified number of years). The allowance would be adjusted to the number of children and to their working years.
Parents would be entitled to the pension element if their child has worked a sufficient number of years and has paid contributions.
The characteristics of the child-based pension element are as follows:
1) It would be a pay-as-you-go type element.
2) The claims in the child-based system should be separated.
3) The resource would be the earmarked contribution paid after the working children to the state budget. The total sum should amount to about HUF 4 million, enough to finance the parents’ child-to-parent based allowance for about 18 years (which corresponds to their life expectancy at the age 65).
4) These contributions should be paid to a special “parental pension fund” ac- count in the central budget.
5) Children must have spent 4 (or 5) years at work, following the completion of secondary education until their 25th year or following higher education until their 29th year of age.
6) This pension element should be a fixed amount (the recommended amount is about HUF 20 thousand per child, per month).
7) The monthly sum would be divided between the parents (HUF 12 thousand to the mother, HUF 8 thousand to the father). This distribution corresponds to their burdens with the child-rearing.
8) The paid-up amount should be guaranteed by the state to ensure credibility and security.
9) The amount should be adjusted for inflation.
10) There is a need to make special rules for people in special life situations, those unable to have or raise children, or those whose children are ill and unable to work.
In the current critical demographic situation (frequently referred to as the “demo- graphic time bomb”), there is no time to waste. We suggest launching the system in 2020. As we know, a pension scheme can only start functioning about 10-20 years after the first deposits. Inflows would begin in 2020, pension payments begin in 2030. For this reason we suggest the provision of a temporary, transitional child-to-parent based system along the same logic but with an interim inflow and outflow.
Contributions to the proposed child-to-parent based system
In the first year of the child-based pension scheme, the accumulation to the children- to-parent based pension fund would start. All the taxes and social contributions for
the first part of the monthly earning (until HUF 220,000) of young adults would be allocated to the parents’ pension fund called “C2P”. The taxes and social contribu- tions after the second part of earnings (above HUF 220,000) would be allocated to the central and social security funds as usual.
Details of the scheme
Working-age children are expected to work for minimum 4 (or 5) years to authorise their parents to access the pension element. Allocation to the fund would begin after leaving education, immediately when children are first employed.
Table 1: Period of contribution to the C2P Fund Without voca-
tional school Having completed
vocational school Tertiary education Required minimum time spent
in work 5 years 4 years 4 years
Time spent in work and required
for access to the fund 25 years 25 years 29 years
Source: Edited by the authors
The allocation period and the taxes allocated to the fund are crucial elements of the system. Within 4 or 5 years the child would contribute HUF 4 million in the “C2P”
Fund after each child. This will enable later a pension outlay of 20,000 HUF/month/
child during an 18 years pension period for the parents. Parents would be eligible for the parental pension only if their child fulfils the 5 (4) years employment prescribed.
For those with tertiary education, 29 years age would be the limit, until which time they have to amass 4 years employment. For the others, the age of 25 years would be the limit.
For about 10 years, the funds would function only with accumulating more and more contributions. The first pension expenditures would be due from 2030, when the first entitled parents would reach the 65 years age.
With the above periods, youngsters would be urged to find employment after leav- ing school. At the same time the adult “children” (and their families) would be moti- vated to begin their working career in Hungary.
In the first 5-6 years, contributions from the mentioned 8 cohorts (i.e. 560,000 employees that is 560,000 = 8 * 70,000)14 would increase the assets of the Fund. From the year 2026, the number of the contributors would be stabilized at around 400,000, as the number of those leaving15 would be the same as those newly entering into the system. After 2026 a stabilized number of cohorts (5) of youngsters would contribute to the Fund.
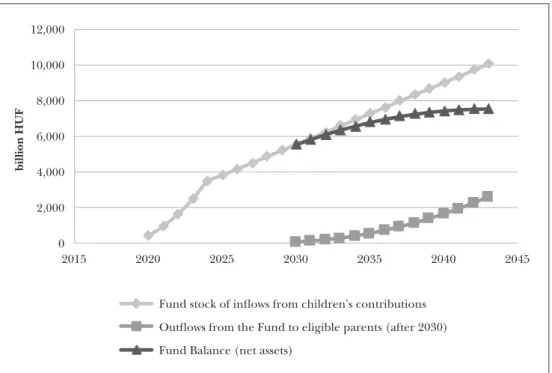
Figure 5 shows substantial increase in the assets of the Funds. This is the usual characteristic of all kind of pension Funds. In case of a newly introduced system it only
collects contributions without spending on pensions, for about one or two decades. In the long run, the contribution and the expenditure sides would be balanced, as the contributions by children (4 million HUF/child) will be enough for about 18 years extra pension of his/her parents.
Figure 5: The “C2Parent” Fund: inflows and outflows (outflows from the year 2030), HUF in billion
2015 2020 2025 2030 2035 2040 2045
billion HUF
Fund stock of inflows from children's contributions Outflows from the Fund to eligible parents (after 2030) Fund Balance (net assets)
0 2,000 4,000 6,000 8,000 10,000 12,000
Source: Edited by the authors
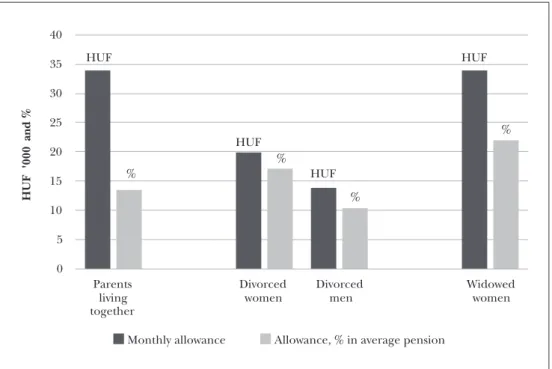
Figure 6 shows the income effect of the proposed new system in case of the af- fected pensioners. By way of demonstration, we have chosen the year 2024, and a pen- sioner with 2 working children.16 The increase in income is most substantial for wid- owed pensioners; their income would increase by 22 per cent. For pensioner-parents living together the income would increase by 12.5 per cent, also a significant increase.
The number of parents eligible for the extra pension would remain stable for 10-12 years (1.3 million for 1.7 million children). Reduction would start in 2030, as at that time a large number of new pensioners will enter the C2P allowance scheme.
After 2030, the C2P and the transitional system would exist parallel for some time.
After 2050, only the C2P would remain in operation. In the figure 6 we can see that the divorced parents get shared allowance. It is also important that the relative weight of the C2P allowance is the highest in the case of widowed women. This underlines the positive redistribution effect of the proposed C2P pension in favour of the most vulnerable strata among pensioners.
Figure 6: The monthly sum of the C2P allowance in case of families with 2 children and its relative weight (in thousand HUF and in % of the regular pension receivable in the year 2024)
0 5 10 15 20 25 30 35 40
Parents living together
Divorced
women Divorced
men Widowed
women
HUF'000and %
Monthly allowance Allowance, % in average pension HUF
HUF
HUF
HUF
%
%
%
%
Source: Edited by the authors
Transitional child-to-parent based pension element
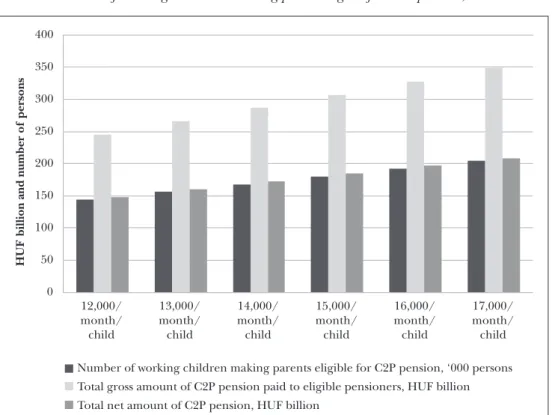
Parents would receive an extra pension allowance of HUF 12,000 per month per child in 2019. This amount would be increased annually, until it reaches HUF 17,000 per month in 2024 (an additional HUF 1 thousand every year).
Parents in the transitional system would be entitled to receive extra pension al- lowance if their children have worked for 10 years before 2018. If the child was not employed for 10 years, a possibility should be given for correction during the period 2019-2027. In this temporary period, parents would get half the amount given to par- ents with 10 years employment.
Figure 7 shows the temporary extra pension, the number of children, the outlay for extra pension, as well as the effects of the system. For the state, the increase in the deficit would only be 60-65 per cent of the amount spent, as the consumption taxes and the increased GDP would lead to substantial receipts.
The aim of the two different models for the child-based pension element is to fulfil the needs of a sustainable population with a balanced entry of new generations. Due
Figure 7: Total amount of C2P pension paid to eligible parents, changing year to year.
Number of working “children” making parent eligible for C2P pension, 2019-2024
0 50 100 150 200 250 300 350 400
12,000/
month/
child
13,000/
month/
child
14,000/
month/
child
15,000/
month/
child
16,000/
month/
child
17,000/
month/
child
HUF billion and number of persons
Number of working children making parents eligible for C2P pension, ‘000 persons Total gross amount of C2P pension paid to eligible pensioners, HUF billion Total net amount of C2P pension, HUF billion
Source: Edited by the authors
to the aging population, there is a great need for a correction of the pension scheme, requiring not only financial provision but also a successive generation flow.
Summary
As the current pension scheme takes barely child-raising into consideration or not at all, there is a significant demographic distortion, frequently voiced in the unfortu- nate opinion that “it is not worth” having children. This message, associated with the current pension scheme on both an anecdotal and a statistical level, urgently needs to be reversed. For this reason, we propose a “child-to-parent based pension scheme” that would be fairer financially and more efficient demographically. As demonstrated, the proposed system would also considerably reduce old-age poverty, particularly for the highly vulnerable strata of widowed women who have raised two or more children and have a very low pension income due to their historic lack of contributions as a result of their years invested in child-rearing.
Notes
1 This study uses the results of the following research projects of the author Szilvia Szegő: OTKA 29858, OTKA 18390, Hungarian Academy of Sciences.
2 In this paper the effects of the different financial positions of the various generations in Hungary, which significantly differ from the Western scheme, are not analysed.
3 On the social reality see Vass, 2005.
4 See the large number of publications on family economics in the last 40 years.
5 About population deficit see Szegő, 2002.
6 Families’ life stage conflicts were demonstrated by Szilvia Szegő as a result of investigation OTKA 18390 (Hungarian Academy of Sciences) and described in Szegő, 2006.
7 The notion of parents child-rearing age is worked out by Szilvia Szegő in the research projects OTKA 29858 (Hungarian Academy of Sciences).
8 One of the reasons of the declining birth trend is that children are no longer viewed as labour supply for the family economy.
9 This pyramid was modelled by László Radnóti in the research project of Szilvia Szegő (OTKA 29858).
The method of the model is based on the publication Arriaga, 1994.
10 Ibid.
11 The average educational cost/pupil/year multiplied by the average years of education.
12 According to statistical methods the cost of one child is the 18.75% of the total cost of the 2+2 family type. This stems from the statistical methods used in calculating consumption, where one adult is 1 consumption unit, while one child is 0,6 consumption unit.
13 The methods used for taking the parents’ performance into account in child-rearing resulted in an added allowance in an amount of about 2-4 percent to their pension (3-8 percent in case of two children).
14 Yearly 70,000 young people begin working carrier.
15 Having worked 4 (5) years.
16 For 1 child, the amount or the percentage is the half of the above, for 3 children, the amount or per- centage is 1.5 times more as the figures presented.
References
Arriaga, Eduardo (1994): Population analysis with Microcomputers. Bureau of the Census, USA.
Asztalos, László Gy. (2009): A családtámogató gazdaság és pénzügypolitika [Family-friendly economic and financial policy]. Manuscript.
Augusztinovics, Mária (1996): Újraelosztás és a jóléti állam [Redistribution and welfare state]. Társadalmi Szemle, Vol. 51, No. 2, pp. 14-28.
Botos, Katalin (2010): Demográfia és nyugdíjrendszer kapcsolata [Correlations between demography and the pension scheme]. Polgári Szemle, Vol. 6, No. 3, pp. 11-22.
Cremer, Helmuth; Gahvary, Firouz and Pestieau, Pierre (2009): Fertility, Human Capital Accumulation, and the Pension System. Journal of Public Economics, Vol. 95, No. 11-12, https://doi.org/10.1016/j.jpu- beco.2010.09.014.
Cigno, Alessandro (2009): How to Avoid a Pension Crisis: A Question of Intelligent System Design. IZA Pol- icy Paper, No. 4.
Giday, András (2011): Gyermekfedezetű nyugdíjelem beiktatása [Introduction of the child-based pension element]. Polgári Szemle, Vol. 7, No. 4, pp. 30-38.
Giday, András and Szegő, Szilvia (2016): A társadalombiztosítás megújításának keretei Magyarországon [Framework for the renewal of social security in Hungary]. Polgári Szemle, Vol. 12, No. 4-6, pp. 55-74.
Giday, András and Szegő, Szilvia (2017): “Getting Over” National External Indebtedness: Or Is Baron Mun- chausen’s Story Not a Mere Fairy Tale After All? Civic Review, Vol. 13, Special Issue, pp. 119-150, https://
doi.org/10.24307/psz.2017.0308.
Hareven, Tamara K. (1982): Family Time and Industrial Time. Cambridge University Press, Cambridge.
Jager, Anett; Kops, Yvonne and Van der Lippe, Tanja (2003): Combination pressure: the work family bal- ance in European countries. In: Households, Work and Flexibility. EU F5 Project.
Joshi, Heather and Davies, Hugh (1991): Child Care and Mothers’ Lifetime Earnings: Some European Contrasts. CEPR Discussion Papers, No. 600, Centre for Economic Policy Research, London.
Lentner, Csaba; Sági, Judit; Tatay, Tibor and Neumanné Virág, Ildikó (2017): Certain Effects of Family and Home Setup Tax Benefits and Subsidies. Public Finance Quarterly, Vol. 62, No. 2, pp. 171-187. www.penzu- gyiszemle.hu/pfq/upload/pdf/penzugyi_szemle_angol/volume_62_2017_2/sagi_2017/2_a.pdf.
Mészáros, József (2005): A társadalombiztosítási nyugdíjrendszerek és a termékenység kölcsönhatása [Inter- action of social security pension systems a fertility]. Demográfia, Vol. 48, No. 4, pp. 436-450.
Szegő, Szilvia (2002): Korai társadalmi öregedés és a családok gyermekvállalási korszakának összezsu go- rodása [Early social ageing and the sharply shrinking childbirth period of families]. In: Kulin, Ferenc (ed.): Népesedéspolitika Magyarországon [Population policy in Hungary]. Kölcsey Füzetek, Kölcsey Intézet, pp. 59-82. (Paper based on the research work Szilvia Szegő: Quo vadis család-háztartás? [Quo vadis family- households?] OTKA Research of the Hungarian Academy of Sciences No. 509; Families’ life course conflicts (1996); OTKA 18390.
Szegő, Szilvia (2006): A magyarországi lakosság életpályájának főbb jellemzői [Main career features of the Hun- garian population]. Manuscript, Volksbank.
Szegő, Szilvia (2011): Pension Containing Allowance Paid By Children – Why and How? Public Finance Quarterly, Vol. 56, No. 4, pp. 429-445.
Vass, Csaba (2005): Bevezető fejezetek a társadalom-gazdaságtanba [Introduction to social-economics]. Kölcsey Füzetek XIV, Kölcsey Intézet, Budapest.
Wallace, Claire (2002): Household Strategies: Their Conceptual Relevance and Analytical Scope in Social Research. Sociology, Vol. 36, No. 2, pp. 275-292, https://doi.org/10.1177/0038038502036002003.