Application of Variable Neighbourhood Search Method for Vehicle-Routing Problems in an Integrated Forward and Reverse Logistic Chain
Jasenka Djikanovic
1, Dusan Joksimovic
2, Mirko Vujosevic
11 Faculty of Organizational Sciences, No 54 Jove Ilića Street, 11 000 Belgrade, Serbia, jasenka.djikanovic@voban.groupnbg.com, mirkov@fon.bg.ac.rs
2 Electrical Engineering Institute Nikola Tesla, No 8a Koste Glavinica Street, 11 000 Belgrade, Serbia, jdusan@ieent.org
Abstract: A closed-loop problem in which vehicles deliver new products to the consumer and pick up products that have reached the end of their life is considered in this paper. It is assumed that capacities of vehicles and locations are limited. The aim is to minimize the total distances between locations in forward and reverse flow. A new mixed integer programming model (MILP) is presented. For its solution four variants of the variable neighbourhood search (VNS) method are proposed. The vehicle-routing search contains two steps, in which algorithms based on VNS are applied. Four VNS variants are also presented. The problems are solved optimally for a small number of nodes using MATLAB.
The effectiveness of the presented model is evaluated with numerical examples.
Keywords: supply chain; reverse logistics; vehicle-routing problem; variable neighbourhood search; closed-loop supply chain
1 Introduction
Integrated models of logistic and reverse logistics supply are also known as closed-loop supply chains. These models include not only traditional logistic activities and flows, but also return channel activities. Design of the forward and reverse logistics should be integrated because configuration of the reverse logistics network has a strong influence on the forward logistics network and vice versa [1].
Transportation costs in a forward flow are, usually, controlled. One of the main problems with integrated forward and reverse flow (IFRL) is the consolidation of these flows in order to minimize the total transportation costs. Coordination between forward and reverse flows is necessary in order to achieve a total cost savings supply chain [2]. The transportation costs in a reverse flow have a significant influence on the total costs. Therefore, it is necessary to design and control all transportation costs in an integrated forward and reverse flow.
In this paper we consider integrated forward and reverse logistics, which is modelled as a vehicle-routing problem. The problem is to find delivery and collection routes. The purpose is to minimize the total distances that vehicles travel in order to supply the consumer centres with products and subsequently to collect products that are returned by customers. The consumer centres are organized as retail centres where consumers can buy a product but also return one that has reached the end of its life. The many-to-many-to-many type of closed- loop system with sets of suppliers, manufacturers’ centres, distribution centres and consumer centres in a forward flow is considered. Two different sets are considered in a reverse flow. First, in a reverse flow there are depots where collected products are returned from consumer centres, disassembled and classified in two groups: those that will be sent to disposal centres and those that will be distributed to the manufacturers' centre. Second sets in a reverse flow are disposal centres.
Closed-loop supply chains and the reverse logistics concept have been researched widely in recent years (Geyer et al. [3]; Srivastava [4]; Lee et al. [1]). The vehicle- routing problem is one of the main problems that occur in a reverse logistics flow.
Le Blanc et al. [5] pointed out the potential of improved vehicle-routing models for reverse logistics. Kristianto et al. [6] proposed a supply chain redesigned by means of inventory optimization and transportation routes. Lin et al. [7] presented green vehicle-routing problems (GVRP), classified into three groups: green- VRP, pollution-routing problem, and VRP in reverse logistics. Many of the problems that occur in supply chain management are too large and they can be solved only by heuristic methods. Hishamuddin et al. [8] considered a two-stage recovery model solved by a heuristic. Govindan et al. [9] presented a novel two- echelon location-routing problem with time windows in a closed-loop supply chain. The problem was solved with a robust multiobjective metaheuristic which included multiobjective particle swarm optimization (MOPSO) and adapted multiobjective variable neighbourhood search (AMOVNS) with the aim of reducing costs caused by carbon footprints and greenhouse gas emissions. Kim et al. [10] proposed a vehicle-routing problem for recycling electronic products that had reached the end of their life in South Korea. They solved this problem by using the Tabu Search algorithm. Buhrkal et al. [11] studied the waste collection vehicle-routing problem with a time window and they use a large neighbourhood search algorithm to solve the problem. Bing et al. [12] presented a vehicle-routing problem for plastic waste collection in the Netherlands. They used the Tabu Search algorithm to improve the routes. Tasan et al. [13] used a genetic algorithm to solve the vehicle-routing problem with simultaneous distribution and collection of products. Aras et al. [14] presented a selective multi-depot vehicle-routing problem. Erbao et al. [15] proposed an open vehicle-routing problem with an uncertain demand and they solved it with an improved differential evolution algorithm (IDE). Tomic et al. [16] solved a location problem using a greedy heuristics algorithm and analytical hierarchical problem (AHP).
Eskandarpour et al. [17] proposed a parallel variable neighbourhood search for multiobjective optimization in closed-loop supply chain. Total fixed and variable costs, total tardiness and environmental pollution are analyzed in this paper.
Zolfagharinia et al. [18] formulated a reverse logistics model with two types of inventory stock points: serviceable and remanufacturable. They designed a simulation-based hybrid variable neighbourhood search to solve the model.
Variable neighbourhood search is also used to solve other problems in reverse logistic chains. Eskandarpour et al. [19] used variable neighbourhood along with landscape analyses to solve third-party logistics provider problems. The problem is presented as a bi-objective MILP and novel multi-start VNS with nine neighbourhood structures suggested. Devika et al. [20] proposed a closed-loop supply chain with six echelons and developed three novel hybrid heuristic methods based on adapted imperialist competitive algorithms and variable neighbourhood search. Jarboui [21] proposed a location-routing problem solved with VNS.
Castillo-Villar [22] proposed the VNS method for ship-routing and scheduling problems with a variable speed and discretized time windows. Cruz and et al. [23]
proposed the VNS heuristic for a vehicle-routing problem with simultaneous pick- up and delivery where the variable neighbourhood descent (VND) and the Tabu Search (TS) were used for local search.
The paper is organized as follows: the integrated forward and reverse model is presented in Section 2; the notation and the mathematical model are presented in Section 3; Section 4 contains a presentation of the VNS algorithm; test examples and results are presented and discussed in Section 5, which also concludes the paper.
2 Integrated Forward and Reverse Logistics Model
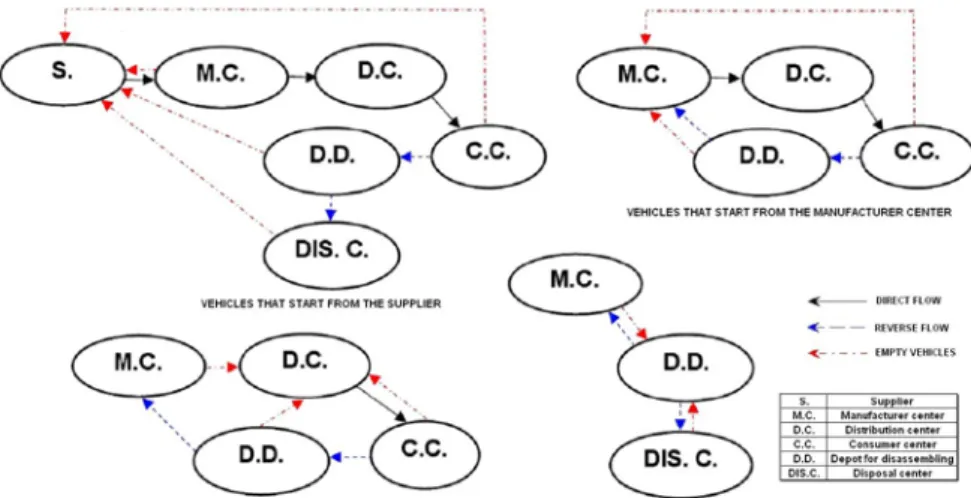
A vehicle-routing search is performed for each individual consumer centre. In each step, a single supplier, manufacturer centre, distribution centre, depot for disassembly, and disposal centre has been assigned to the particular consumer centre. The routes and the number of vehicles depend on the demand of a consumer centre (dk), the percentage of products that are removed from further use (y), the percentage of products that are disposed of (r), the vehicle capacity (qv), and the available capacities of the vehicles assigned to those consumer centres where the search is completed.
A check of whether and how many new vehicles are required is performed on each route. Also, it is checked whether there are any vehicles that should return to their original location on each route. This verification is based on the available capacities of vehicles which are assigned to the consumer centres where the search is completed. If the number of required vehicles on the next route is lower than
that on the previous route, empty vehicles return to their original locations. If the number of vehicles is greater than the number of vehicles required on the previous route, new vehicles are added. Movements of the vehicles are presented in Figure 1. The movements of the vehicles that transport products are described by full arrows and returning empty vehicles by dashed arrows.
Figure 1 Closed-loop logistic network
3 Model Development
The assumptions:
• all manufacturers’ orders are satisfied by the supplier;
• all consumer centres' orders are satisfied;
• the model is designed for a single period;
• the capacity of all facilities except the supplier and manufacturer centres is known;
• the supplier and manufacturer centres' capacities are not constrained;
• all vehicles have the same capacity, which is known;
• all facilities with the same purpose have the same size and capacity;
• the percentage of collected products is known and it is the same for all consumer centres;
• the percentage of disposed products is known.
Parameters, decision variables, objective functions and constraints in the integrated forward and reverse logistics model are as follows.
Sets
S - set of suppliers s = 1...ns
I - set of locations for manufacturer centre that produces products or repairs them i
= 1...ni
J -set of locations for distribution centres in which new products are shipped from the plants j =1...nj
K -set of locations for customer centrek = 1...nk
L - set of locations for depot where products delivered from the consumer k are classified into those that can be repaired and those that cannot be repaired l = 1...nl
M - set of disposal centres where products and parts of products that cannot be repaired or reused are delivered m = 1...nm
U - set of vehicles u=1..nu Parameters
dk - demand of consumer centre k
y - expected percentage of products that have to be returned by customers r - percentage of products that have to be disposed of
D0s,i, D1i,j, D2l,i, D3j,k , D4k,s , D5i,k , D6k,l, D7l,j , D8l,m , D9l,s, D10m,s - distances between locations
N1j , N2l , N3m - capacity of distribution centre j, depot l and disposal centre m qv - capacity of vehicle
Decision variables
X0s,i - quantity of material shipped from supplier s to the manufacturer centre i X1i,j, X2j,k , X3k,l, X4l,i, X5l,m - quantity of product shipped from one location to another
0 , ,iu
Ys ,Yi1,s,u,Yi2,j,u,Yi3,l,u,Yj4,k,u,Yk5,s,u,Yk6,j,u,Yk7,i,u,Yk8,l,u,Yl9,i,u,Yl10,j,u,Yl11,m,uYl12,s,u,Ym13,s,u, 14
, ,lu
Ym - binary indicator of use of vehicles u Sequences
X - sequence which contains variables [X0…X5] Y - sequence which contains variables [Y0...Y14]
Decision vector V - sequences X and Y
The problem is to find x which minimizes the total distances between locations:
∑ ∑ ∑
∑ ∑ ∑
∑ ∑ ∑
∑ ∑ ∑
∑ ∑ ∑
∑ ∑ ∑
∑ ∑ ∑
∑ ∑ ∑
∑ ∑ ∑
∑ ∑ ∑
∑ ∑ ∑
∑ ∑ ∑
∑ ∑ ∑
∑ ∑ ∑
∑ ∑ ∑
⋅
+
⋅ +
⋅ +
⋅ +
+
⋅ +
⋅ +
⋅ +
+
⋅ +
⋅ +
⋅ +
+
⋅ +
⋅ +
⋅ +
+
⋅ +
⋅
=
u l m
u l m m l
u m s
u s m s m
u l s
u s l s l
u l m
u m l m l
u l j
u j l j l
u l i
u i l i l
u k l
u l k l k
u k i
u i k k i
u k j
u j k k j
u k s
u s k s k
u j k
u k j k j
u l i
u l i i l
u i j
u j i j i
u i s
u s i i s
u s i
u i s i s
Y D
Y D Y
D Y
D
Y D Y
D Y
D
Y D Y
D Y
D
Y D Y
D Y
D
Y D Y
D f
1 4 , , 8
,
1 3 , , 1 0
, 1 2
, , 9
, 1 1
, , 8
,
1 0 , , 7
, 9
, , 2
, 8
, , 6
,
7 , , 5
, 6
, , 3
, 5
, , 4
,
4 , , 3
, 3
, , 2 , 2
, , 1
,
1 , , 0
, 0
, , 0
m i n ,
(1)
Subject to constraints K k d y
X k
l l
k = ⋅ ∀ ∈
∑
3, , (2)∑
= ∀ ∈j
k k
j d k K
X2, ,
(3) I
i X
X X
j i j l li
s si+
∑
−∑
= ∀ ∈∑
) 0,( 0, 4, 1,
(4) J
j X
X
k jk
i ij−
∑
= ∀ ∈∑
2, 0, 1,
(5) L
l X
r X
k
l k i
i
l −
∑
− = ∀ ∈∑
(1 ) 3, 0, 4,
(6) L
l r X X
k l k m
m
l −
∑
= ∀ ∈∑
3, 0, 5, (7)
J j N
X j
i j
i ≤ ∀ ∈
∑
1, 1, (8)L l N
X l
k kl ≤ ∀ ∈
∑
3, 2, (9)M m N
X m
l m
l ≤ ∀ ∈
∑
5, 3,
(10)
∑
⋅
≤
u b u v
a q Y
X ,
{
5,}
4 , 3
, 2
, 1
, 0
,i, ij, jk, kl, li, lm
s
a X X X X X X
X ∈ ,
{
1, ,}
19 , , 8
, , 4
, , 2
, , 0
,
,iu, iju, jku, klu, liu, lmu s
b
u Y X X X X X
Y ∈ (11)
K k I i Y
Y Y
Y Y
Y
u l
u l i u i l u
u i k
u j u j i u
s i u s
u i s
∈
∀
∈
∀
=
− +
+
+
−
−
∑∑
∑
∑∑
∑∑
, , 0 ) (
) (
3 , , 9
, , 7
, ,
2 , , 1
, , 0
, ,
(12)
K k J j Y
Y Y Y
u l u j l
u i u
u j k u k j u j
i − − +
∑∑
= ∀ ∈ ∀ ∈∑∑ ∑
( ) 1, , 00, , 6, , 4
, , 2
, ,
(13)
K k S s Y
Y
Y Y
Y
u m
u s m
u l
u s l
u ksu
u i isu siu
∈
∀
∈
∀
= +
+
+ +
−
∑∑
∑∑
∑
∑∑
, , 0 )
(
1 3
, ,
1 2
, ,
5 , , 0
, , 1
, ,
(14)
K k L l Y
Y
Y Y Y
Y Y
u j
u j l
u s
u s l
u m
u l m u m l u
u l k u i l u i
u l i
k
∈
∀
∈
∀
=
−
−
−
−
− +
−
∑∑
∑∑
∑∑
∑
∑∑
, , 0
) (
) (
1 0
, ,
1 2
, ,
1 4
, ,
1 1
, , 8
, , 9
, , 3
, ,
(15)
K k M m Y
Y Y
u s
u s m
u l
u l m u m
l − −
∑∑
= ∀ ∈ ∀ ∈∑∑
( ) 1, , 3 0, ,1 4
, ,
1 1
, ,
(16)
K k Y
Y
Y Y
Y
u l u l k u i
u i k
u s
u s k
u j
u j k u k j
∈
∀
=
−
−
−
−
−
∑∑
∑∑
∑∑
∑∑
, 0 ) (
8 , , 7
, ,
5 , , 6
, , 4
, ,
(17)
0 ,
, ,iu
Ys Yi1,s,u,Yi2,j,u,Yi3,l,u,Yj4,k,u,Yk5,s,u,Yk6,j,u,Yk7,i,u,Yk8,l,u,Yl9,i,u,Yl10,j,u,Yl11,m,u,
12 ,
, ,su
Yl Ym13,s,u,Ym1 4,l,u ∈
{ }
0,1 ∀(i∈I,j∈J,k∈K,l∈L,s∈S,m∈M,u∈U)(18) The objective function (1) minimizes total vehicle travel distances. Constraint (2) shows that all returned quantity is delivered to depots. Constraint (3) explains that all customers’ demands are satisfied. Constraint (4) ensures that the total quantity delivered by the supplier and returned by the customer is equal to the quantity delivered by the manufacturer to the distribution centre. Constraints (5-7) ensure that there are flow balances between manufacturer centres and distribution centres, consumers and depots, and depot and disposal centres, respectively. Constraints (8) and (9) present capacity constraints for distribution centres and depots and constraint (10) shows the capacity constraint for disposal centres. Constraint (11) presents capacity constraint for vehicles. X and Y are presented respectively in the given sets. Constraints (12-17) ensure that all vehicles return to their original locations. Constraint (18) presents a binary restriction for the listed decision variables.
4 A New VNS Variants in the Integrated Forward and Reverse Logistic Chain
The variable neighbourhood search was proposed by Mladenovic and Hansen [24]. One of the main reasons for the development of the VNS algorithm is the weakness of local search strategies that fall into a local optimum and have no ability to leave it. There are many different variants of the variable neighbourhood search and two new ones are presented by Hanafi et al. [25]. The basic VNS is presented by Hansen and Mladenovic [26].
• Initialization
o Select a set of neighbourhood structures Nk(k=1,...,kmax), that will be used in searching
o Find an initial solution x o Choose a stopping condition o Set k←1
• Repeat the following steps until k= kmax
o Shaking. Generate a point x' from kth neighbourhood of x, x(x'
∈
Nk(x)) o Local search. Application of some local search method with x' as initialsolution; denote by x'' the obtained local optimum
o Move or not. If this local optimum x" is better than the incumbent, move there (x←x"), and continue search with N1 (k←1), otherwise set k← k +1
Vehicle-routing search is performed for each consumer centre separately. The aim of the search is to assign a supplier, manufacturer centre, distribution centre, depot for disassembly and disposal centre to each consumer centre. Vehicles, distribution centres, depots for disassembly and disposal centres are capacitated and thus the result depends on the order of the consumer centres during the search.
Because of that, the search consists of two steps. In both steps algorithms based on VNS are applied, as follows:
• search of the routes for each consumer centre separately (VNS1 algorithm)
• sorting of consumer centres (VNS2 algorithm)
4.1 Search of the Routes for Each Consumer Centre Separately (VNS1 Algorithm)
We present an algorithm of the VNS1 heuristic below. In it a feasible solution xk is represented as sequence Rk which contains indexes of the supplier 's', manufacturer centre 'i', distribution centre 'j', depot for disassembly 'l' and
disposal centre 'm' (Rk = [s i j l m] ) assigned to the consumer centre k. X and Y are determined by the sequence Rk and input parameters as described in Sections 2 and 3. The initial solution xk is selected randomly. The VND method is used for a local search. In the shaking phase, the solution xk' is selected randomly from the neighbourhood Nh. The neighbourhood Nh is formed in the environment of the current best solution xk. The local optimum xk" is obtained through a local search in the environment of the result xk'. In each step h, a random selection of the ntot/(nc-h) solutions xk' from the neighbourhood Nh is performed. The total number of locations without consumer centres is marked as ntot (ntot=ns+ni+nj+nl+nm). The number of location types is marked as nc (nc=6).
The results are values fk and they present the total distances that a vehicle assigned to a consumer centre k should travel. Iff k(xk")<f k(xk), the solution xk is updated and the algorithm returns to the neighbourhood structure N1. Otherwise, after a local search, the algorithm goes to a new neighbourhood Nh+1. The algorithm ends when it reaches the neighbourhood Nhmax and it cannot find a better new solution there. The total number of neighbourhoods is marked as hmax.
Algorithm 1: VNS1 heuristics for vehicle-routing search for each consumer centre k
Input: the set of neighbourhood structures Nh for h = 1,...,hmax xk← initial solution (randomly selected)
h ← 1;
while h ≤ hmax i ← 1;
found ← 0;
while (i ≤ ntot/(nc-h) ^ (found = 0) /Check ntot/(nc-h) solutions from Nh/ xk' ← neighbour in Nh(xk) /Shaking/
xk" ← VND local search (xk') /Local search/
if fk(xk") < fk(xk) /Move or Not/
xk← xk";
h ← 1;
i ← 1;
found ← 1;
else i = i + 1;
end end if found = 0
h ← h + 1; /Neighbourhood Change/
end end
return xk, fk;
4.1.1 Shaking
The applied VNS heuristics use five neighbourhood structures for the shaking phase (hmax = 5). Neighbourhoods are based on sequence Rk. An example of neighbourhood structures used in the shaking phase for the fifth consumer centre (k=5) is presented in Figure 2.
Figure 2
Example of neighbourhood structures for shaking phase
For example, the first neighbourhood N1 includes all solutions which, compared with the current best solution, have four common nodes and one different node. If distribution centres, depots for disassembly and disposal centres cannot receive any consumer centre because their capacities are exceeded, these solutions are not included in any neighbourhood.
4.1.2 Local Search:VND Method
The VND algorithm is presented below. The applied VND heuristic uses five neighbourhood structures (hmax = 5). The algorithm checks one solution in Nh neighbourhood and moves to neighbourhood Nh+1 if a new local optimum has not been found in neighbourhood Nh. Otherwise, the algorithm returns to neighbourhood N1 and updates the solution to xk". The algorithm ends when it moves to neighbourhood Nhmax and cannot find a new local optimum there.
Algorithm 2: VND - local search of vehicle-routing for consumer centre k Input: the set of neighbourhood structures Nh for h = 1,...,hmax
xk" ← initial solution (selected in shaking phase of VNS1) h ← 1;
while h ≤ hmax
xk' ← solution in Nh(xk")
if fk(xk') < fk(xk") /Move or Not/
xk" ← xk';
h ←1;
else
h ← h + 1; /Neighbourhood Change/
end end return xk";
An example of neighbourhood structures used in a local search for the fourth consumer centre (k=4) is presented in Figure 3.
Figure 3
Example of neighbourhood structures for local search
For example, the first neighbourhood N1includes all solutions which compared with the current local optimum all have common nodes except the supplier node.
Also, the neighbourhood includes only solutions with disposal centres whose capacities are not exceeded. Values y and r are taken into consideration in all cases.
4.2 Sorting of Consumer Centre Sequences (VNS2 Algorithm)
Sorting of consumer centre sequences is performed by a VNS method with a deterministic selection of solutions. We analysed four variants of VNS2. The aim of the search was to determine the near-optimal order of the consumer centres.
The purpose of this determination was to search out routes for each consumer centre separately with VNS1. Solutions z are strings of indexes of consumer centres, i.e. nk = 5: z = [k4 k2 k1 k3 k5].
First, a vehicle route search is performed without taking into consideration the capacity constraints with the VNS1 algorithm. The results are values fuk and they present the total distances that a vehicle assigned to a consumer centre k should travel.
After that, the vehicle route search is performed which takes into consideration capacity constraints. For all VNS2 variants, the initial solution is a string of indexes obtained by sorting of the consumer centres according to the demand criterion. The sorting is performed from the largest to the smallest demand. The VNS1 algorithm is applied to the initial solution. The results are values fk (k = 1,...,nk). The values dfk obtained as fk - fuk represent the difference in the total distances with and without consideration of capacity constraints. The string of indexes for consumer centres kz is obtained by sorting the dfk from the largest to the smallest. This string is used to determine the total number of neighbourhoods and to select the solution in the shaking phase. The solutions are selected as follows: priority is given to the consumer centres with the higher values of dfk. When a new best solution is found, a new string of kz is formed.
A VNS2 heuristic algorithm is given below. The neighbourhood Nh is formed in the environment of the current best solution z. A selection of the imax(h) solutions
z' is performed at each step h from the neighbourhood Nh. After that, a VNS1 algorithm is applied to each consumer centre. If f(z')<f(z), the solution z is updated, a new string of kz is calculated and return to the neighbourhood N1 is performed. Otherwise, the algorithm passes to the neighbourhood Nh+1. The algorithm ends when it reaches the neighbourhood Nhmax and it cannot find a new and better solution in that neighbourhood.
Algorithm 3: VNS2 heuristics - determination of consumer centre sequences for k = 1:nk
xk, fuk← VNS1 search (k) without capacity limit;
end
z ← initial solution (customer centres sorted by demand) for i = 1:nk
k = z(i);
xk, fk← VNS1 search (k) with capacity limit;
end
f(z) = sum(fk);
for k = 1:nk dfk = fk - fuk; end
sort dfk;
kz ← indexes of customer centres in sorted dfk;
Input: the set of neighbourhood structures Nh for h = 1,...,hmax h ← 1;
while h ≤ hmax i ← 1;
found ← 0;
while (i ≤ imax(h)) ^ (found = 0) /Check imax(h) solutions from Nh/ z' ← neighbour in Nh(z) /Shaking/
for i = 1:nk k = z'(i);
xk, fk← VNS1 search (k);
end
f(z') = sum(fk), (k = 1,...,nk);
if f(z') < f(z) /Move or Not/
z ← z';
h ← 1;
i ←1;
found ← 1;
for k = 1:nk dfk = fk - fuk; end
sort dfk;
kz ← indexes of customer centres in sorted dfk
hmax ← number of dfk elements greater than zero
else
i ← i + 1;
end end if found = 0
h ← h + 1; /Neighbourhood Change/
end end return V;
VNS2.1 variant: example of neighbourhood structures of VNS2.1 for five consumer centres (nk=5) is presented in Figure 4.
Figure 4
Example of neighbourhood structures for VNS2.1
Selection of one solution z' from the neighbourhood Nh is performed for each step h (imax(h)=1). For example, the first neighbourhood N1 includes solutions which are obtained by moving two elements of the current best solution z to the first place in the string. The solution obtained by moving the first two elements in the string kz is selected from N1. The total number of neighbourhoods hmax represents the number of consumer centres with dfk>0 divided by two.
VNS2.2 variant: example of neighbourhood structures of VNS2.2 for five consumer centres (nk=5) is presented in Figure 5.
Figure 5
Example of neighbourhood structures for VNS2.2
VNS2.2 uses one neighbourhood N1 (hmax =1) which includes solutions obtained by moving two elements of the current best solution z to the first place in the string. The total number of solutions imax(1) represents the number of consumer centres with dfk>0 divided by two. For example, the first selected solution is obtained by moving the first two elements in the string kz.
VNS2.3 variant: it uses the same neighbourhood as the first version plus one more neighbourhood. That neighbourhood includes solutions obtained by replacing the positions of the two consumer centres in the current best solution
z
. The solutions with a replaced position of the consumer centres with at least one common vehicle are selected. The number of solutions imax(hmax) that are selected from thisneighbourhood is equal to half of the number of the consumer centres that use the same vehicles.
VNS2.4 variant: it uses the same neighbourhood as the second version. Unlike the second version, it contains a neighbourhood in which the selection of solutions is based on common vehicles like version VNS2.3.
Figure 6
Example of Nhmax neighbourhood structures for VNS2.3 and VNS2.4
Figure 6 presents VNS variants 2.3 and 2.4 where consumer centres have common vehicles (first line), and without common vehicles (second line).
5 Results
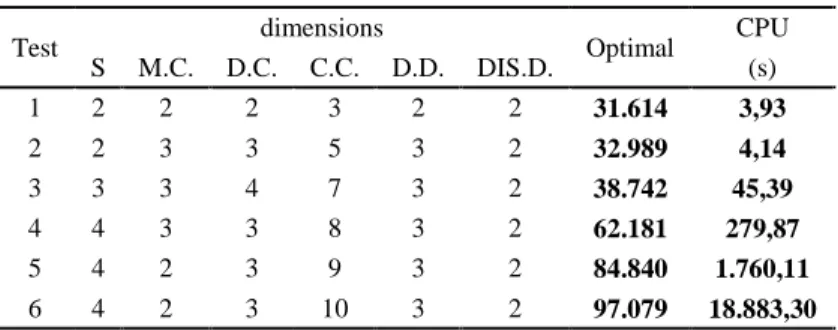
The proposed model is illustrated by numerical examples. The algorithms are coded in MATLAB language. The running time is presented for an AMD Triple Core Processor 2.10 GHz. The optimal solution is obtained with the complete enumeration method.
First, a comparison between the optimal solution and VNS is presented for small instances and the results are presented in Tables 1 to 3. The optimal solution is calculated for a small number of nodes in order to evaluate the results obtained with heuristics. We calculate the ‘gap’ as the percentage of deviation of a solution obtained with heuristics compared with the optimal solution.
Table 1
Optimal solutions for small number of nodes
Test dimensions
Optimal CPU
S M.C. D.C. C.C. D.D. DIS.D. (s)
1 2 2 2 3 2 2 31.614 3,93
2 2 3 3 5 3 2 32.989 4,14
3 3 3 4 7 3 2 38.742 45,39
4 4 3 3 8 3 2 62.181 279,87
5 4 2 3 9 3 2 84.840 1.760,11
6 4 2 3 10 3 2 97.079 18.883,30
Table 2
Heuristics 2.1 and 2.2: solutions for small number of nodes
No. VNS2.1 gap CPU
VNS2.2 gap CPU
(%) (s) (%) (s)
1 31.614 0,00 0,51 31.614 0,00 0,48 2 33.846 2,53 0,63 33.006 0,05 0,65 3 38.770 0,07 0,78 38.770 0,07 0,78 4 67.275 7,57 0,82 67.295 7,59 0,82 5 87.997 3,58 0,84 88.003 3,59 0,84 6 97.732 0,67 0,75 97.732 0,67 0,73
Table 3
Heuristics 2.3 and 2.4: solutions for small number of nodes
Test VNS2.3 gap CPU
VNS2.4 gap CPU
(%) (s) (%) (s)
1 31.614 0,00 0,49 31.614 0,00 0,49 2 33.846 2,53 0,63 33.006 0,05 0,65 3 38.770 0,07 0,80 38.757 0,04 0,83 4 67.238 7,52 0,85 67.238 7,52 0,85 5 87.997 3,58 0,87 87.974 3,56 0,90 6 97.732 0,67 0,85 97.732 0,67 0,87
For small instances, differences between the results obtained by the optimal solution and heuristics range up to 7.59%, but the solutions are obtained for considerably shorter times with heuristics. The optimal solution takes up to approximately eight times slower CPU times in comparison to VNS in an example [2 2 2 3 2 2]. Next, we show an example with three consumer centres. Vehicle routes and the number of the vehicles on each route (numbers positioned above the arrows) are presented in Figure 7.
Figure 7
Vehicle routes and number of vehicles on each route
Finally, we analyse the four different VNS variants proposed in this paper. For large instances presented in Tables 4 and 5 parameters for all tests are set as follows.
• Not all consumer centres have the same demands. Demand of consumer centre dkvaries from 900 to 4.000 products.
• y = 0,30, r = 0,15.
• N1j vary from 25.000 to 38.500 products.
• N2l vary from 10.000 to 16.500 products.
• N3m vary from 5.000 to 5.500 products.
• qv = 400.
Because of the large dimensions of the problem, the distances between nodes are generated.
Table 4
Heuristic 2.1 for larger number of nodes
No. dimensions
VNS2.1 CPU
S M.C. D.C. C.C. D.D. DIS.D (s)
1 12 3 4 10 4 2 49.477 0,94
2 14 4 6 20 5 3 129.475 0,94
3 19 6 11 40 8 4 194.642 2,11
4 20 6 19 60 12 5 267.316 3,49
5 22 7 20 80 15 7 321.543 9,71
6 22 8 22 100 16 7 474.428 11,25
7 25 10 25 200 20 9 716.319 56,31
8 25 10 26 300 21 9 1.210.520 157,08
9 27 11 30 400 22 10 1.869.137 591,74
10 28 11 32 500 24 11 3.033.602 736,09 11 28 12 33 600 25 12 4.501.674 812,61 12 28 13 34 700 25 12 6.496.589 1.141,41 13 29 14 34 800 26 12 8.493.187 1.290,19 14 30 14 35 900 27 12 11.355.388 2.630,99 15 30 15 35 1000 28 12 13.866.563 2.447,60
Table 5
Heuristics 2.2 to 2.4 for larger number of nodes
No. VNS2.2 CPU
VNS2.3 CPU
VNS2.4 CPU
(s) (s) (s)
1 49.477 1,03 49.028 1,05 49.022 1,11
2 123.373 1,16 121.524 1,57 120.947 1,62
3 194.686 2,57 193.613 3,45 194.63 4,02
4 270.952 3,56 266.907 8,03 265.903 8,96
5 326.484 8,98 320.249 24,52 321.587 23,90
6 476.591 26,27 467.988 31,71 460.111 39,10 7 725.137 51,28 696.314 150,90 725.083 90,86 8 1.224.612 270,01 1.180.346 445,33 1.194.800 472,27 9 1.874.686 286,74 1.830.119 589,47 1.851.656 1.055,73 10 3.123.883 870,73 2.976.617 1.080,44 3.058.638 1.026,96 11 4.527.108 1.127,73 4.399.102 1.167,98 4.481.589 1.339,31 12 6.558.899 1.154,85 6.386.439 1.513,42 6.477.977 1.450,76 13 8.591.609 1.677,77 8.413.728 1.729,21 8.554.275 1.912,32 14 11.621.579 2.327,21 11.224.140 3.296,33 11.451.959 2.966,31 15 13.996.870 2.712,88 13.728.129 3.299,11 13.875.346 3.262,39
Regarding the large instances, we outline below some important conclusions.
• The variant VNS2.3 is found to be better than all other VNS variants and it has the best solution in 73,33% of all tests with different numbers of nodes.
• VNS2.1 has the shortest CPU time at 73,33%, but the solutions obtained with this heuristic are worse in comparison with other heuristics by 1,89% on average.
• The heuristics VNS2.1 and VNS2.3 are familiar, but adding of one more neighbourhood allows to the VNS2.3 to give better results. VNS2.1 has a smaller averaged CPU time by 34,88% in comparison to VNS2.3.
Otherwise, VNS2.3 has a better average solution by 1,39%.
Also, the heuristics VNS2.2 and VNS2.4 are familiar, but adding one more neighbourhood allows the VNS2.4 to give better results. VNS2.2 has an average CPU time smaller by 29,77% in comparison with VNS2.4. Otherwise, VNS2.4 has an average solution better by 1,13%.
Conclusion
We studied VRP for an integrated forward and reverse logistics model. The main contribution of this paper is the presentation of an original closed-loop vehicle- routing problem as well as four original VNS heuristics for solving problems of large dimensions. First, we presented a VRP that aims at minimizing transportation distances. Second, we proposed an original VNS heuristic for larger problems. Also, for smaller problems an optimal solution is presented. The performance of the proposed algorithm was evaluated through numerous computational experiments.
The application of the heuristics for vehicle-routing problems is an area of research that is likely to develop rapidly in the future, especially now that the market has become more and more open and has no borders that could limit the transportation of materials and goods. The experiments performed in this paper show that the algorithm based on the VNS method can be applied very successfully.
References
[1] Lee, D., Dong, M.: A Heuristic Approach to Logistics Network Design for End-of-Lease Computer Products Recovery, Transportation Research Part 3, (2008) 455-474
[2] Zhang, Z. H., Li, B. F., Qian, X., Cai, L. N.: An Integrated Supply Chain Network Design Problem for Bidirectional Flows, Expert Systems with Applications, 41 (2014) 4298-4308
[3] Geyer, R., Jackson, T.: Supply Loops and Their Constraints: The Industrial Ecology of Recycling and Reuse. California Management Review, 46 (2) (2004) 55-73
[4] Srivastava, S. K.: Green Supply-Chain Management: a State-of-The-Art Literature Review. International Journal of Management Reviews, 9 (2007) 53-80
[5] Le Blanc, L., van Krieken, M., Krikke, H., Fleuren, H.: Vehicle-Routing Concepts in the Closed-Loop Container Network of ARN—a Case Study, Operations Research-Spektrum, 28 (1) (2006) 53-71
[6] Kristianto, Y., Gunasekaran, A., Helo, P., & Hao, Y.: A Model of Resilient Supply Chain Network Design: A Two-Stage Programming with Fuzzy Shortest Path, Expert Systems with Applications, 41 (1) (2014) 39-49 [7] Lin, C., Choy, K. L., Ho, G. T. S., Chung, S. H., Lam H. Y.: Survey of
Green Vehicle-Routing Problem: Past and Future Trends, Expert Systems with Applications, 41 (4) (2014) 1118-1138
[8] Hishamuddin, H., Sarker, R. A., Essam, D.: A Recovery Mechanism for a Two Echelon Supply Chain System under Supply Disruption, Economic Modelling, 38 (2014) 555-563
[9] Govindan, K., Jafarian, A., Khodaverdi, R., Devika, K.: Two-Echelon Multiple-Vehicle Location-Routing Problem with Time Windows for Optimization of Sustainable Supply Chain Network of Perishable Food, Int.
J. Production Economics, 152 (2014) 9-28
[10] Kim, H., Yang, J., Lee, K. D.: Vehicle-Routing in Reverse Logistics for Recycling End-of-Life Consumer Electronic Goods in South Korea, Transportation Research Part D: Transport and Environment, 14 (5) (2009) 291-299
[11] Buhrkal, K., Larsen, A., Ropke, S.: The Waste Collection Vehicle- Routing Problem with Time Windows in a City Logistics Context, Procedia - Social and Behavioral Sciences, 39 (2012) 241-254
[12] Bing, X., Keizer, M., Bloemhof-Ruwaard, J. M., van der Vorst, J. G. A. J.:
Vehicle-Routing for the Eco-Efficient Collection of Household Plastic Waste, Waste Management, 34 (4) (2014) 719-729
[13] Tasan, A. S., Gen, M.: A Genetic Algorithm-based Approach to Vehicle- Routing Problem with Simultaneous Pick-up and Deliveries, Computers &
Industrial Engineering, 62 (3) (2012) 755-761
[14] Aras, N., Aksen, D., Tekin, M. T.: Selective Multi-Depot Vehicle- Routing Problem with Pricing, Transportation Research Part C: Emerging Technologies, 19 (5) (2011) 866-884
[15] Erbao, C., Mingyong, L., Hongming, Y.: Open Vehicle-Routing Problem with Demand Uncertainty and Its Robust Strategies, Expert Systems with Applications, 41 (2014) 3569-3575
[16] Tomic, V., Marinkovic, D., Markovic, D.: The Selection of Logistic Centers Location using Multi-Criteria Comparison: Case Study of the Balkan Peninsula, Acta Polytechnica Hungarica, 11 (10) (2014) 97-113 [17] Eskandarpour, M., Zegordi, S. H., Nikbakhsh E.: A Parallel Variable
Neighborhood Search for the Multi-Objective Sustainable Post-Sales Network Design Problem, Int. J. Production Economics, 145 (2013) 117- 131
[18] Zolfagharinia, H., Hafezi, M., Farahani, R. Z., Fahimnia, B.: A Hybrid Two-Stock Inventory Control Model for a Reverse Supply Chain, Transportation Research Part E, 67 (2014) 141-161
[19] Eskandarpour, M., Nikbakhsh, E., Zegordi, S. H.: Variable Neighborhood Search for the Bi-Objective Post-Sales Network Design Problem: A Fitness Landscape Analysis Approach, Computers & Operations Research, 52 (2014a) 300-314
[20] Devika, K., Jafarian, A., Nourbakhsh, V.: Designing a Sustainable Closed- Loop Supply Chain Network Based on Triple Bottom Line Approach: A Comparison of Metaheuristics Hybridization Techniques, European Journal of Operational Research, 235 (2014) 594-615
[21] Jarboui, B., Derbel, H., Hanafi, S., Mladenovic, N.: Variable Neighborhood Search for Location Routing, Computer and Operation Research, 40 (2013) 47-57
[22] Castillo-Villar, K. K., Gonzalez-Ramirez, R. G., Gonzalez, M. P., Smith, N.
R.: A Heuristic Procedure for a Ship Routing and Scheduling Problem with Variable Speed and Discretized Time Windows, Mathematical Problems in Engineering, (2014) http://dx.doi.org/10.1155/2014/750232
[23] Cruz, R. C., Silva, T. C. B., Souza, M. J. F., Coelho, V. N., Mine, M. T., Martins, A. X.: GENVNS-TS-CL-PR: A Heuristic Approach for Solving the Vehicle-Routing Problem with Simultaneous Pickup and Delivery, Electronic Notes in Discrete Mathematics, 39 (2012) 217-224
[24] Mladenovic, N., Hansen, P.: Variable Neighborhood Search for the p- Median, Location Science, 5 (1997) 207-226
[25] Hanafi, S., Lazic, J., Mladenovic, N., Wilbaut, C., Crevits, I.: New VNS- based 0-1 MIP Heuristics, Yugoslav Journal of Operations Research, (2014) DOI: 10.2298/YJOR140219014H
[26] Hansen, P., Mladenovic, N.: Variable Neighborhood Search: Principles and Applications, European Journal of Operational Research, 130 (3) (2001) 449-467