1 Climate signals in carbon and oxygen isotope ratios of Pinus cembra tree-ring cellulose from the 1
Călimani Mountains, Romania 2
3
Viorica Nagavciuc1,2,3*, Zoltán Kern4, Monica Ionita5, Claudia Hartl6, Oliver Konter6, Jan Esper6, Ionel 4
Popa7,8 5
6
1Faculty of Forestry, Ștefan cel Mare University, Universității Str. 13, 720229, Suceava, Romania 7
2National Institute for Research and Development of Isotopic and Molecular Technologies, 67-103 Donat Str., 400293 8
Cluj-Napoca, Romania 9
3 Stable Isotope Laboratory, Ștefan cel Mare University, Suceava, Romania 10
4Institute for Geological and Geochemical Research, Research Centre for Astronomy and Earth Sciences, Hungarian 11
Academy of Sciences, Budapest, Hungary 12
5Paleoclimate Dynamics Group, Alfred-Wegener-Institute for Polar and Marine Research, Bussestrasse 24, 13
Bremerhaven, D-27570, Germany 14
6Departement of Geography, Johannes Gutenberg University, Mainz, Germany 15
7National Research and Development Institute for Forestry Marin Dracea, Campulung Moldovenesc, Romania 16
8INCE - Mountain Economy Center CE-MONT Vatra Dornei, Romania 17
18
* Corresponding author Viorica Nagavciuc, nagavciuc.viorica@gmail.com, Ștefan cel Mare University, Suceava, 19
Romania Universității Street 13, Suceava 720229, Romania.
20 21 22 23 24 25
Abstract 26
We analyze annually resolved tree-ring stable carbon (δ13C) and oxygen (δ18O) isotopic chronologies from 27
Swiss stone pine (Pinus cembra L.) in Romania. The chronologies cover the period between 1876 and 2012 28
and integrate data from four individual trees from the Calimani Mts in the eastern Carpathians where 29
climatic records are scarce and starts only from 1961. Calibration trials show that the δ13C values correlate 30
with local April-May relative humidity and with regional to larger scale (European) summer precipitation.
31
δ18O correlates significantly with local relative humidity, cloud cover, maximum temperature, as well as 32
European scale drought conditions. In all cases, the climate effects on δ13C values are weaker than those 33
recorded in the δ18O data, with the latter revealing a tendency towards higher (lower) values of δ18O during 34
extremely dry (wet) years. The most striking signal, however, is the strong link between the interannual 35
δ18O variability recorded in the Calimani Mts and large-scale circulation patterns associated with North 36
Atlantic and Mediteraneean Sea sea surface temperatures. High (low) values of δ18O occur in association 37
with a high (low) pressure system over the central and eastern part of Europe and with a significantly 38
warmer (colder) Mediterranean Sea surface temperature. These results demonstrate the possibility of using 39
tree ring oxygen isotopes from the eastern Carpathians to reconstruct regional drought conditions in eastern 40
Europe on long-term time scales and larger scale circulation dynamics over the pre-instrumental periods.
41 42
Keywords: Swiss stone pine, δ13C, δ18O, Climate response, Dendrochronology, Atmospheric circulation 43
44
2 1. Introduction
45
In terms of recent climate change, when heat waves and summer droughts become more frequent 46
and more intense, the environment and property risks have increased and became more dangerous (IPCC, 47
2014; Spinoni et al., 2015). As such, the necessity for high precision climate predictions for better 48
adaptation and mitigation has arisen. However, the complex characteristics of present and expected future 49
climate changes can be better understood in the context of past climate variability (IPCC, 2014), due to fact 50
that the trends based on short records are very sensitive to the beginning and end dates and do not, in 51
general, reflect long-term climate trends (IPCC, 2014). In this respect, natural archives have become an 52
important tool to supplement the short available instrumental records. Tree rings are widely used in 53
paleoclimatology because of their annual resolution, precise dating, widespread availability on different 54
parts of the globe, and they have the possibility to create chronologies of thousands of years and to explore 55
climate through different proxies such as: tree-ring width, maximum density and/or stable isotopes (Gagen 56
et al., 2004; Brugnoli et al., 2010; Hughes et al., 2011). Overall, the international Tree-Ring Data Bank 57
(ITRDB) contain more than 4000 records, however most of them are based on the tree-ring width, and only 58
few chronologies are based on the maximum density and even less are based on the variations of stable 59
carbon or oxygen isotopes in tree-ring cellulose (NOAA, 2019).
60
The carbon and oxygen stable isotope ratios in tree rings incorporate unique information since they 61
record, through isotopic discrimination, plant-specific physiological processes that include climatic effects.
62
The climatic signals registered by stable isotopes are less dependent on the ecoclimatic settings of the 63
sampled trees when compared with tree-ring width and density proxies (Esper et al., 2018). Stable carbon 64
isotope ratios depend on leaf internal concentrations of CO2, which are influenced by the balance between 65
stomatal conductance and the rate of carboxylation during photosynthesis (Farquhar et al., 1989). In dry 66
environments, the 13C/12C ratio tends to be dominated by stomatal conductance, which is mainly controlled 67
by differences in vapor pressure of the ambient air and the intercellular air spaces within the leaves (Young 68
et al., 2015). In regions without strong moisture stress, the dominant signal recorded by the δ13C values is 69
the fluctuation of photosynthetic rate, which is mainly influenced by solar radiation and the production rate 70
of the photosynthetic enzyme RuBisCo (Hafner et al., 2014). Tree-ring δ18O is primarily affected by the 71
isotopic ratio of source water and, secondly, by evaporation of leaf water via the stomata which leads to 72
increasing δ18O values (Gessler et al., 2014). The isotopic composition of the source water usually mirrors 73
the isotopic composition of precipitation infiltrated into the soil and taken up by the roots (Roden et al., 74
2000), and depends on the atmospheric circulation patterns and local climate. The evaporation intensity of 75
leaf water depends on the stomatal conductance and the vapor pressure deficit, both of which are directly 76
related to relative humidity (McCarroll and Loader, 2004). Stable isotopes in tree-ring cellulose have 77
proven to be a good proxy in areas where tree-ring width (TRW) and maximum latewood density (MXD) 78
are not strongly controlled by a single climate parameter (Hartl-Meier et al., 2015; Young et al., 2015;
79
Nagavciuc et al., 2019). Oxygen isotopic ratios, in general, lack substantial tree-age effects, rendering 80
statistical de-trending unnecessary, thereby preserving the low frequency inherent to the raw data (Rinne et 81
al., 2013; Duffy et al., 2017). In addition, climate signals can be reliably detected in carbon and oxygen 82
isotope chronologies comprising lower numbers of replicates (Gagen et al., 2008; Leavitt, 2010) and slight 83
brown-rot decay wood has only a limited influence on the isotopic composition (Nagavciuc et al., 2018).
84
Stable isotopes in tree rings can thus provide representative, accurate and precise information on past 85
3 climate variability, where other tree rings proxies fail (Kress et al., 2010; Konter et al., 2014; Cernusak and 86
English, 2015; Hartl-Meier et al., 2015).
87
Tree-ring carbon and oxygen isotopes records have already been used to reconstruct various climate 88
parameters including temperature (Treydte et al., 2009; Esper et al., 2015), precipitation (Danis et al., 2006;
89
Rinne et al., 2013; Young et al., 2015), drought (Kress et al., 2010; Xu et al., 2014; Labuhn et al., 2016), 90
relative humidity (Haupt et al., 2011), solar radiation (Young et al., 2010) and cloud cover (Gagen et al., 91
2011), in different parts of the world. There is still a strong contrast between the eastern part of Europe and 92
other regions of the continent because most of the paleoclimatic reconstructions based on tree ring isotopes 93
are distributed from Fennoscandia through western Europe to the Mediterranean region (Treydte et al., 94
2007; Konter et al., 2014; Young et al., 2015; Labuhn et al., 2016). Thus, by filling the eastern-European 95
gap we would provide a better understanding of past climate variability at the continental scale.
96
From a climatological point of view, Romania is located in a strategic position, in the eastern part 97
of Europe where the climatic patterns that strongly influence the Atlantic, Mediterranean and Scandinavian 98
regions have convergent influences. Old-growth forests preserved in the Carpathian mountains (Popa, 99
2016), would allow the construction of very long stable carbon and oxygen isotope chronologies. The high 100
altitude natural forests of the Călimani Mountains, in north-eastern Romania, retain an impressive collection 101
of very old living trees and important deposits of relict wood in excellent states of preservation, covering 102
at least past Millennium (Popa and Kern, 2009).
103
The aim of this study is to explore the climate signal registered by interannual variability of stable 104
carbon and oxygen isotope ratios in the cellulose of Swiss stone pine tree rings (Pinus cembra L.) from 105
Călimani Mountains, Romania. We statistically analyse the relationship between δ13C and δ18O and monthly 106
local climate variables over AD1961-2012, gridded climatic data over a longer period (AD1901-2012), and 107
also compare with large-scale circulation patterns. We discuss the skill of the potential climate 108
reconstructions using established statistical calibration and verification tests in order to highlight which 109
climate parameter is most reliably registered by each isotope.
110 111
2. Methods and materials 112
2.1 Study site 113
The study area is located in the Călimani Mountains, in the eastern Carpathian Arc (Romania) 114
(Figure 1). A detailed site description can be found in the Popa and Kern, (2009), as both studies are done 115
at the same site. The forest is dominated by Swiss stone pine (Pinus Cembra L.) mixed with Norway spruce 116
(Picea abies Karst., L.) which are replaced by mountain pine (Pinus mugo) towards higher elevations. The 117
study site is characterized by a mountain temperate-continental climate, with severe cold winters and cool 118
summers. The mean temperature ranges from -6.5 °C in January to 13.3 °C in July, while the mean annual 119
precipitation amount is 889 mm, with a summer peak in June to July, for 1961 – 2012 period (Figure 1).
120
The geological substrate is composed of the "andesitic arch", represented by the volcanic chain resting on 121
a foundation of shale and Triassic sedimentary formations (Mutihac, 2004). The samples were collected 122
from elevations ranging from 1450 m a.s.l. to 1850 m a.s.l. (treeline) while the current timberline is situated 123
at ~1700 m a.s.l. (Kern and Popa, 2008). Human influence in the study area was limited after 1975 due to 124
the establishment of a Natural Reserve with a high degree of protection. However, a sulfur extraction 125
occurred near to the study site between 1965-1992, with most intense activity during the 1974 – 1986 period 126
4 (Brânduș and Cristea, 2004) leaving clear signals also in the sulfur concentrations of the wood (Kern et al., 127
2009).
128 129
2.2 Sample collection, preparation and stable isotope measurements 130
Four living trees (labeled Trees 1 to 4) were cored in autumn 2012, using an 11mm Pressler 131
increment borer. Tree ring width (TRW) was measured using LINTAB equipment and TSAP 0.53 software, 132
with 0.001 mm accuracy. TRW was cross-dated against the local master chronology (Popa and Kern 2009) 133
and checked for missing rings with COFECHA software (Holmes, 1983). The stable isotope analyses were 134
performed for the 1876-2012 period (Table S1). The tree rings were separated with a scalpel ring by ring, 135
and were not pooled prior to the measurements. After that, the α-cellulose was extracted using the modified 136
Jayme-Wise method (Loader et al., 1997; Boettger et al., 2007), homogenized by a standard ultrasonic 137
protocol (Laumer et al., 2009) using VCX130 (Sonics & Materials Inc/USA) device, and dried at 70 °C for 138
24 hours.
139
After being encapsulated in silver, 0.2 mg (±10 %) of α-cellulose was pyrolized over glassy 140
carbon at 1450 °C and simultaneous measurements of oxygen and carbon isotope ratios (δ13C and δ18O) 141
were performed (Leuenberger and Filot, 2007; Loader and Waterhouse, 2014) using a ThermoQuest TCEA 142
interfaced with a Thermo Delta V Advantage IRMS. The isotopic ratios are reported in per mil (‰) relative 143
to the Vienna Standard Mean Ocean Water (VSMOW) for oxygen, and Vienna Pee Dee Belemnite (VPDB) 144
for carbon (Coplen, 1994), respectively, using the traditional δ (delta) notation. The analytical precision of 145
the measurements was better than 0.2 ‰ for both oxygen and carbon. All samples were measured in 146
triplicates; if their standard deviation exceeded 0.2‰, two additional measurements were performed. If one 147
of the five delta vaules was further from the mean of the other four values than their 2 standard deviation 148
that value was considered as outlier and was omitted. The final δ13C and δ18O values were calculated as the 149
arithmetic mean of the multiple measurements.
150 151
2.3 Correction for non-climatic factors and construction of the dendroisotope chronologies 152
The raw carbon isotopic ratios need to be corrected for changes in carbon isotope composition and 153
concentration of atmospheric CO2 due to anthropogenic coal and hydrocarbon combustion from the start of 154
the industrial revolution because these anthtropogenic effects can heavily overprint the climate signals 155
(McCarroll and Loader, 2004; Treydte et al., 2009). To remove the long-term depletion in 13C of the 156
atmospheric CO2, the so-called Suess effect (Keeling, 1979), we applied the correction scheme established 157
for the northern hemispheric variations in atmospheric CO2 isotopic composition based on a compilation of 158
the δ13C values of CO2(δ13Catm) derived from air inclusions in ice cores (Leuenberger, 2007). Even after 159
the δ13Catm correction, the resulting chronology is still influenced by the increasing values of pCO2 above 160
the pre-industrial level, causing the amount of carbon isotopic fractionation per unit ppm to decrease. This 161
effect was removed following the procedure described by Schubert and Jahren, (2012) (Figure S1).
162
Several studies have shown that the increase of δ13C and δ18O values in the juvenile years of tree 163
growth is dependent on the species and the individual tree location (Gagen et al., 2008; Leavitt, 2010; Daux 164
et al., 2011; Xu et al., 2017). The duration of these juvenile trends vary from short periods or non-existent 165
trends (Daux et al., 2011; Kilroy et al., 2016; Duffy et al., 2017) up to 50 years or more than 80 years 166
(Leavitt, 2010). In case of δ13C, for instance, it can be explained by the fact that young trees, growing close 167
to forest floor or below the canopy, reuse the respired air from the old surrounding trees, which is already 168
5 depleted in 13C (Treydte et al., 2009). In order to examine the juvenile trends of δ13C and δ18O ratios in tree- 169
ring cellulose, the Trees 1, 2 and 3 were aligned by cambial age and the corresponding anomalies were 170
calculated (Figure S2 and S3). Tree 4 was not taken into account because the first 198 years from the pith 171
were not analyzed yet and the remaining data falls outside the juvenile lifespan.
172
The negative exponential curve (neg) detrending method was applied using the ARSTAN software 173
(Cook and Peters, 1981; Cook, 1985;). The final δ13Cres chronology was developed by: 1) inverting the δ13C 174
(corrected for changes in carbon isotope composition and concentration of atmospheric CO2) by multiplying 175
the individual series with (-1), in order to have positive values and 2) by removing the δ13C age trend by 176
calculation of residual values from a negative exponential function (Esper et al., 2015); and 3) calculation 177
of the robust means of the detrended δ13C series, 4) inverting the resulting δ13C chronology by multiplying 178
with (-1) in order to have the original trend of chronology, which was used further for climate correlations.
179
The robustness of the obtained mean chronology was assessed by Expressed Population Signal 180
(EPS) and the inter-series correlation (Rbar). EPS is a measure of how well the available finite sample of 181
tree-ring data represents an infinite population chronology (Wigley et al., 1984; Buras, 2017). EPS and 182
Rbar values were calculated for detrended δ13C series and for raw δ18O series for the 1876 – 2012 period, 183
with a running window of 50 years with an overlap of 25 years.
184 185
2.4 Climate data and statistical methods 186
The linear relationship between the tree-ring δ13Cres and δ18O records and cloud cover (CLD), 187
precipitation amount (PP), relative humidity (RH), mean, maximum and minimum temperature (Tm, Tx, 188
and Tn) were analyzed using ROCADA gridded data for the nearest grid point to the study site (Dumitrescu 189
and Birsan, 2015) with a resolution of 0.1° x 0.1° for the period 1961–2012. Given that the plant 190
physiological processes regulating the isotopic fractionation are sensitive to precipitation and temperature, 191
we also tested the relationship with the drought index as it integrates these two parameters (Bégin et al., 192
2015). For this, we analyzed the relationship with a climate index (CI) as well as with the Standardized 193
Precipitation-Evapotranspiration Index (SPEI). The CI index is computed by subtracting the standardized 194
temperature from the standardized precipitation. Thus, negative values of CI indicate dry and/or warm 195
conditions, whereas positive values of CI indicate wet and/or cold conditions. To calculate the Standardized 196
Precipitation-Evapotranspiration Index (SPEI) we used monthly precipitation totals, 2 m surface air 197
temperature means and potential evapotranspiration. Since the study site is not known to exhibit long-term 198
dry spells, we focus on short-term drought and wetness variability, by calculating SPEI for 3 months of 199
accumulation period (SPEI3 from now on) (Beguería et al., 2014).
200
To have a longer term perspective of the relationship between the tree-ring parameters and climate 201
variables, the PP and CLD over the closest grid points near the study site were obtained from the monthly 202
CRU T.S. 4.01 dataset for the 1901–2012 CE period (Harris et al., 2014), with a spatial resolution of 0.5°
203
× 0.5°. Also, CI and SPEI3 indices were calculated basis on data from the CRU T.S. 4.01 climate dataset.
204
To investigate the link with the large-scale atmospheric circulation patterns we used the seasonal 205
means of Geopotential Height at 500 milibar (mb) (Z500), zonal wind (U500) and meridional wind (V500) 206
at 500 mb from the Twentieth Century Reanalysis (V2) data set (Whitaker et al. 2004; Compo et al. 2006, 207
2011) on a 2° × 2° grid, over the 1876 – 2012 CE period. For sea surface temperature (SST) we used the 1°
208
× 1° Hadley Centre Sea Ice and Sea Surface Temperature data set—HadISST (Rayner et al., 2003). These 209
data sets have a global coverage.
210
6 Linear correlations between δ13Cres and δ18O values and monthly or seasonal climate parameters 211
along with their associated 95% bootstrap confidence intervals were calculated using the treeclim package 212
(Zang and Biondi, 2015) in the R environment (R Development Core Team, 2014). To identify connections 213
with the large-scale atmospheric circulation and the North Atlantic Ocean SST, we constructed the 214
composite maps of Z500 and SST standardized anomalies for the summer season by selecting the years 215
when the value of the normalized dendroisotope time series was >1 standard deviation (High) and <−1 216
standard deviation (Low), respectively. This threshold was chosen as a compromise between the strength 217
of the climate anomalies associated with δ13Cres (δ18O, respectively) anomalies and the number of maps that 218
satisfy this criterion. Further analysis has shown that the results are not sensitive to the exact threshold value 219
used for the composite analysis (not shown). The significance of the composite maps is based on a standard 220
t-test (confidence level 95 %).
221
The calibration and verification model was analyzed using the R packages dplR (Bunn, 2008) and 222
treeclim (Zang and Biondi, 2015). Three statistical tests were performed to evaluate the strength of the 223
calibration model: the Reduction of Error (RE), the Coefficient of Efficiency (CE) and the Durbin-Watson 224
Test (DW), in the split window approach (Cook et al., 1994). The calibration/verification model with 225
meteorological data was performed by splitting in forward and reverse periods. For the short local climate 226
data, a calibration length of 75% of the chronology was used, and for the longer gridded data 50%.
227 228
2.5 Stability maps 229
To test the stability of the relationship between the dendroisotope records and climate variables we 230
make use of stability maps, a methodology successfully used in the seasonal forecast of the European rivers 231
and Antarctic sea ice to examine the stationarity of the long-term relationship between our proxies and the 232
gridded climate data (Ionita et al., 2008, 2014, 2018). In order to detect stable predictors, the variability of 233
the correlation between the tree-ring parameters and the gridded data is investigated within a 31-year 234
moving window over the 1901 – 2012 period. The correlation is considered stable for those regions where 235
the tree-ring parameter and the gridded data are significantly correlated at the 90% or 80% level for more 236
than 80% of the moving window. A detailed description of the methodology is given by Ionita (2017). The 237
basic idea of this methodology is to identify regions with stable correlations (meaning the correlation does 238
not change over time) between δ13Cres, δ18O and gridded data (e.g. PP, CI and SPEI3) with different time 239
lags.
240 241
3. Results and discussion 242
3.1 Characteristics of the carbon and oxygen isotope chronologies 243
The mean of the combined chronology of δ13C raw values is -22.3‰ and the data vary between - 244
23.5 ‰ and -20.9 ‰. Lag 1 and Lag 2 autocorrelations of the δ13C data are high (r=0.78 and r=0.68). Such 245
a high autocorrelation can be explained by the accentuated trend of the chronology. A high autocorrelation 246
can be expected as the trees store the glucose assimilated in the late autumn and winter, and use it in the 247
next spring when a new ring starts growing (Pallardy, 2008; Kimak and Leuenberger, 2015).
248
The detrended data of trees 1, 2 and 3 which have similar ages (around 130 years), show a negative 249
slope of approximately 1.5 – 2 ‰, while Tree 4 (representing >300 years cambial age) does not show any 250
trend for the analyzed period, indirectly supporting the absence of age-related trends in δ13C data with a 251
cambial age of 100 years and older (Gagen et al., 2008). The inter-series correlation (Rbar = 0.45) and 252
7 Expressed Population Signal (EPS = 0.75) reveal an acceptable internal coherence but low confidence of 253
the site chronology.
254
The δ18O values of the combined chronology vary around the mean of 29.3‰, ranging from 27.6‰
255
to 31.5‰. The δ18O chronology is characterized by low autocorrelation (r = 0.28 and r = 0.05 on the Lag 1 256
and Lag 2, respectively), which indicates that previous year conditions do not have a strong effect on oxygen 257
isotopic variability in tree-ring cellulose, indicating that the source water originates mainly from the current 258
season rainfall (McCarroll and Loader, 2004). The δ18O series show no juvenile effects or common 259
increasing or decreasing trends in the first 140 years of tree age (Figure 2b and Figure S3). Therefore, we 260
conclude that δ18O values from Swiss Stone pine tree-ring cellulose from Calimani Mts can be used for 261
dendroclimatological studies without any detrending procedure. The mean inter-series correlation (Rbar = 262
0.77) and Expressed Population Signal (EPS = 0.92) demonstrate the robustness of the δ18O chronology 263
and indicate that the δ18O values display a high amount of shared variance originating from a common 264
controlling factor related to climatic conditions.
265
3.2 δ13C and δ18O climate response on local scale 266
Detrended carbon isotopic data from Călimani Mts correlate significantly with June to August (JJA) 267
precipitation (r = -0.49, p < 0.05), with March and April RH (r = 0.43 and r = 0.45, respectively, p < 0.05) 268
and with July and August SPEI3 (r = -0.45 and r=-0.52, respectively, p < 0.05) (Table 1). No significant 269
correlation was found between δ13Cres and temperature (Table 1). The sampled trees are located at high 270
elevation, where a thick layer of snow cover accumulates during the winter. The resulting water from 271
snowmelt, starting in March-April, infiltrates in the highly permeable soil, which allows the retention of 272
soil water. Thus, the derived spring soil moisture content together with summer precipitation amounts 273
become the most important factors which controlling the carbon isotopic composition in tree-ring cellulose 274
(McCarroll and Loader, 2004). The RH in spring is related to high precipitation and snowmelt, which 275
contribute to supplement the soil moisture and water aquifers. When tree rings start to grow, water 276
availability in soil and high RH leads to high stomatal conductance, leading to low δ13C values because of 277
strong 13C discrimination (McCarroll and Loader, 2004; Loader et al., 2008).
278
However, the split-period calibration model shows very poor statistical reconstruction skills (Table 279
S2 and S3). This, as well as the relatively low signal-strength statistics of the mean chronology (see section 280
3.1) underlines that a robust and reliable reconstruction is still not achieveable based on carbon isotopes in 281
Călimani Mountains. These results might be hindered by the low replication (four trees). Nevertheless, by 282
using more replicates a robust and reliable reconstruction might be achievable.
283
The stable oxygen isotope chronology shows a high correlation with the local climate parameters 284
during the summer months (June, July and August) (Table 2) which is also in agreement with the commonly 285
reported signal in European tree sites (Treydte et al., 2007; Saurer et al., 2008; Hartl-Meier et al., 2015).
286
The δ18O values are negatively correlated with the precipitation (r = -0.55, p < 0.05), CLD (r = -0.67, p <
287
0.05), RH (r = -0.64, p < 0.05) and CI (r = -0.69, p < 0.05); and positively correlated with the Tx (r = 0.60) 288
in JJA (Table 2). The high correlation with CLD and RH can be related to the high correlation between 289
these two climatic parameters (r= 0.75, p < 0.05). Relative humidity has a direct effect on leaf transpiration 290
rate and stomatal conductance through the ratio of vapor pressure inside to that outside of the leaf 291
(McCarroll and Loader, 2004). The low RH determines an increase of leaf transpiration rates, causing a 292
high intensity of stomatal conductance. Thereby, evaporation through the open stomata enriches the isotopic 293
composition of leaf water which is transferred to photosynthate (sucrose) and effectively transferred to tree- 294
8 ring cellulose (Gessler et al., 2014). A similar direct link between cloud cover and stable isotopes in plant 295
water is not known so, despite the slightly lower correlation coefficient, RH is considered as the actually 296
most influential environmental parameter regulating interannual δ18O variability of cellulose in stone pine 297
tree rings in the Calimani Mts.
298 299
3.3 Asymmetric signal in high and low extreme proxy years 300
The comparison between extreme values of δ13Cres and δ18O and the seasonal cycle for precipitation 301
and relative humidity for the instrumental period 1961 – 2012 shows interesting patterns. Years recording 302
the highest (> 1 standard deviation) and lowest (< -1 standard deviation) values for δ13Cres (Figure 3a) and 303
δ18O (Figure 3b) were selected and used to calculate the seasonal cycle in precipitation (Figure 3c and 3d) 304
and relative humidity (Figure 3e and 3f). Extreme low values of δ13C and δ18O are connected to wetter 305
conditions than average from May until August (Figure 3c and 3d). In contrast, drier conditions are detected 306
in June – August in association with high δ13C and in May – August in association with high δ18O values.
307
In the case of RH, the differences in the seasonal cycle are not so obvious for extreme δ13Cres, whereas for 308
extreme δ18O years, there is a clear and distinct seasonal cycle (Figure 3e and 3f). More humid conditions 309
than average, are detected from June to September associated with extreme low values of δ18O, while less 310
humid conditions than average are detected from April to September accompanied by high values of δ18O.
311
The differences in the seasonal cycle of precipitation are captured more clearly by δ13Cres extreme years 312
compared to δ18O. Based on these relationships we can argue that the seasonal distribution of precipitation 313
amount acts as a limiting factor for δ13Cres extreme values, whereas the seasonal cycle of RH acts to strongly 314
influence the δ18O extreme values, especially in the case of high δ18O. The seasonal cycle analysis indicates 315
that months with deviations from average climatic conditions differ between the years characterized by low 316
or high values in the proxy data, especially in the case of RH for extreme δ18O years.
317 318
3.4 Spatial correlation with climate data 319
Several studies have detected a loss of climate sensitivity in ring-width (Jacoby et al., 2000; Esper 320
et al., 2010) and density (Briffa et al., 2004) chronologies, especially at high latitudes, as well as for several 321
species at the upper treeline in the European Alps (Carrer and Urbinati, 2006; Leonelli et al., 2009).
322
Ocassionally, unstable correlations have been found also for stable isotopes (Treydte et al., 2007; Bale et 323
al., 2010). In this respect, a stable relationship over time between tree-ring proxies and climate variables is 324
crucial for climate reconstructions. In order to test the strength of the relationship between our proxy data 325
and gridded data, at European level, we have applied a methodology, the so-called stability maps, 326
successfully used for the monthly and seasonal prediction of streamflow for central European Rivers (Ionita 327
et al., 2012, 2014).
328
The stability map between δ13Cres and PP and SPEI3 (Figures S4 and S5), shows no stable and 329
significant correlations are found over the period 1902 – 2012, at European level, although for the period 330
1961 – 2012 significant correlations with local data have been found between δ13Cres and PP and SPEI3 for 331
summer months (Table 1). This indicates that the relationship between the available δ13Cres data and the 332
climate drivers is non-stationary in time. A higher replication might help to improve the potential climate 333
signal and make the stable carbon isotope dataset of Calimani Stone pine tree rings suitable for 334
paleoclimatological purposes.
335
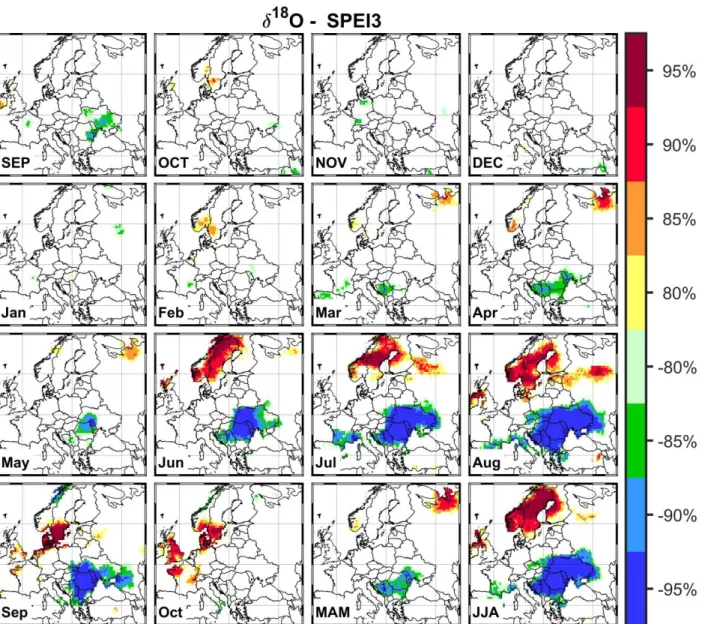
9 For δ18O we have computed the stability maps with the gridded data for CI and SPEI3. The stability 336
map between δ18O and SPEI3 (Figure 4), with different time lags, indicates that stable and significant 337
correlations persist from June until September. Significant, stable and negative correlations are observed 338
over the eastern part of Europe (e.g. Romania, Serbia, Bulgaria and Ukraine), while significant, stable and 339
positive correlations are observed over Fennoscandia (e.g. Norway, Sweden and the western part of 340
Finland). This dipole-like structure (opposite correlations over Fennoscandia and the eastern part of Europe) 341
in the spatial correlation with SPEI3 gridded data, is a common feature of drought occurrence at European 342
level (Ionita, 2015). The spatial extent of the correlation is largest for August SPEI3. The stability maps 343
between δ18O and CI (Figure 5) shows that stable and significant correlations are observed throughout the 344
summer months (June to August) and the spatial extent of the correlations is also characterized by a dipole- 345
like structure, similar to the one obtained for SPEI3. The largest spatial extent of the stable correlations is 346
found when CI is averaged throughout the summer months (JJA). Based on the results obtained from the 347
stability maps, we can argue that δ18O values of the Calimani stone pine isotope record reveal both local as 348
well as European scale climate variability. Overall, during summer, high δ18O values are associated with 349
dry conditions and positive temperature anomalies over the central, southeast and eastern Europe, while 350
low δ18O values are associated with negative temperature anomalies and wet summers over the eastern part 351
of Europe (Figure 4 and Figure 5). The dry and warm climatic conditions determine the increase of 352
ambient/intercellular vapor pressure gradient, causing enrichment of 18O in the leaf water which is them 353
transferred to the tree ring cellulose (Roden et al., 2000; McCarroll and Loader, 2004).
354
Based on the results from the stability maps (Figure 4 and Figure 5), we have defined two indices, 355
one for August SPEI3 and one for JJA CI, by averaging the gridded data sets over the region (22°E - 30°E, 356
45°N - 50°N) for August SPEI3 and over the region (23°E - 30°E, 43.5°N - 50°N) for JJA CI. We choose 357
these particular regions, because significant and stable correlations are found over these two areas and they 358
are located in the vicinity of our studied forest. In order to verify the reconstruction skill for these two 359
indices, the calibration-verification model was performed for both SPEI3 and CI (Figure 6a and 6b). The 360
positive and significant values for SPEI3 (CI) of RE = 0.58 (0.59), CE = 0.54 (0.58), and the significant 361
correlation coefficients indicate that the regression model provides predictive skill for reconstruction (Cook 362
et al., 1994) while the Durbin-Watson statistics (2.28 for SPEI3, 1.80 for CI) do not suggest any linear trend 363
in the model residuals (Table S4 – SPEI3 and Table S5 – CI). This temporally stable relationship between 364
δ18O and SPEI3 (CI) was also tested by applying the stability maps methodology (Figure 4 and Figure 5).
365
Overall, the best verification result was obtained for CI (Table S5), indicating the robustness of the 366
regression model. This shows that the CI model based on δ18O is significantly related to the actual variation 367
of dry - warm/wet - cold climatic conditions over the eastern part of Europe, including the study area.
368
The seasonal cycle of August SPEI3 (CI) (Figure 6c (6d)) associated with extreme values of δ18O 369
(Table S6, Figure 3) over the period 1902 – 2012 show that wetter conditions than average are detected 370
from March until September by extreme low values of δ18O (Figu67re 6c), whereas drier conditions are 371
recorded from January to September for extreme high values of δ18O (Figure 6c). The highest differences 372
in the amplitude of the seasonal cycle of SPEI3 are recorded from June to August. Combined wetter and 373
colder conditions than average are observed from May until August for the years characterized by low 374
values of δ18O (Figure 6d), whereas drier and warmer conditions than average are observed from January 375
until August for extreme high δ18O values (Figure 6d). The seasonal cycle analysis indicates that there is a 376
clear change in the absolute values of the analyzed variables (SPEI3 and CI) through the year for extreme 377
10 δ18O values. For example, the value of CI in June and July for extreme low years is more than double 378
compared to the ones recorded during years with extreme high δ18O values. This verifies that the δ18O in 379
tree rings is able to properly capture the occurrence of extreme summers in terms of SPEI3 and CI.
380 381
3.5 Large-scale atmospheric circulation 382
To investigate the relationship between the inter-annual variability of δ18O values in tree rings from 383
Calimani Mts. and large-scale atmospheric circulation composite maps of the geopotential height at 500mb 384
(Z500) and SST for high (> 1 standard deviation) and low (< -1 standard deviation) δ18O values for the 385
summer months (JJA) were generated (Figure 7). Because, δ18O records from Swiss stone pine reflects very 386
well the drought conditions at European scale, it is fair to argue that δ18O can partially reflect also the 387
prevailing large-scale circulation (e.g. Rossby waves, atmospheric blocking) and the variability of the North 388
Atlantic Ocean SST (Ionita et al., 2012, 2017; Schubert et al., 2014; Kingston et al., 2015; Spinoni et al., 389
2015). High values of δ18O are associated with a high-pressure system over southern and central Europe 390
and the Mediterranean Sea, and with a low-pressure over the northern Atlantic Ocean, northern Europe and 391
Russia, which are linked to Rossby-wave oscillations (Ionita et al., 2012, 2017; Van Lanen et al., 2016) 392
(Figure 7a). This pattern favors the advection of dry and warm air from the northern part of Africa towards 393
the south-eastern part of Europe (including the study site). In contrast to this, low values of δ18O are 394
associated with a low-pressure center over central and eastern part of Europe and a high-pressure system 395
over the northern Atlantic Ocean, Western and northern Europe (Figure 7b). The negative Z500 anomalies 396
centred over the central and eastern part of Europe are consistent with enhanced precipitation over this 397
region and the advection of moist air from the Mediterranean region towards Romania (the wind vectors in 398
Figure 7b). A similar large-scale pattern has been found to be associated with enhanced summer 399
precipitation and high streamflow anolmalies over Romania, including our study region (Ionita et al., 2015).
400
Throughout the summer period, the high-pressure centers are associated with anticyclonic circulation, 401
which generates heat waves and droughts, while the low-pressure centers are associated with cyclonic 402
circulation thus generates wet summers (Ionita et al., 2012).
403
Significant and stationary spatial correlations were found between δ18O and CI and SPEI3 at 404
European level (Figure 4 and Figure 5). In Figure 7c and Figure 7d, we further examined the relationship 405
between δ18O and oceanic conditions, because the occurrence of droughts and heat waves over the European 406
region is significantly affected by adjacent oceanic condition on yearly to decadal time scales (Cassou et 407
al., 2005; Della-Marta et al., 2007; Schubert et al., 2014; Ionita et al., 2017). The role of the North Atlantic 408
Ocean and Mediterranean Sea SST in triggering extreme drought at European level has been demonstrated 409
by previous studies (Feudale and Shukla, 2011; Ionita et al., 2012, 2017; Kingston et al., 2013; Ionita, 410
2015). Following this line, significant correlations between δ18O values and North Atlantic Ocean SST 411
indicate possible connections between the moisture availability over the eastern part of Europe and remote 412
ocean areas. The high δ18O values correspond to the positive SST anomalies over the Mediterranean Sea 413
and the northern Atlantic Ocean and negative SST anomalies over the southern Atlantic Ocean (Figure 7c).
414
In contrast, the low δ18O values correspond to negative SST anomalies over the Mediterranean Sea and the 415
Black Sea and positive SST anomalies over the Atlantic Ocean (Figure 7d). Overall, the structure of the 416
SST anomalies in Figure 7 resembles the SST anomalies responsible for the occurrence of extreme drought 417
events over the southern and eastern part of Europe (e.g. 2003, 2015) (Van Lanen et al., 2016; Ionita et al., 418
2017). In a recent paper, Ionita et al., (2017) have shown that warm Mediterranean SSTs have preceded and 419
11 occurred concurrently with dry summers over most of the central and eastern part of Europe. Moreover, the 420
SST anomalies associated with high/low values of δ18O over our analyzed region are similar to the SST 421
anomalies associated with δ18O extreme values recorded by latewood cellulose of oak (Quercus robur L.) 422
trees growing in the NW part of Romania (Nagavciuc et al., 2019).
423 424
4. Conclusions and perspectives 425
Although tree-ring based carbon and oxygen isotope records have been extensively used to 426
reconstruct various climate paramaters at European scale (Treydte et al., 2009; Esper et al., 2015; Kress et 427
al., 2010), currently there is a lack of such studies over the eastern part of Europe, including Romania. Thus, 428
in this study we have analyzed the climate signal registered by stable carbon and oxygen isotopes ratios in 429
the cellulose of Swiss stone pine tree rings from Calimani Mountains, Romania. Stable oxygen isotope ratio 430
in Swiss stone pine tree ring cellulose from Calimani Mountains represents a better indicator for 431
dendroclimatological application than the stable carbon isotope ratio. The correlation of all climatic 432
parameters is higher and temporally more stable with δ18O than with δ13C. The poor statistical skill for 433
carbon as a proxy for paleoclimate reconstructions as well as the relatively low signal-strength statistics of 434
the mean carbon chronology underlines that reliable reconstruction is still not achievable based on carbon 435
isotopes in Călimani Mountains. These results might be hindered by the low replication (four trees).
436
Nevertheless, by using more replicates a robust and reliable reconstruction might be achievable.
437
For δ18O values, the calibration and verification results demonstrate that δ18O is correlated with 438
local summer relative humidity, cloud cover, maximum temperature, as well as the drought conditions at a 439
European scale. The highest correlation coefficients and best statistical skills were obtained for δ18O values 440
and relative humidity at local scale, and δ18O and SPEI3 and CI at European scale. As such, this calibration 441
could be used to provide a long record of summer drought conditions over the eastern part of Europe.
442
At interannual time-scales, the variability of δ18O reflects changes in the large-scale atmospheric 443
circulation and the sea surface temperature from the North Atlantic Ocean and the Mediterranean Sea. High 444
values of δ18O are associated with an extended atmospheric blocking over the central and eastern part of 445
Europe and a warm Mediterranean Sea and a cold central Atlantic Ocean. This kind of prevailing large- 446
scale atmospheric circulation (e.g. anticyclone over the central and eastern part of Europe and cold central 447
north Atlantic Ocean and warm Mediterranean Sea) is usually associated with extreme droughts and 448
heatwaves over the central and eastern part of Europe (Van Lanen et al., 2016; Ionita et al., 2017).
449
Stable oxygen isotope composition of Swiss stone pine tree ring cellulose from northeastern 450
Romania represents a great potential for long paleoclimatic reconstructions. Such records offer the 451
opportunity to reconstruct both regional drought and large-scale circulation variability over southern and 452
central Europe and allows us to fill the gap, over the eastern part of Europe, in order to be able to better 453
understand past climatic variability at continental scale.
454 455
Acknowledgements 456
The research leading to these results has received funding from EEA Financial Mechanism 2009 - 2014 457
under the project contract no CLIMFOR18SEE. PI was supported partial by the project number PN-III-P4- 458
ID-PCE-2016-0253. VN was supported partial by German Federal Environmental Foundation (DBU). MI 459
was funded by the Helmholtz Climate Initiative - REKLIM.
460 461
12 462
References 463
Bale RJ, Robertson I, Leavitt SW, Loader NJ, Harlan TP, Gagen M, Young GHF, Csank AZ, Froyd CA, 464
McCarroll D. 2010. Temporal stability in bristlecone pine tree-ring stable oxygen isotope 465
chronologies over the last two centuries. Holocene, 20(1): 3–6.
466
https://doi.org/http://dx.doi.org/10.1177/0959683609348867.
467
Bégin C, Gingras M, Savard MM, Marion J, Nicault A, Bégin Y. 2015. Assessing tree-ring carbon and 468
oxygen stable isotopes for climate reconstruction in the Canadian northeastern boreal forest.
469
Palaeogeography, Palaeoclimatology, Palaeoecology. Elsevier B.V., 423: 91–101.
470
https://doi.org/10.1016/j.palaeo.2015.01.021.
471
Beguería S, Vicente-Serrano SM, Reig F, Latorre B. 2014. Standardized precipitation evapotranspiration 472
index (SPEI) revisited: Parameter fitting, evapotranspiration models, tools, datasets and drought 473
monitoring. International Journal of Climatology, 34(10): 3001–3023.
474
https://doi.org/10.1002/joc.3887.
475
Boettger T, Haupt M, Knller K, Weise SM, Waterhouse JS, Rinne T, Loader NJ, Sonninen E, Jungner H, 476
Masson-delmotte V, Guillemin M, Pierre M, Pazdur A, Leuenberger M, Filot M, Saurer M, Reynolds 477
CE, Helle G, Schleser GH, Boettger T, Haupt M, Kno K, Weise SM, Waterhouse JS, Rinne KT, 478
Loader NJ, Sonninen E, Jungner H, Masson-delmotte V, Stievenard M, Pierre M, Pazdur A, 479
Leuenberger M, Filot M, Saurer M, Reynolds CE, Helle G, Schleser GH. 2007. Wood Cellulose 480
Preparation Methods and Mass Spectrometric Analyses of δ13C, δ18O, and Nonexchangeable δ2H 481
Values in Cellulose, Sugar, and Starch: An Interlaboratory Comparison. Analytical Chemistry, 482
79(12): 4603–4612. https://doi.org/10.1021/ac0700023.
483
Brânduș C, Cristea I. 2004. Anthropic impact in the Călimani’s caldera. Analele Universității de Vest din 484
Timișoara, Geografie, XIV: 159–168.
485
Briffa KR, Osborn TJ, Schweingrubber F-H. 2004. Large-scale temperature inferences from tree rings: a 486
review. Global and Planetary Change, 40: 11–26.
487
Brugnoli E, Solomina O, Spaccino L, Dolgova E. 2010. Climate signal in the ring width, density and carbon 488
stable isotopes in pine (Pinus Silvestris L.) in central Caucasus. GEOGRAPHY, ENVIRONMENT, 489
SUSTAINABILITY, 3(4): 4–16. https://doi.org/https://doi.org/10.24057/2071-9388-2010-3-4-4-16.
490
Bunn AG. 2008. A dendrochronology program library in R (dplR). Dendrochronologia, 26(2): 115–124.
491
https://doi.org/http://dx.doi.org/10.1016/j.dendro.2008.01.002.
492
Buras A. 2017. A comment on the expressed population signal. Dendrochronologia, 44: 130–132.
493
https://doi.org/doi: 10.1016/j.dendro.2017.03.005.
494
Carrer M, Urbinati C. 2006. Long-term change in the sensitivity of tree-ring growth to climate forcing in 495
Larix decidua. New Phytologist, 170: 861–872. https://doi.org/10.1111/j.1469-8137.2006.01703.x.
496
Cassou C, Terray L, Phillips AS. 2005. Tropical Atlantic influence on European heat waves. Journal of 497
Climate, 18(15): 2805–2811. https://doi.org/10.1175/JCLI3506.1.
498
Cernusak LA, English NB. 2015. Beyond tree-ring widths: Stable isotopes sharpen the focus on climate 499
responses of temperate forest trees. Tree Physiology, 35(1): 1–3.
500
https://doi.org/10.1093/treephys/tpu115.
501
Compo GP, Whitaker JS, Sardeshmukh PD. 2006. Feasibility of a 100-year reanalysis using only surface 502
pressure data. Bulletin of the American Meteorological Society, 87(2): 175–190.
503
13 https://doi.org/10.1175/BAMS-87-2-175.
504
Compo GP, Whitaker JS, Sardeshmukh PD, Matsui N, Allan RJ, Yin X, Gleason BE, Vose RS, Rutledge 505
G, Bessemoulin P, BroNnimann S, Brunet M, Crouthamel RI, Grant AN, Groisman PY, Jones PD, 506
Kruk MC, Kruger AC, Marshall GJ, Maugeri M, Mok HY, Nordli O, Ross TF, Trigo RM, Wang XL, 507
Woodruff SD, Worley SJ. 2011. The Twentieth Century Reanalysis Project. Quarterly Journal of the 508
Royal Meteorological Society, 137(654): 1–28. https://doi.org/10.1002/qj.776.
509
Cook E-R, Peters K. 1981. The smoothing spline: a new approuch to standardizing forest interior tree-ring 510
width series for dendroclimatic studies. Tree-ring bulletin, 41: 45–55.
511
Cook E., Briffa K, Jones PD. 1994. Spatial regression methods in dendroclimatology: a review and 512
comparison of two techniques. International Journal of Climatology.
513
https://doi.org/10.1002/joc.3370140404.
514
Cook ER. 1985. A time series analysis approach to treering standard-ization. Univ. of Arizona, Tucson, 515
AZ, USA.
516
Coplen TB. 1994. Reporting of stable hydrogen, carbon, and oxygen isotopic abundances. Pure and Applied 517
Chemistry, 66: 273–276. https://doi.org/10.1351/pac199466020273.
518
Danis PA, Masson-Delmotte V, Stievenard M, Guillemin MT, Daux V, Naveau P, von Grafenstein U. 2006.
519
Reconstruction of past precipitation δ18O using tree-ring cellulose δ18O and δ13C: A calibration 520
study near Lac d’Annecy, France. Earth and Planetary Science Letters, 243(3–4): 439–448.
521
https://doi.org/10.1016/j.epsl.2006.01.023.
522
Dansgaard W. 1964. Stable isotopes in precipitation. Tellus, 4: 436–468.
523
https://doi.org/10.3402/tellusa.v16i4.8993.
524
Daux V, Edouard JL, Masson-Delmotte V, Stievenard M, Hoffmann G, Pierre M, Mestre O, Danis PA, 525
Guibal F. 2011. Can climate variations be inferred from tree-ring parameters and stable isotopes from 526
Larix decidua? Juvenile effects, budmoth outbreaks, and divergence issue. Earth and Planetary 527
Science Letters. Elsevier B.V., 309(3–4): 221–233. https://doi.org/10.1016/j.epsl.2011.07.003.
528
Della-Marta PM, Haylock MR, Luterbacher J, Wanner H. 2007. Doubled length of western European 529
summer heat waves since 1880. Journal of Geophysical Research Atmospheres, 112(15): 1–11.
530
https://doi.org/10.1029/2007JD008510.
531
Duffy JE, McCarroll D, Barnes A, Bronk Ramsey C, Davies D, Loader NJ, Miles D, Young GHF. 2017.
532
Short-lived juvenile effects observed in stable carbon and oxygen isotopes of UK oak trees and 533
historic building timbers. Chemical Geology, 472: 1–7.
534
https://doi.org/10.1016/j.chemgeo.2017.09.007.
535
Dumitrescu A, Birsan M. 2015. ROCADA: a gridded daily climatic dataset over Romania (1961 – 2013) 536
for nine meteorological variables. Natural Hazards. Springer Netherlands, 78: 1045–1063.
537
https://doi.org/10.1007/s11069-015-1757-z.
538
Esper J, Frank D, Büntgen U, Verstege A, Hantemirov R, Kirdyanov A V. 2010. Trends and uncertainties 539
in Siberian indicators of 20th century warming. Global Change Biology, 16(1): 386–398.
540
https://doi.org/10.1111/j.1365-2486.2009.01913.x.
541
Esper J, Holzkämper S, Büntgen U, Schöne B, Keppler F, Hartl C, George SS, Riechelmann DFC, Treydte 542
K. 2018. Site-specific climatic signals in stable isotope records from Swedish pine forests. Trees - 543
Structure and Function. Springer Berlin Heidelberg, 32(3): 855–869.
544
https://doi.org/10.1007/s00468-018-1678-z.
545
14 Esper J, Konter O, Krusic PJ, Saurer M, Holzkämper S, Büntgen U. 2015. Long-term summer temperature 546
variations in the Pyrenees from detrended stable carbon isotopes. Geochronometria, 42(1): 53–59.
547
https://doi.org/10.1515/geochr-2015-0006.
548
Farquhar GD, Ehleringer JR, Hubick KT. 1989. Carbon Isotope Discrimination and Photosynthesis. Annual 549
Review of Plant Physiology and Plant Molecular Biology, 40(1): 503–537.
550
https://doi.org/10.1146/annurev.pp.40.060189.002443.
551
Feudale L, Shukla J. 2011. Influence of sea surface temperature on the European heat wave of 2003 552
summer. Part II: a modeling study. Climate Dynamics, 36(9–10): 1705–1715.
553
https://doi.org/10.1007/s00382-010-0789-z.
554
Gagen M, Mccarroll D, Edouard J. 2004. Latewood Width , Maximum Density , and Stable Carbon Isotope 555
Ratios of Pine as Climate Indicators in a Dry Subalpine Environment , French Alps. Arctic, Antarctic, 556
and Alpine Research, 36(2): 166–171. https://doi.org/10.1657/1523- 557
0430(2004)036[0166:LWMDAS]2.0.CO;2.
558
Gagen M, McCarroll D, Robertson I, Loader NJ, Jalkanen R. 2008. Do tree ring δ13C series from Pinus 559
sylvestris in northern Fennoscandia contain long-term non-climatic trends? Chemical Geology, 560
252(1–2): 42–51. https://doi.org/http://dx.doi.org/10.1016/j.chemgeo.2008.01.013.
561
Gagen M, Zorita E, McCarroll D, Young GHF, Grudd H, Jalkanen R, Loader NJ, Robertson I, Kirchhefer 562
A. 2011. Cloud response to summer temperatures in Fennoscandia over the last thousand years.
563
Geophysical Research Letters, 38(5): 1–5. https://doi.org/10.1029/2010GL046216.
564
Gessler A, Ferrio JP, Hommel R, Treydte K, Werner RA, Monson RK. 2014. Stable isotopes in tree rings:
565
Towards a mechanistic understanding of isotope fractionation and mixing processes from the leaves 566
to the wood. Tree Physiology, 34(8): 796–818. https://doi.org/10.1093/treephys/tpu040.
567
Grissino-Mayer HD. 1997. Computer assisted independent observer verification tree ring measurements.
568
Tree Ring Bulletin, 54: 29–41.
569
Grissino-Mayer HD. 2001. Evaluating crossdating accurasy: a manual and tutorial for the computer 570
program Cofecha. Tree-Ring Research, 57(2): 205–221.
571
Hafner P, McCarroll D, Robertson I, Loader NJ, Gagen M, Young GHF, Bale RJ, Sonninen E, Levanič T.
572
2014. A 520 year record of summer sunshine for the eastern European Alps based on stable carbon 573
isotopes in larch tree rings. Climate Dynamics, 43(3): 971–980. https://doi.org/10.1007/s00382-013- 574
1864-z.
575
Harris I, Jones PD, Osborn TJ, Lister DH. 2014. Updated high-resolution grids of monthly climatic 576
observations - the CRU TS3.10 Dataset. International Journal of Climatology, 34(3): 623–642.
577
https://doi.org/10.1002/joc.3711.
578
Hartl-Meier C, Zang C, Büntgen U, Esper J, Rothe A, Göttlein A, Dirnböck T, Treydte K. 2015. Uniform 579
climate sensitivity in tree-ring stable isotopes across species and sites in a mid-latitude temperate 580
forest. Tree Physiology, 35(1): 4–15. https://doi.org/10.1093/treephys/tpu096.
581
Haupt M, Weigl M, Grabner M, Boettger T. 2011. A 400-year reconstruction of July relative air humidity 582
for the Vienna region (eastern Austria) based on carbon and oxygen stable isotope ratios in tree-ring 583
latewood cellulose of oaks (Quercus petraea Matt. Liebl.). Climatic Change, 105(1): 243–262.
584
https://doi.org/10.1007/s10584-010-9862-1.
585
Holmes RL. 1983. Computer-assisted quality control in tree-ring dating and measurement. Tree Ring 586
Bulletin, 43: 69–75.
587
15 Hughes MK, Swetnam TW, Diaz HF (eds). 2011. Dendroclimatology Progress and Prospects. Springer 588
Science & Business Media.
589
Ionita M. 2015. Interannual summer streamflow variability over Romania and its connection to large-scale 590
atmospheric circulation. International Journal of Climatology, 35(14): 4186–4196.
591
https://doi.org/10.1002/joc.4278.
592
Ionita M. 2017. Mid range forecasting of the German Waterways streamflow based on hydrologic, 593
atmospheric and oceanic data. Alfred Wegener Institute for Polar and Marine Research.
594
Bremerhaven, 711.
595
Ionita M, Dima M, Lohmann G, Scholz P, Rimbu N. 2014. Predicting the June 2013 European Flooding 596
Based on Precipitation, Soil Moisture, and Sea Level Pressure. Journal of Hydrometeorology, 16(2):
597
598–614. https://doi.org/10.1175/JHM-D-14-0156.1.
598
Ionita M, Lohmann G, Rimbu N. 2008. Prediction of spring Elbe discharge Based on stable teleconnections 599
with winter global temperature and precipitation. Journal of Climate, 21(23): 6215–6226.
600
https://doi.org/10.1175/2008JCLI2248.1.
601
Ionita M, Lohmann G, Rimbu N, Chelcea S, Dima M. 2012. Interannual to decadal summer drought 602
variability over Europe and its relationship to global sea surface temperature. Climate Dynamics, 38:
603
363–377. https://doi.org/10.1007/s00382-011-1028-y.
604
Ionita M, Scholz P, Grosfeld K, Treffeisen R. 2018. Moisture transport and Antarctic sea ice: Austral spring 605
2016 event. Earth System Dynamics Discussions, 9(December): 939–954.
606
https://doi.org/10.5194/esd-2017-114.
607
Ionita M, Tallaksen LM, Kingston D, Stagge JH, Laaha G, Van Lanen HAJ, Scholz P, Chelcea SM, 608
Haslinger K. 2017. The European 2015 drought from a climatological perspective. Hydrology and 609
Earth System Sciences, 21: 1397–1419. https://doi.org/doi:10.5194/hess-21-1397-2017.
610
IPCC. 2014. IPPC Climate Change 2014 Synthesis Report. Climate Change 2014: Synthesis Report.
611
Contribution of Working Groups I, II and III to the Fifth Assessment Report of the Intergovernmental 612
Panel on Climate Change. Geneva, Switzerland.
613
Jacoby GC, Lovelius N V., Shumilov OI, Raspopov OM, Karbainov JM, Frank DC. 2000. Long-term 614
temperature trends and tree growth in the Taymir region of northern Siberia. Quaternary Research, 615
53(3): 312–318. https://doi.org/10.1006/qres.2000.2130.
616
Keeling CD. 1979. The Suess effect:13Carbon-14Carbon interrelations. Environment International, 2(4–
617
6): 229–300. https://doi.org/10.1016/0160-4120(79)90005-9.
618
Kern Z, Popa I. 2008. Changes of Frost Damage and Treeline Advance for Swiss Stone Pine in the Calimani 619
Mts. (Eastern Carpathians, Romania). Acta Silvatica et Lignaria Hungarica, 4: 39–48.
620
Kern Z, Popa I, Varga Z, Széles É. 2009. Degraded temperature sensitivity of a stone pine chronology 621
explained by dendrochemical evidences. Dendrochronologia, 27(2): 121–128.
622
https://doi.org/http://dx.doi.org/10.1016/j.dendro.2009.06.005.
623
Kilroy E, McCarroll D, Young GH, Loader NJ, Bale RJ. 2016. Absence of juvenile effects confirmed in 624
stable carbon and oxygen isotopes of European larch trees. Acta Silvae et Ligni, 111(111): 27–33.
625
https://doi.org/10.20315/ASetL.111.3.
626
Kimak A, Leuenberger M. 2015. Are carbohydrate storage strategies of trees traceable by early–latewood 627
carbon isotope differences? Trees - Structure and Function, 29(3): 859–870.
628
https://doi.org/10.1007/s00468-015-1167-6.
629
16 Kingston DG, Fleig AK, Tallaksen LM, Hannah DM. 2013. Ocean–Atmosphere Forcing of Summer 630
Streamflow Drought in Great Britain. Journal of Hydrometeorology, 14(1): 331–344.
631
https://doi.org/10.1175/JHM-D-11-0100.1.
632
Kingston DG, Stagge JH, Tallaksen LM, Hannah DM. 2015. European-scale drought: Understanding 633
connections between atmospheric circulation and meteorological drought indices. Journal of 634
Climate, 28(2): 505–516. https://doi.org/10.1175/JCLI-D-14-00001.1.
635
Konter O, Holzkämper S, Helle G, Büntgen U, Saurer M, Esper J. 2014. Climate sensitivity and parameter 636
coherency in annually resolved δ13C and δ18O from Pinus uncinata tree-ring data in the Spanish 637
Pyrenees. Chemical Geology. Elsevier B.V., 377: 12–19.
638
https://doi.org/10.1016/j.chemgeo.2014.03.021.
639
Kress A, Saurer M, Siegwolf RTW, Frank DC, Esper J, Bugmann H. 2010. A 350 year drought 640
reconstruction from Alpine tree ring stable isotopes. Global Biogeochemical Cycles, 24: 1–16.
641
https://doi.org/10.1029/2009GB003613.
642
Labuhn I, Daux V, Girardclos O, Stievenard M, Pierre M, Masson-Delmotte V. 2016. French summer 643
droughts since 1326 CE: A reconstruction based on tree ring cellulose δ18O. Clim. Past, 12: 1101–
644
1117. https://doi.org/doi:10.5194/cp-12-1101-2016.
645
Laumer W, Andreu L, Helle G, Schleser GH, Wieloch T, Wissel H. 2009. A novel approach for the 646
homogenization of cellulose to use micro-amounts for stable isotope analyses. Rapid 647
Communications in Mass Spectrometry, 23(13): 1934–1940.
648
Leavitt SW. 2010. Tree-ring C–H–O isotope variability and sampling. Science of The Total Environment, 649
408(22): 5244–5253. https://doi.org/http://dx.doi.org/10.1016/j.scitotenv.2010.07.057.
650
Leonelli G, Pelfini M, Battipaglia G, Cherubini P. 2009. Site-aspect influence on climate sensitivity over 651
time of a high-altitude Pinus cembra tree-ring network. Climatic Change, 96(1): 185–201.
652
https://doi.org/10.1007/s10584-009-9574-6.
653
Leuenberger M. 2007. Stable Isotopes as Indicators of Ecological Change. Terrestrial Ecology.
654
Leuenberger MC, Filot MS. 2007. Temperature dependencies of high-temperature reduction on conversion 655
products and their isotopic signatures. Rapid Commun. Mass Spectrom, 21: 1587–1598.
656
https://doi.org/10.1002/rcm.
657
Loader ANJ, Waterhouse JS. 2014. An Extractor Device for Stuck or Broken Increment Borers. Tree Ring 658
Bulletin, 70(2): 157–160. https://doi.org/10.3959/1536-1098-70.2.157.
659
Loader NJ, Robertson I, Barker a. C, Switsur VR, Waterhouse JS. 1997. An improved technique for the 660
batch processing of small wholewood samples to α-cellulose. Chemical Geology, 136(3–4): 313–
661
317. https://doi.org/10.1016/S0009-2541(96)00133-7.
662
Loader NJ, Santillo PM, Woodman-Ralph JP, Rolfe JE, Hall MA, Gagen M, Robertson I, Wilson R, Froyd 663
CA, McCarroll D. 2008. Multiple stable isotopes from oak trees in southwestern Scotland and the 664
potential for stable isotope dendroclimatology in maritime climatic regions. Chemical Geology, 665
252(1–2): 62–71. https://doi.org/http://dx.doi.org/10.1016/j.chemgeo.2008.01.006.
666
McCarroll D, Loader NJ. 2004. Stable isotopes in tree rings. Quaternary Science Reviews, 23(7–8): 771–
667
801. https://doi.org/http://dx.doi.org/10.1016/j.quascirev.2003.06.017.
668
Mutihac V. 2004. Geologia României. Editura Didactică şi Pedagogică: Bucuresti.
669
Nagavciuc V, Ionita M, Perșoiu A, Popa I, Loader NJ, McCarroll D. 2019. Stable oxygen isotopes in 670
Romanian oak tree rings record summer droughts and associated large-scale circulation patterns over 671