Journal of Neuroscience Methods 365 (2022) 109398
Available online 30 October 2021
0165-0270/© 2021 The Authors. Published by Elsevier B.V. This is an open access article under the CC BY-NC-ND license
(http://creativecommons.org/licenses/by-nc-nd/4.0/).
The use of a detailed video-based locomotor pattern analysis system to assess the functional reinnervation of denervated hind limb muscles
D ´ enes G. T ¨ or ¨ ok
a, Zolt ´ an Fek ´ ecs
a, Kriszti ´ an Pajer
a, S ´ andor Pint ´ er
b, Antal N ogr ´ adi ´
a,*aDepartment of Anatomy, Histology and Embryology, Albert Szent-Gy¨orgyi Medical School, University of Szeged, Szeged H-6724, Hungary
bDepartment of Traumatology, Semmelweis Hospital, Kiskunhalas H-6400, Hungary
A B S T R A C T
Background: Spinal cord injuries induce a critical loss of motoneurons followed by irreversible locomotor function impairment. Surgical approaches combined with neuroprotective agents effectively rescue the damaged motoneurons and improve locomotor function. Our aim was to develop a reliable method which is able to provide quantifiable and in-depth data on the locomotor recovery during skeletal muscle reinnervation.
New method: Sprague-Dawley rats underwent lumbar 4 ventral root avulsion and reimplantation followed by riluzole treatment in order to rescue the injured motoneurons of the damaged pool. Control animals were operated, but received no riluzole treatment. The locomotor pattern of the hind limb was recorded biweekly on a special runway equipped with high resolution and high speed digital cameras producing both lateral and rear views simultaneously. All together 12 parameters of the hind limb movement pattern were evaluated by measuring specific joint angles, footprints and gait parameters in single video frames. Four months after the operation Fast Blue, a fluorescent retrograde tracer was applied to the L4 spinal nerve in order to label the reinnervating motoneurons.
Results: Our results confirmed the sensitivity of our arrangement and established strong relationship between the functional improvement and the morphological reinnervation. Moreover, we developed a correction method to make the system tolerant to the differences in the weight, step duration and step length.
Comparison with existing methods: There are no commercially available cheap, multi-parametric analysing equipment to characterise the gait in its complexity.
Conclusions: Our system offers a modular, adaptable and expandable analysis on the reinnervation of the limb musculature in rodents.
1. Introduction
Injuries affecting the motor pools of the spinal cord (Koliatsos et al., 1994; N´ogr´adi et al., 2007) are followed by irreversible locomotor function impairment ranging from inadequate limb movement to com- plete paralysis of one or more extremities (Dietz et al., 1997). Recent development of the therapeutic strategies concerning these motor defi- cits require finely-tuned locomotor analysis systems in order to observe even minor improvements during the recovery process. Although a wide range of equipment is available to record the locomotor performance of the injured animals, most of them focus on only one or few components of their locomotor pattern (Buddeberg et al., 2004). Even in rodents where axon growth is a relatively fast process, locomotor recovery often takes several months to complete. During this long period of time not only the weight of the animal changes, but its locomotor pattern, too (Batka et al., 2014; Neckel et al., 2013; Horner et al., 2011). In order to establish a reliable locomotor analysis system these dynamic alterations should be taken into account during the motor recovery.
Numerous locomotor tests are available to investigate the changes of the locomotor pattern of experimental animals. Classic tests like
Beamwalk, Treadmill, Grid-walk and Rotarod produce reliable and quantifiable results, but are based on the evaluation of only few pa- rameters (Buddeberg et al., 2004; Metz et al., 2000). Moreover, in these tests the spontaneous locomotor activity cannot be evaluated properly (Afelt et al., 1983; G´orska et al., 1999).
Score systems like the Basso-Beattie-Bresnahan (BBB), the Experi- mental Autoimmune Encephalomyelitis (EAE), and the Combined Behavioral Score (CBS) tests are widely used for locomotor analysis due to their overall availability and ease of use, however, the results are user- dependent and the tests are not always applicable to specific types of lesions (Metz et al., 2000; de de de Cassia Sampaio et al., 2016; Barros Filho and Molina, 2008). The CatWalk® gait analysis system is a modern and automated approach based on the footprint of the animal equipped with its own software support and particularly useful features and pa- rameters like limb coordination index and foot placement pattern (Hamers et al., 2006; Koopmans et al., 2005). The CatWalk system is gaining an increasing popularity due to its automated features, which at the same time appear to set limitations to high sensitivity (Hamers et al., 2006).
Recent attempts focus on determining the joint angles in resting
* Correspondence to: Department of Anatomy, Histology and Embryology, Albert Szent-Gy¨orgyi Medical School, University of Szeged, Kossuth Lajos sgt. 40, H- 6724 Szeged, Hungary.
E-mail address: nogradi.antal@med.u-szeged.hu (A. N´ogr´adi).
Contents lists available at ScienceDirect
Journal of Neuroscience Methods
journal homepage: www.elsevier.com/locate/jneumeth
https://doi.org/10.1016/j.jneumeth.2021.109398
Received 25 May 2021; Received in revised form 27 September 2021; Accepted 19 October 2021
animals (Bozkurt et al., 2011) or recording these at specific time points during walking or swimming (Metz et al., 2000; Kruspe et al., 2014;
Perrot et al., 2009; Fey et al., 2010; Xu et al., 2015). The limitations of these methods lie in the difficulty to choose the right joint angles and moments of locomotion to be investigated. The high-end version of these single frame kinematic analysis is the so-called 3D measurement system, often used in human cases (Kwon et al., 2015; Sinclair et al., 2014; Chen Wang et al., 2016; Hillen et al., 2013).
The aim of the present study was to establish a reliable locomotor analysis system, which is able to take into account footprint and single frame motion parameters including the secondary features such as gait parameters. Moreover, our analysis system is equipped with correction modules that help normalize the increasing weight and changing step parameters (length and duration) of the animals. In order to test the analysis system we have set a rat model up where motoneuron regen- eration after an avulsion injury to the lumbar 4 ventral root was sup- ported by riluzole treatment (Pint´er et al., 2010; N´ogr´adi and Vrbov´a, 2001; Chai et al., 2000). This model appears to be particularly suitable to test our newly developed analysis system, as the minute improve- ments during the regenerative process are difficult to be caught by conventional methods.
2. Materials and methods 2.1. Animals
A total of 22 female Sprague-Dawley rats (Biological Services, Uni- versity of Szeged, 170–200 g body weight) were used for surgical pro- cedures. Animals were kept at a 12:12 h light-dark cycle and received water and food ad libitum. Twelve animals underwent left lumbar 4 (L4) ventral root avulsion and immediate reimplantation. Half of the oper- ated animals received riluzole treatment after the operation while the others remained untreated. The rats survived for 13 weeks and a kine- matic analysis was carried out during the survival period. Ten growing intact animals were used to establish a database of correction factors.
2.2. Surgical procedures
All the operations were carried out under deep ketamine-xylazine aenaesthesia under deep ketamine-xylazine anaesthesia (ketamine hy- drochloride [Ketavet, Dr. E. Graeub AG, Bern, Switzerland, 110 mg/kg body weight]; xylazine [Rompun, Bayer HealthCare, Bayer Austria G.m.
b.H., 12 mg/kg body weight]) taking sterile precautions. Laminectomy was performed at the level of T13–L1 vertebra, the dura was opened, the spinal cord and the ventral roots were exposed and the left L4 ventral root was pulled out, leaving the dorsal roots intact (Fig. 1 A). Then the free end of the avulsed ventral root was gently inserted into the dorso- lateral part of the L4 spinal segment close to the motor pool (N´ogr´adi et al., 2007; N´ogr´adi and Vrbov´a, 2001; Chai et al., 2000). Finally, the spinal cord was covered with the remaining dura, the wound was closed, and the animals were allowed to recover. The experiments were carried out with the approval of the Committee for Animal Experiments, Uni- versity of Szeged regarding the care and use of animals for experimental procedures and under the auspices of the National Food Chain Safety Office, Hungary (NFCSO, animal licence No.: I./1569/2019). All the procedures were performed according to the Helsinki Declaration on Animal Rights and the EU animal legislation (European Convention for the Protection of Vertebrate Animals used for Experimental and other Scientific Purposes 01/01/1991). The animals were given saline (0.9%;
5 ml) to prevent dehydration and received meloxicam (Metacam; 0.5 mg/kg body weight, Boehringer Ingelheim Vetmedica). Efforts were made to minimize the number of animals used.
2.3. Riluzole treatment
Animals (n=6) were treated with riluzole (2-amino-6-tri- fluoromethoxy-benzothiazole, kind gift of Tocris Cookson Ltd, Langford, UK) for two weeks. The treatment started the day after the surgery and then the drug was administered intraperitoneally (ip, 0.8 mg/kg, dis- solved in sterile physiological saline) every second day for two weeks (Fig. 1C). This protocol is based on the riluzole treatment strategy described in our earlier papers (Pint´er et al., 2010; N´ogr´adi and Vrbov´a, 2001). In our earlier studies we administered 4 mg/kg riluzole for three weeks postoperatively to achieve as good motoneuron survival and reinnervation as possible. In the present study, the above low dose of riluzole (0.8 mg/kg) was decided to be used as we wanted to achieve only a partial rescue of motoneurons. This particular dose and admin- istration period of time was based on preliminary experiments of our laboratory (Fek´ecs et al., unpublished data) and was proven to produce limited motoneuron rescue, significantly different from the untreated control values. Control animals received PBS only intraperitoneally.
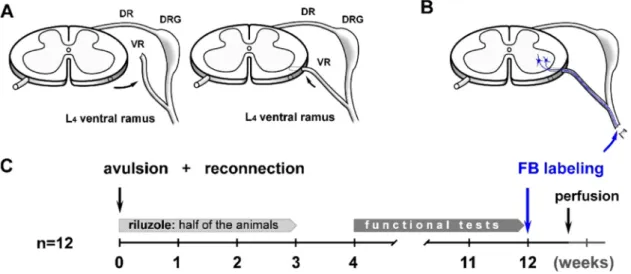
Fig. 1. Schematic diagrams show the surgical procedures and a time-scaled overview of the experimental setup. A: The L4 ventral root was torn out from the spinal cord and reimplanted laterally to provide a regenerative pathway for the injured axons. B: The Fast Blue retrograde tracer was applied to the ventral ramus of the L4 spinal nerve in order to label the reinnervating motoneurons 5 days before sacrificing the animals. C: The most important stages of the experiment such as the riluzole treatment and the functional tests are indicated in a week-based Gantt chart.
2.4. Retrograde labelling
Three months after surgery all the animals were deeply anaes- thetized with ketamine-xylazine. On the operated side the ventral ramus of the L4 spinal nerve was sectioned and the proximal stump of the nerve was covered with few crystals of Fast Blue (Fig. 1B). Five days after the application of fluorescent tracer the animals were re-anaesthetised as described above and perfused transcardially with physiological saline followed by 4% paraformaldehyde in 0.1 mol/l phosphate buffer (pH=7.4). The lumbar part of the spinal cord with the reimplanted ventral root was removed and kept in fixative overnight at 4◦C. The tissues were cryoprotected in 30% sucrose in azide-PBS until further use.
2.5. Cell counting
The number of the retrogradely labelled motoneurons was deter- mined in 25µm thick serial cryostat cross sections (Leica CM-1850 cryostat, Leica GmbH.) under an Olympus BX50 fluorescence micro- scope (Olympus, Tokyo, Japan). To avoid double counting of neurons present in consecutive sections, the retrogradely labelled neurons were mapped with the aid of an Olympus (Olympus Ltd, Tokyo, Japan) drawing tube, and their locations were compared with those of the labelled neurons in the previous section (Pint´er et al., 2010; N´ogr´adi and Vrbov´a, 2001; Chai et al., 2000; N´ogr´adi and Vrbova, 1996; Gloviczki et al., 2017). All sections from the L4 motoneuron pool were used.
2.6. Kinematic analysis 2.6.1. Equipment and setup
For kinematic analysis we used a transparent plexiglass runway (100 cm * 15 cm) with a tilted mirror fixed under the floor plate (Fig. 2A). Another mirror system was fixed behind the runway in a way that two mirrors fixed to each other in a right angle were placed with the open angle facing the other side of the runway (Fig. 2B) This system enabled us to observe and record the movements and positions of the contralateral limb. The runway was lit by red LEDs (650 nm) with their beam guided into the side walls and by green LEDs (530 nm) built into the floor plate (Fig. 2B). A square grid pattern with 1 cm intervals was etched into the front panel to facilitate the off-line elimination of the fish-eye effect. This grid pattern also served as guide for the calculation of the required Cartesian coordinates. The rats were trained preopera- tively to walk from one end of the runway to the other end equipped with a dark shelter. Small pieces of cereals were provided in the shelter to encourage the animals. The locomotor pattern of the rats was recor- ded with high resolution and high speed digital cameras (Gopro Hero 3+Black Edition [1280×720 pixels, 100 frames/s], GoPro Inc. and DFK 22AUC03 [1280×720 pixels, 76 frames/sec], The Imaging Source) from both lateral (Gopro Hero 3+) and posterior aspects (DFK 22AUC03), simultaneously. The lateral camera was placed at a distance of 70 cm from the runway in order to record 3–4 step cycles within one run. This aspect required the fast Gopro camera equipped with a fish-eye optic, thus providing better quality images for the lateral view.
2.6.2. Locomotor test
After the avulsion and reimplantation surgery a four-week-long re- covery period was allowed. Before the first recording the hair was shaved from the affected hind limb and the skin of the animals was marked with permanent black ink above the bony prominences of the major joints (Fig. 3A). Although ink-marking has been reported not to be fully satisfactory in certain cases (Bauman and Chang, 2010), we found that by selecting the right time points of movements the markings matched the positions of the joints. The only and partial exception was the knee joint, for which there appeared to be a mismatch between the marking and the joint position in few movement positions (for details see below). However, the large resolution of the lateral view still made it possible to identify the correct position of the knee joint in these cases.
We recorded 3 runs of each animal in every session and examined 5 steps complying two criteria: one similar step was required before and after the measured step and the head of the animal had to point to the di- rection of walk. First a digital fish-eye effect elimination was carried out (GoPro Studio software, GoPro Inc., US.) on the appropriate video se- quences, then the sequences were split into single frames using the VirtualDub (Avery Lee) software. The selected frames, where the ani- mals were in a defined phase of motion were used for measurement using the ImageJ (Wayne Rosband, National Institutes of Health) soft- ware. The ImageJ software provides the Cartesian coordinates of the plotted joint points. Conversion of the coordinates into vectors and the vector data to angles were performed by using algorithms in Microsoft Excel environment, developed in our laboratory. As growing intact rats displayed an ever changing locomotor pattern, we had to correlate our recordings for injured animals with the changing locomotor pattern taken from intact rats. We found the use of intact animals as healthy controls more reliable than that of the contralateral hind limb of injured animals. The contralateral limb appeared to be affected by the damaged spinal cord circuitry and the sensitivity of this locomotor test already recorded these minor changes (for details see the paragraph “Kinematic analysis” in Results). Therefore, we recorded and evaluated step cycles from intact animals (n=10) weekly and observed the correlations Fig. 2. The equipment and the optical capturing pathways of our video-based kinematic analysis system are shown. A: The dimensions of the runway and the applied materials along with the position and the specifications of the cameras were planned carefully to get the most reliable data from the runs of the ani- mals. B: The position of the mirrors makes it possible to capture three different views of the animals from one location, thus three different aspects of their run can be observed at the same time. The red and green lights projected into the side walls and the floor plate, respectively, serve the accuracy of the foot- print analysis.
between our parameters and the weight of animals (which is related to the size of the animals, thus to the length of the bones), the step length and the step duration (both represent the “style” of the animals gait) each. Correcting algorithms based on these three characteristics have been set up and used for all the evaluations of all the measured pa- rameters of the injured animals by a percentile comparison. This data- base and the algorithms can be used in all SD rats in our setup.
2.6.3. Gait parameters
The step cycle of a rat can be divided into stance and swing phases (Fig. 3C). During the stance phase the paw touches the floor plate. We found that the first and the last moments of the stance phase and the midpoint of the swing phase (the highest position of the lifted paw) are the most important positions for characterising the rat locomotion.
Accordingly, most kinematic parameters derive from the evaluation of the single frames depicting these positions. The following parameters were proven to be useful in connection with recovery after an avulsion injury (Supplemetary Video 1).
Supplementary material related to this article can be found online at doi:10.1016/j.jneumeth.2021.109398.
2.7. 1,Lateral view parameters
Toe off angle (TOA): The angle enclosed by the floor plate and the line formed by the tarsal and metatarsal bones at the last moment of the stance phase (Fig. 4A).
Ankleflexion (AF): The angle enclosed by the tarsus and the tibia at the first moment of the stance phase (Fig. 4B).
Range of Ankleflexion (RAF). The difference of the minimum and maximum ankleflexion values within one step cycle. We used four time frames to calculate this parameter depending where the minimum and maximum values were found and any of these step cycle points could be used to form matching pairs. The four points are the first or the last moments of the stance phase, the midpoint of the swing phase and the first moment of the stance phase in the contralateral limb (Fig. 4C).
Knee flexion (KF): The angle enclosed by the tibia and the femur at the first moment of the stance phase (Fig. 4D).
Range of knee flexion (RKF): The difference of the minimum and maximum knee flexion values within one step cycle. Again we used the same four time frames to calculate this parameter as in the case of RAF (please see details above) (Fig. 4E).
Lateral placing (LP): The angle enclosed by the axis of the tarsus and the longitudinal axis of the animal. We measured this parameter at the first moment of the stance phase from the bottom mirror view (Fig. 4F).
Ankle Lifting (AL): The difference between the highest and lowest points reached by the ankle joint during the step cycle phases. We compared the x coordinates of the ankle joint through the same four time points as in RAF and RKF pairwise, and the highest distance value was selected (Fig. 4G).
Knee Lifting (KL): The difference between the highest and lowest points reached by the ankle joint during the step cycle phases. The principle of the comparison was the same described above in the case of AL (Fig. 4H).
Ratio of the stance phase within the step cycle (RSP): The number of frames related to the stance phase in single steps along with the total number of frames within the whole step cycle was determined.
Then the percentage of the number of frames in the stance phase relative to the total step cycle frame numbers was calculated. This parameter provides direct information about the weight carrying capacity of the affected hind limb (Fig. 4I).
2.8. 2, Rear-view parameters
Metatarsus-Surface Angle (MSA): The angle enclosed by the lon- gitudinal axis of the metatarsus and the surface at the first moment of the swing phase when the foot has just left the floor plate (Fig. 4J).
Tibia-Surface Angle (TSA): The angle enclosed by the tibia and the floor plate at the starting point of the stance phase (Fig. 4K).
2.9. 3, Footprint analysis (Fig. 4L)
We carried out an offline footprint analysis based on colour tem- perature differences. A green light (530 nm) was directed straight into the floor plate and we adjusted the angle of incidence of the light rays bigger than the critical angle, thus the green light only illuminated the area where the paws of the animal touched the floor (for details see the phenomenon of optical evanescence) (Fig. 2B). We enlighted the whole runway with red light (650 nm) and thus were able to measure precisely the contrasted green area with the help of the ImageJ software in selected frames, when the contralateral limb was in the very first moment of the swing phase. This parameter gives us information on the weight-carrying ability of the animals.
2.10. 4, Sciatic functional index (SFI)
We measured the SFI at the first moment of stance phase as described Fig. 3. Figure shows different aspects of the kinematic analysis in details. A:
Projection of the bones and the joints of the rat hind limb used in our mea- surements is shown. B: The measurement of the rear-view parameters is based on the angle enclosed by a selected bone and the floor plate (here the meta- tarsus is shown at the first moment of the swing phase). The intact value is displayed in blue, whilst green and red angles are representing the deviations followed by moderate or serious impairments, respectively. It is important to note that deviation may occur in both directions (white arrows). C: The image shows every position of the measured bones during three intact step cycles from the lateral aspect represented by single video frames. The step cycle can be divided into stance phase (black) and swing phase (red). In our experiment the first moment of the stance phase, the mid-swing phase and the first moment of the swing phase (black arrows from left to right) were used for the measure- ments. D: The footprint area was measured at the moment when the contra- lateral limb was in mid-swing position. The summed pixels (inset) were selected automatically by colour temperature parameters.
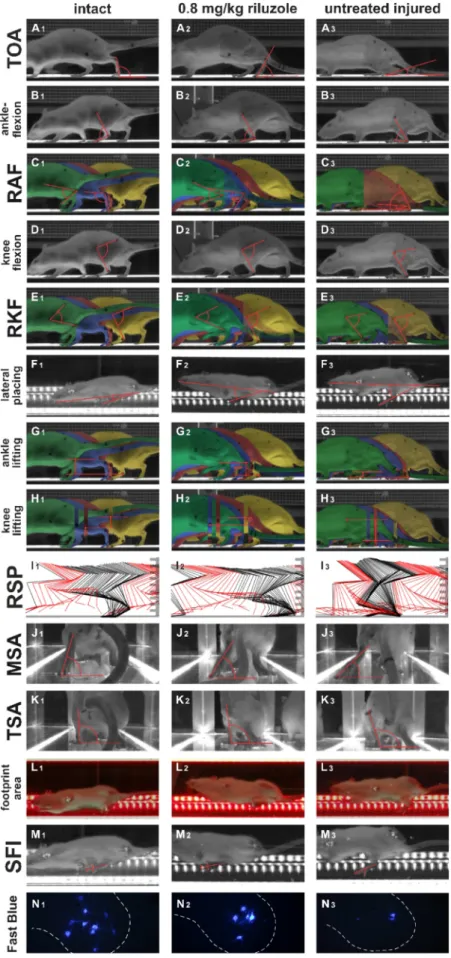
Fig. 4. Representative images of the kinematic parameters are shown. The vertical columns represent the various experimental groups, including intact animals. A1-A3: Toe-off angle (TOA) typically appears to be smaller in the injured animals. It is important to note that in dorsal stepping this angle is bigger than in the intact animals, thus the significant change of this parameter may be a characteristic indicator of the regeneration. B1-B3:
ankleflexion typically appears to be smaller with more severe injury. C1-C3: The range of ankleflexion (RAF) is generally bigger in the injured animals. The four compared frames of the step cycle are shown in different colours (the first moment of the stance phase in yellow, the contralateral mid-swing phase in red, the last moment of the stance phase in blue and the mid-swing phase in green). D1-D3: The representative images show the extent of the knee flexion in the various experimental groups. E1-E3: The range of knee flexion decreases with the severity of the functional impairment, but its deviation from the intact value may be larger.
F1-F3: Representative images from the lateral placing parameter can be seen. G1-G3: The general appearance of ankle lifting parameter is shown. H1-H3: The knee lifting parameter is measured as seen. I1-I3: The figures show the number of frames belonging to the stance phase (RSP) in black and the ones belonging to the swing phase in red. The ratio of the stance and swing phases can be calculated as complementary values. J1-J3:
The representative images show the MSA rear-view parameter in the various experimental groups. K1-K3: The TSA was measured from the rear-view aspect, too. L1-L3: The footprint is seen as a light green illuminated area. The more the weight-bearing is the bigger footprint area can be measured. M1-M3: The measurement of SFI was carried out in the same position as the lateral placing.
N1-N3: Representative images of the reinnervating motoneuron pools within the L4 spinal segment are shown. Note the higher number of reinnervating motoneurons in the riluzole-treated animals.
by Kanaya and his colleagues (Kanaya et al., 1996) Like in the case of footprint analysis the tilted mirror under the floorplate reflected the appropriate image for the analysis. (Fig. 2B, Fig. 4M).
In the cases of all parameters, but two we compared the received values of each injured animal with the adequate averaged intact data (same weight, speed and step length). The final parameter was presented as a percentage of deviation from the intact values. It is important to note that in the case of angle-based parameters both negative and pos- itive deviations were recorded and considered. To demonstrate the feasibility of this procedure the evaluation of the MSA parameter is detailed here: the intact values ranged between 60◦− 108◦depending on step duration while the data received from injured animals ranged be- tween 16◦− 162◦. By applying this approach, we were able to analyse even very severe functional impairments resulting in a variety of abnormal gait patterns (Fig. 3A).
In the case of SFI we strictly followed the original concept of the calculations where ‘0′value was already related to the intact animals, thus a secondary calculation would be unnecessary and be resulted in unpresentable data. Moreover, this was the only parameter where we had to deal with negative numbers, which forced us not to deviate from the well-established method.
2.11. Statistical analysis
Correlation analysis was performed to examine whether a significant dependence was present between the kinematic parameters of the intact animals and the weight, the step length and the step duration (p≤0.05).
The Repeated Measures Analysis of variance was applied for the statis- tical comparison of data from all groups. Least Significant Difference (LSD) post hoc analysis was used to test whether the data of the two groups are significantly different from each other in the different time points (p≤0.05). We used simple T test to compare the motoneuron numbers throughout the experimental groups.
3. Results
3.1. General observations
After the avulsion injury an instantly appearing strong impairment could be observed in the affected hind limb in all experimental groups.
During the first weeks postoperatively the animals displayed dorsal stepping with no weight support. In this period of time kinematic analysis cannot be carried out. Four weeks after the injury consistent plantar stepping was observed in the riluzole-treated group. Control animals displayed dorsal stepping for longer periods of time, it could be detected even in week 8 after surgery in some cases. From the 10th postoperative week onward reliable weight support was seen in the treated group, while animals in the control group were not able to produce a reasonable weight support throughout the survival time.
3.2. Kinematic analysis of the contralateral limb
To test whether or not the contralateral hind limb can be used as the basis of comparison, we have analysed the TOA, Lateral placing, MSA, TSA and footprint parameters 4 weeks after the avulsion injury in both the control and the riluzole-treated animals (n=4 each). We checked whether the contralateral side values of the untreated control and riluzole-treated groups are significantly different from the intact values.
In the control group we received 14.6% (±2.5% SEM) for TOA, 38.1%
(±8.1% SEM) for lateral placing, 13.9% (±1.4% SEM) for MSA, 8.1%
(±1.6% SEM) for TSA and 52.0% (±5.9% SEM) for the footprint size.
In the riluzole treated group we received 13.3% (±3.9% SEM) for TOA, 53.1% (±8.7% SEM) for lateral placing, 12.0% (±2.0% SEM) for MSA, 7.3% (±1.2% SEM) for TSA and 66.8% (±12% SEM) for the footprint size.
As these data showed significant differences, the contralateral limb
proved to be affected by the injury since the animals compensated the impairment of the injured limb depending on the extent of the severity of damage. Therefore, the contralateral limb values were not used as intact reference parameters.
3.3. Correlation of the measured parameters with weight, step length and duration in intact animals
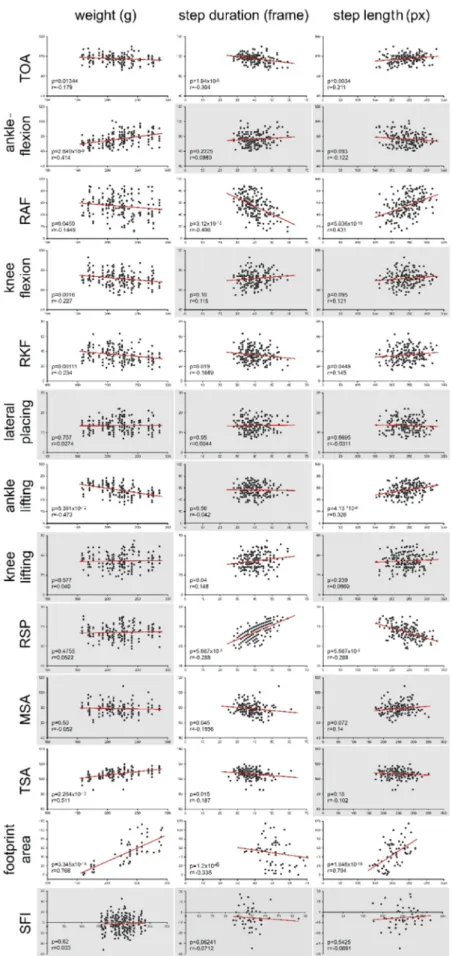
As the investigated animals gain weight and also grow longitudinally during a relatively long survival period, it is expected that the kinematic parameters have to be correlated with these basic physiological growth- related changes. Indeed, it was found that many of the investigated parameters show significant correlation with the growth of the animals.
The summary of the correlation analyses on the weight, step length and step duration is shown in Fig. 5. Significant linear correlation with the weight was found in the case of ankleflexion and footprint size, while an inverse correlation could be detected with knee flexion, RKF and ankle lifting. The step duration correlated significantly with most of the parameters, showing linear dependence on the knee flexion, knee lifting, ankle lifting and footprint. An inverse dependence was found in the case of TOA, ankleflexion, RAF and RSP. Only linear correlations were detected with the step length: TOA, Knee flexion, RAF, knee lifting and ankle lifting all were dependent on this variable. SFI and lateral placing proved to be not sensitive enough and showed no correlation for any of the three parameters. We included the data into individual excel tables for each weight categories (150–330 g, 9 categories in 20 g incremental steps), step duration categories (20–70 frame, 10 categories, 5 frame steps) and step length categories (125–350 px, 9 categories, 25 px steps).
During the analyses of the injured animals all these categories were selectable in order to compare those data to the most appropriate ones.
3.4. Cell counts
The results of the cell counting is shown in Figure (representative images are presented as well in Fig. 4N). Six out of the ten intact animals were used to determine the retrogradely labelled motoneuron number in the intact L4 pool. 1178±31 (SEM) motoneurons were located in the intact L4 motor pool, while in the riluzole treated group (n=6) 394±14 (SEM) motoneurons were found. In animals that underwent only avulsion and reimplantation surgery without riluzole-treatment, 146±23 (SEM) motoneurons were labelled retrogradely. We detected significant differences among all the experimental groups.
3.5. Description of the locomotor analysis
The corrected comparison of the parameters is shown in Fig. 6.
Statistical significance could be detected between the untreated injured and the riluzole-treated animals from an early stage of regeneration in lateral placing, knee flexion, RKF, ankle lifting and SFI parameters.
Anklefexion, RAF, knee lifting, MSA, footprint area and RSP parameters appeared to be sensitive indicators in the late phase of regeneration (between weeks 8 and 12). No significant differences could be detected in TOA and TSA. The detailed statistical data of the ANOVA can be found in Table 1, whereas the detailed results of the LSD are shown in Table 2.
4. Discussion
In this study, we present the results of a sensitive multi-parametric locomotor analysis method developed in our laboratory. We proved that our unique system is able to detect even minor functional improvement on a week by week basis and provides detailed and useful information on the functional reinnervation process.
It can be stated that the information gained from this analysis system is more detailed than that from open field assessments or the single parameter-based tests like the rota-rod or the beam test. Indeed, there are few video-based, single-frame evaluating methods which analyse
Fig. 5.Different extent of kinematic parameter dependence on weight, step duration and step length in intact animals is shown. Each point represents one mea- surement. The correlation test was carried out in all the parameters and a database for correction was created where the linear correlation was significant (p≤0.05).
Here we indicated the significant correlations with white background and the non-significant ones with gray one.
one or few parameters 13,−15. However, none of them are completely appropriate to evaluate the gait in its complexity. Moreover, the success of these applications likely depends on the overall experimental setup (e.
g. animal strains, range of the extension of the injury, time duration of the experiment, momentary behaviour of the animals). With our multi- parameter setup, we were able to monitor the reinnervation process via the activation of various muscles, and our unique correction method provided a stable evaluation process. The question remains, how meticulous is to use a multi-parameter system without a built-in fully automated algorithm? On one hand, the calculating and the correcting processes can be fully automated. On the other hand, the selection of the appropriate 3 step sequence, the designation of the frames belonging to step cycle time points and the determination of the joint positions are time consuming procedures and have to be carried out carefully by
experts. Nevertheless, these are the most perilous subtasks to automate anyway and performing these tasks manually provides the reliability and control of the analysis. In our experience the fully automated sys- tems also need an inspection of these kind of selections by an expert in most cases, otherwise the received data can be ambiguous.
In this study we used a ventral root avulsion model, where only the L4 ventral root was avulsed and thus a set of ankle dorsiflexors (extensor digitorum longus, extensor hallucis longus, tibialis anterior and the peroneus muscles) and a limited part of ankle plantarflexors (lateral gastrocnemius muscle) became partially denervated. Partial denerva- tion of these muscles is due to the fact that most of these muscles receive some motor axons from the intact L5 root as a contributon to the major L4 root axons. Accordingly, loss of the majority of motor innervation due to the L4 ventral root avulsion lead to severe denervation atrophy of the Fig. 6.Diagrams show the results of the measured parameters in control and riluzole-treated groups from the 4th to the 12th postoperative week. The deviation from the intact animal data is shown, the only exception is the SFI in which the intact data is presented in yellow. The comparisons were carried out following a unique correction of the parameters (see Fig. 5.), except the lateral placing parameter, where no dependence was found on weight, step duration or step length, thus no correction was necessary. Significant differences between the control and riuzole-treated animals are indicated with asterisk (p≤0.05, SEM). In the case of the SFI parameter, one asterisk indicates the significant difference between the riluzole-treated and the control group, while two asterisk marks the significant difference between the individual groups and the intact baseline.
affected muscles with all the changes in the kinematic parameters seen in the untreated injured animals. A smaller dose of riluzole (0.8 mg/kg) induced remarkable reinnervation and resulted in dramatic improve- ment of our kinematic and SFI parameters. In this study we used a smaller dose of riluzole as compared to our previous studies (Pint´er et al., 2010; Gloviczki et al., 2017) in order to induce a good reinner- vation (33%) which is still well distinguishable from the innervation pattern of the intact animals. The fact that this lower dose of riluzole is still able to induce a reinnervation pattern by 1/3rd of the total L4 motor pool, in contrast to the reinnervation by approximately 2/3rd of the same pool in the case of 5 mg/kg riluzole treatment (N´ogr´adi and Vrbov´a, 2001) indicates that riluzole is likely not to induce a linear motoneuron rescue or the saturation dose of riluzole is lower than 5 mg/kg. On the other hand, in our experience riluzole induces a balanced reinnervation of the different denervated muscle compart- ment, without any observable difference between muscles of various types and functions.
There are a number of approaches to rescue injured motoneurons and promote their regeneration. While riluzole appears to have a great rescuing effect on injured motoneurons, other potent molecules and their signaling pathways (eg. various FGF isoforms) are also effectively promoting neuronal survival and regeneration as proved by recent studies ranging from in vitro experiments to clinical trial surgeries (Klimaschewski et al., 2004; Araújo et al., 2017; Lin et al., 2005).
Basic fibroblast growth factor isoforms promote axonal elongation and branching of adult sensory neurons in vitro.
Our system can likely be applied to various neural disorders affecting skeletal muscles (e.g. peripheral nerve lesion, plexus injuries, chemo- toxicity, spinal cord injury, motoneuron damage/disease, etc.) and their models. It should be taken into consideration that the intact pool is needed to be set up for every new strain for comparison because the body composition and the walking style can vary widely among these strains. The development of an open database for share and expansion of intact pools would be highly encouraged.
The construction of our system is easily reproducible, only the cameras indicate significant expense. The types of the cameras can be varied in a wide range (at present we use 2 new GoPro cameras for better resolution), however, it is recommended to use a minimum of 720p resolution with 70 frame/sec for both cameras and a minimum of 8-bit colour system (for the footprint analysis).
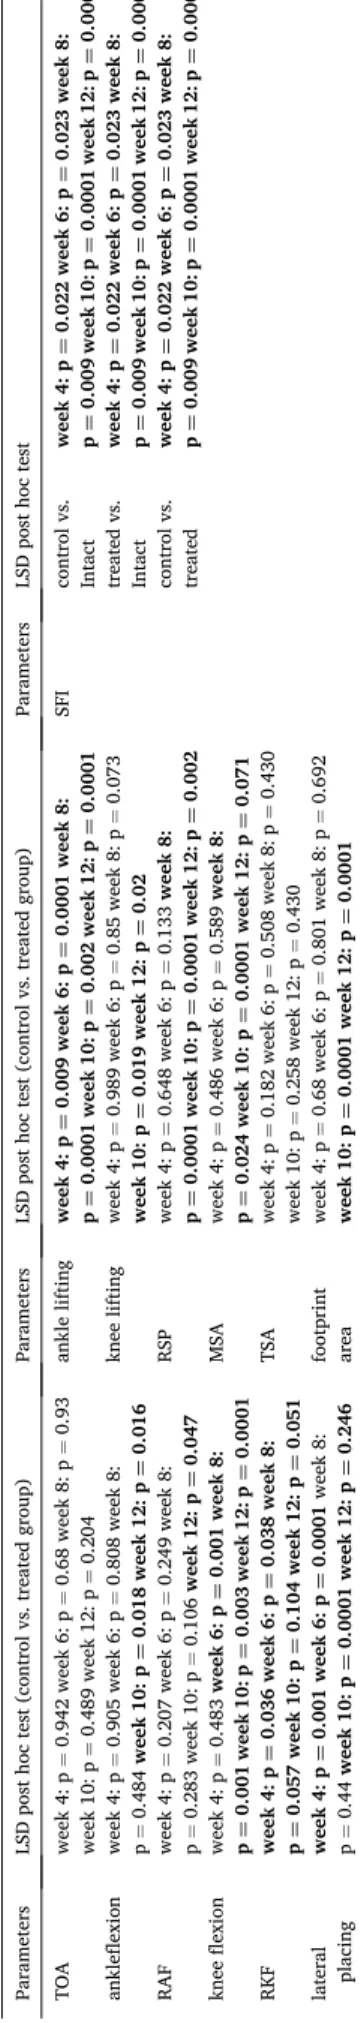
Table 2 The detailed statistical data of the LSD post hoc is seen. Significant values are highlighted with bold fonts. Parameters LSD post hoc test (control vs. treated group) Parameters LSD post hoc test (control vs. treated group) Parameters LSD post hoc test TOA week 4: p=0.942 week 6: p=0.68 week 8: p=0.93 week 10: p=0.489 week 12: p=0.204 ankle lifting week 4: p¼0.009 week 6: p¼0.0001 week 8: p¼0.0001 week 10: p¼0.002 week 12: p¼0.0001 SFI control vs. Intact week 4: p¼0.022 week 6: p¼0.023 week 8: p¼0.009 week 10: p¼0.0001 week 12: p¼0.0001 ankleflexion week 4: p=0.905 week 6: p=0.808 week 8: p=0.484 week 10: p¼0.018 week 12: p¼0.016 knee lifting week 4: p=0.989 week 6: p=0.85 week 8: p=0.073 week 10: p¼0.019 week 12: p¼0.02 treated vs. Intact week 4: p¼0.022 week 6: p¼0.023 week 8: p¼0.009 week 10: p¼0.0001 week 12: p¼0.0001 RAF week 4: p=0.207 week 6: p=0.249 week 8: p=0.283 week 10: p=0.106 week 12: p¼0.047 RSP week 4: p=0.648 week 6: p=0.133 week 8: p¼0.0001 week 10: p¼0.0001 week 12: p¼0.002 control vs. treated week 4: p¼0.022 week 6: p¼0.023 week 8: p¼0.009 week 10: p¼0.0001 week 12: p¼0.0001 knee flexion week 4: p=0.483 week 6: p¼0.001 week 8: p¼0.001 week 10: p¼0.003 week 12: p¼0.0001 MSA week 4: p=0.486 week 6: p=0.589 week 8: p¼0.024 week 10: p¼0.0001 week 12: p¼0.071 RKF week 4: p¼0.036 week 6: p¼0.038 week 8: p¼0.057 week 10: p¼0.104 week 12: p¼0.051 TSA week 4: p=0.182 week 6: p=0.508 week 8: p=0.430 week 10: p=0.258 week 12: p=0.430 lateral placing week 4: p¼0.001 week 6: p¼0.0001 week 8: p=0.44 week 10: p¼0.0001 week 12: p¼0.246 footprint area week 4: p=0.68 week 6: p=0.801 week 8: p=0.692 week 10: p¼0.0001 week 12: p¼0.0001 Table 1
The detailed statistical data of the ANOVA analysis is seen. We examined the effect of time (test of within subject) and the effect of the treatment (test of between subjects) in every parameters.
Test of Within-Subjects Effects of
time Test of Between-Subjects
Effects
TOA F(4156)=4.262; p=0.003 F(1,39)=0.641; p=0.428 ankleflexion F(2.98,228)=5.47; p=0.001 F(1,57)=3.724; p=0.059 RAF F(4160)=1.364; p=0.249 F(1,40)=11.271; p=0.002 knee flexion F(4168)=4.34; p=0.002 F(1,42)=35.468;
p=0.0001
RKF F(4188)=4.638; p=0.001 F(1,47)=20.295;
p=0.0001 lateral
placing F(4212)=3.805; p=0.005 F(1,53)=16.828;
p=0.0001 ankle lifting F(4192)=3.405; p=0.01 F(1,48)=48.858;
p=0.0001
knee lifting F(4188)=4.219; p=0.003 F(1,47)=5.765; p=0.02 RSP F(3.2153.67)=4.016; p=0.007 F(1,48)=73.696;
p=0.0001
MSA F(4216)=4.017; p=0.004 F(1,54)=10.33; p=0.002 TSA F(3.351,212)=1.487; p=0.216 F(1,53)=3.924; p=0.053 footprint area F(2.07,57.89)=19.68;
p=0.0001 F(1,28)=5.44; p=0.027
SFI F(3.16,172)=0.559; p=0.652 F(1,43)=14.166; p=0.001 F(df (time), df (Error))=F ratio F(df (group), df (Error))=F
ratio
In the near future we wish to adopt our system to multiple spinal cord injury models and would like to develop the evaluating method for the muscles and joints of the rodent forelimb. We also plan to build a runway customized for mice. Another goal would be the creation of an ultimate gait index which would summarize all the measured parameters in one number, however, it appears to be hard to predict which parameter is the most informative through the different applications of the method.
CRediT authorship contribution statement
D´enes G. T¨orok: Conceptualization, Methodology, Writing, Soft-¨ ware, Data curation, Original draft preparation, Visualization, Valida- tion, Zolt´an Fek´ecs: Conceptualization, Methodology, Software, Data curation, Formal analysis, Conceptualization, Methodology, Kriszti´an Pajer: Investigation, Methodology, S´andor Pint´er: Supervision, Antal Nogr´ ´adi: Project administration, Funding acquisition, Resources, Writing – review & editing.
Declaration of Competing Interest
The authors declare no conflict of interest related to the research article entitled as, The use of a detailed video-based locomotor pattern analysis system to assess the functional reinnervation of denervated hind limb muscles.
Acknowledgement
This work was supported by the research program GINOP 2.3.2-15- 2016-00034, Hungary.
References
Afelt, Z., Blaszczyk, J., Dobrzecka, C., 1983. Stepping frequency and stride length in animal locomotion - a new method of investigation. Acta Neurobiol. Exp. 43, 227–234.
Araújo, M.R., Kyrylenko, S., Spejo, A.B., Castro, M.V., Ferreira Junior, R.S., Barraviera, B., Oliveira, A., 2017. Transgenic human embryonic stem cells overexpressing FGF2 stimulate neuroprotection following spinal cord ventral root avulsion. Exp. Neurol. 294, 45–57. https://doi.org/10.1016/j.
expneurol.2017.04.009.
Barros Filho, T.E., Molina, A.E., 2008. Analysis of the sensitivity and reproducibility of the Basso, Beattie, Bresnahan (BBB) scale in Wistar rats. Clin. (Sao Paulo) 63, 103–108. https://doi.org/10.1590/s1807-59322008000100018.
Batka, R.J., Brown, T.J., Mcmillan, K.P., Meadows, R.M., Jones, K.J., Haulcomb, M.M., 2014. The need for speed in rodent locomotion analyses. Anat. Rec. (Hoboken) 297, 1839–1864. https://doi.org/10.1002/ar.22955.
Bauman, J.M., Chang, Y.H., 2010. High-speed X-ray video demonstrates significant skin movement errors with standard optical kinematics during rat locomotion.
J. Neurosci. Methods 186, 18–24. https://doi.org/10.1016/j.jneumeth.2009.10.017.
Bozkurt, A., Scheffel, J., Brook, G.A., Joosten, E.A., Suschek, C.V., O’Dey, D.M., Pallua, N., Deumens, R., 2011. Aspects of static and dynamic motor function in peripheral nerve regeneration: SSI and CatWalk gait analysis. Behav. Brain Res. 219, 55–62. https://doi.org/10.1016/j.bbr.2010.12.018.
Buddeberg, B.S., Kerschensteiner, M., Merkler, D., Stadelmann, C., Schwab, M.E., 2004.
Behavioral testing strategies in a localized animal model of multiple sclerosis.
J. Neuroimmunol. 153, 158–170. https://doi.org/10.1016/j.jneuroim.2004.05.006.
de Cassia Sampaio, O., Defino, H.L., Del Bel Belluz Guimar˜aes, E.A., 2016. Effect of hypovolemia on traumatic spinal cord injury. Spinal Cord. 54, 742–745. https://doi.
org/10.1038/sc.2016.26.
Chai, H., Wu, W., So, K.F., Yip, H.K., 2000. Survival and regeneration of motoneurons in adult rats by reimplantation of ventral root following spinal root avulsion.
Neuroreport 11, 1249–1252. https://doi.org/10.1097/00001756-200004270- 00021.
Chen Wang, M.D., Geng, X., Wang, S., Xin Ma, M.D., Xu Wang, M.D., Jiazhang Huang, M.
D., Chao Zhang, M.D., Li Chen, M.S., Yang, J., Wang, K., 2016. In vivo kinematic study of the tarsal joints complex based on fluoroscopic 3D–2D registration technique. Gait Posture 49, 54–60. https://doi.org/10.1016/j.gaitpost.2016.06.009.
Dietz, V., Wirz, M., Jensen, L., 1997. Locomotion in patients with spinal cord injuries.
Phys. Ther. 77, 508–516. https://doi.org/10.1093/ptj/77.5.508.
Fey, A., Schachner, M., Irintchev, A., 2010. A novel motion analysis approach reveals late recovery in C57BL/6 mice and deficits in NCAM-deficient mice after sciatic nerve crush. J. Neurotrauma 27, 815–828. https://doi.org/10.1089/neu.2009.1217.
Gloviczki, B., T¨or¨ok, D.G., M´arton, G., G´al, L., Bodzay, T., Pint´er, S., N´ogr´adi, A., 2017.
Delayed spinal cord-brachial plexus reconnection after C7 ventral root avulsion: the effect of reinnervating motoneurons rescued by riluzole treatment. J. Neurotrauma 34, 2364–2374. https://doi.org/10.1089/neu.2016.4754.
G´orska, T., Zmysłowski, W., Majczy´nski, H., 1999. Overground locomotion in intact rats:
interlimb coordination, support patterns and support phases duration. Acta Neurobiol. Exp. (Wars. ) 59, 131–144.
Hamers, F.P., Koopmans, G.C., Joosten, E.A., 2006. CatWalk-assisted gait analysis in the assessment of spinal cord injury. J. Neurotrauma 23, 537–548. https://doi.org/
10.1089/neu.2006.23.537.
Hillen, B.K., Yamaguchi, G.T., Abbas, J.J., Jung, R., 2013. Joint-specific changes in locomotor complexity in the absence of muscle atrophy following incomplete spinal cord injury. J. Neuroeng. Rehabil. 10, 97. https://doi.org/10.1186/1743-0003-10- Horner, A.M., Russ, D.W., Biknevicius, A.R., 2011. Effects of early-stage aging on 97.
locomotor dynamics and hindlimb muscle force production in the rat. J. Exp. Biol.
214, 3588–3595. https://doi.org/10.1242/jeb.055087.
Kanaya, F., Firrell, J.C., Breidenbach, W.C., 1996. Sciatic function index, nerve conduction tests, muscle contraction, and axon morphometry as indicators of regeneration. Plast. Reconstr. Surg. 98, 1264–1271. https://doi.org/10.1097/
00006534-199612000-00023.
Klimaschewski, L., L, Nindl, W., Feurle, J., Kavakebi, P., Kostron, H., 2004. Basic fibroblast growth factor isoforms promote axonal elongation and branching of adult sensory neurons in vitro. Neuroscience 126, 347–353. https://doi.org/10.1016/j.
neuroscience.2004.04.004.
Koliatsos, V.E., Price, W.L., Pardo, C.A., Price, D.L., 1994. Ventral root avulsion: an experimental model of death of adult motor neurons. J. Comp. Neurol. 342, 35–44.
https://doi.org/10.1002/cne.903420105.
Koopmans, G.C., Deumens, R., Honig, W.M., Hamers, F.P., Steinbusch, H.W., Joosten, E.
A., 2005. The assessment of locomotor function in spinal cord injured rats: the importance of objective analysis of coordination. J. Neurotrauma 22, 214–225.
https://doi.org/10.1089/neu.2005.22.214.
Kruspe, M., Thieme, H., Guntinas-Lichius, O., Irintchev, A., 2014. Motoneuron regeneration accuracy and recovery of gait after femoral nerve injuries in rats.
Neuroscience 280, 73–87. https://doi.org/10.1016/j.neuroscience.2014.08.051.
Kwon, J.W., Son, S.M., Lee, N.K., 2015. Changes of kinematic parameters of lower extremities with gait speed: a 3D motion analysis study. J. Phys. Ther. Sci. 27, 477–479. https://doi.org/10.1589/jpts.27.477.
Lin, P., Cheng, H., Huang, W., Chuang, T., 2005. Spinal cord implantation with acidic fibroblast growth factor as a treatment for root avulsion in obstetric brachial plexus palsy. J. Chin. Med. Assoc. 68, 392–396. https://doi.org/10.1016/S1726-4901(09) 70182-0.
Metz, G.A., Merkler, D., Dietz, V., Schwab, M.E., Fouad, K., 2000. Efficient testing of motor function in spinal cord injured rats. Brain Res. 883, 165–177. https://doi.org/
10.1016/s0006-8993(00)02778-5.
Neckel, N.D., Dai, H., Bregman, B.S., 2013. Quantifying changes following spinal cord injury with velocity dependent locomotor measures. J. Neurosci. Methods 214, 27–36. https://doi.org/10.1016/j.jneumeth.2013.01.008.
N´ogr´adi, A., Vrbova, G., 1996. Reinnervation of denervated hindlimb muscles by axons of grafted motoneurons via the reimplanted L4 ventral root. Neurobiol. (Bp) 4, 231–232.
N´ogr´adi, A., Vrbov´a, G., 2001. The effect of riluzole treatment in rats on the survival of injured adult and grafted embryonic motoneurons. Eur. J. Neurosci. 13, 113–118.
https://doi.org/10.1046/j.0953-816x.2000.01362.x.
N´ogr´adi, A., Szabo, A., Pint´ ´er, S., Vrbov´a, G., 2007. Delayed riluzole treatment is able to rescue injured rat spinal motoneurons. Neuroscience 144, 431–438. https://doi.org/
10.1016/j.neuroscience.2006.09.046.
Perrot, O., Laroche, D., Pozzo, T., Marie, C., 2009. Quantitative assessment of stereotyped and challenged locomotion after lesion of the striatum: a 3D kinematic study in rats. PLoS One 4, e7616. https://doi.org/10.1371/journal.pone.0007616.
Pint´er, S., Gloviczki, B., Szab´o, A., M´arton, G., N´ogr´adi, A., 2010. Increased survival and reinnervation of cervical motoneurons by riluzole after avulsion of the C7 ventral root. J. Neurotrauma 27, 2273–2282. https://doi.org/10.1089/neu.2010.1445.
Sinclair, J., Hebron, J., Taylor, P.J., 2014. The influence of tester experience on the reliability of 3D kinematic information during running. Gait Posture 40, 707–711.
https://doi.org/10.1016/j.gaitpost.2014.06.004.
Xu, N., Åkesson, E., Holmberg, L., Sundstr¨om, E., 2015. A sensitive and reliable test instrument to assess swimming in rats with spinal cord injury. Behav. Brain Res. 291, 172–183. https://doi.org/10.1016/j.bbr.2015.05.004.