THESES OF DOCTORAL (Ph.D.) DISSERTATION UNIVERSITY OF WEST-HUNGARY
FACULTY OF AGRICULTURE AND FOOD SCIENCES MOSONMAGYARÓVÁR
DEPARTMENT OF POULTRY AND PIG BREEDING
Chairman of the PhD School:
Prof. Dr. SCHMIDT JÁNOS DSc
Subprogram leader:
Kovácsné Prof. Dr. GAÁL KATALIN CSc Supervisor:
Kovácsné Prof. Dr. GAÁL KATALIN CSc
EXAMINATION OF HEMATOLOGICAL VALUES IN THE NATIVE YELLOW HUNGARIAN BREED
VITINGER EMŐKE
Mosonmagyaróvár 2005
Content
Pages
1. Introduction 3
2. Materials and Methods 4
3. Results and discussion 6 3.1. Measurement of blood parameters of the Yellow
Hungarian breed 6
3.2. Sex differences of haematological parameters 8 3.3. Significant differences among Yellow Hungarian
strains 9
3.4. Results of blood plasma analysis 10 3.5. Results and discussion of Thorn test 11 4. New scientific results 14 5. Scientific paper publications and lectures in the
topic of dissertation 15
1. Introduction
In the past decades native domestic species are threatened by extinction in most of the developed countries. Conservation of the wildlife species receives global attention because of the large numbers of species presently in decline. Less known are the needs for conservation the population of domesticated animals.
Domesticated animals are bred to satisfy the global food production needs. Animals are taken out from their natural environment and utilized one-sidedly. Therefore, animal breeding has been functioning professionally nowadays. These industrial breeding techniques have led to the diminished variety, weak capacity for adaptation and decreased production.
Continued increases in animal production require improved varieties, and animal improvement is certainly dependent upon genetic diversity. The local, native breeds usually had one or more adapting characteristics to their living environment in the past. They became strong, had good tolerance and resistant to diseases. The genetic stock of these breeds can be used to refresh the genetic stock of the ‘industrial animals’. Because of the mentioned reasons, preservation and utilization of genetic resource of local breed is one of the research missions in animal sciences.
During the Second World War the majority of native Yellow Hungarian chickens were killed. Nevertheless, thanks to systematic breeding of some researchers, Hungarian indigenous chicken were preserved and propagated again from the 1950s. Some years later Hungarian breed were replaced by foreign hybrids of both layer and meat type chickens even on small-scale farms. Since then it has been the task of the University of West Hungary and its ancestor in Mosonmagyaróvár to maintain the strains of Yellow Hungarian breed as a gene reserve.
The maintenance of live animals is the most dependable alternative available for preserving the genetic stock. Beside preservation, the haematology and blood chemistry are not only relevant diagnostic tools but can also prove useful in conservation program.
The main objectives of this study were:
1. to establish haematological reference values (for male and female) in the 32 strains of the native Yellow Hungarian breed 2. to evaluate the significant differences between blood parameters
of:
- male and female chickens
- values of strains and the total average value of the whole female breeds
- strain by strain and parameter by parameter in the female breed
3. to investigate the effect of a single adenocorticotrop (ACTH) injection on the changes of white blood cells (WBC) and repeated ACTH injection on the changes of concentration of some metabolit (glucose, cholesterol, triglyceride, total protein) in laying hens
2. Materials and Methods
Yellow Hungarian breed of the Experimental Farm has got 32 strains signed with numbers (1-32). 157 laying hens and 31 adult cocks were used in Experiment 1. Blood samples (1 to 5 cm3 according to the number of the analysed parameters) were collected from the brachial vein using Na2EDTA solution as an anticoagulant (Fehér, 1975). RBCs, TC, hematocrit (PCV) and Hb concentration were obtained by employing a Serono Baker DF haematological cell counter of the Laboratory of Karolina Hospital in Mosonmagyaróvár. The hemimetric indices: MCV, MCH and MCHC were calculated from the RBC count, PCV and Hb concentration.
Blood smears were taken from 275 laying hens and 31 adult cocks. Slides were stained by Pappenheim method (Horváth, 1979) and total WBC and differential leucocyte counts were counted. The ratio of leucocytes to erythrocytes was determined on blood smears and WBC count was calculated from a previously determined RBC count (Leonard, 1982). Percentage of differential leucocyte count (heterophils, eosinophils, basophils, lymphocytes and monocytes) was also evaluated from the smears.
In Experiment 2, blood samples were taken from 3 laying hens in each strain (anticoagulant was heparin). Measured parameters were:
- total protein by biuret method
- protein fractions (albumin, α-, β1-, β2-, γ-globulins) by cellulose acetate electrophoresis
- glucose analysis by GOD-POD method - triglyceride by GPO-PAP method - cholesterol by CHOD-PAP method
- sodium and potassium analysis by flame emission spectrophotometry
- chloride analysis by mercury-rodanid method
- calcium analysis by krezolphtalein-komplexon method
- total phosphorus content by molibdenblue-komplexon method - magnesium and iron and TIBC analysis by spectrophotometric
komplexon method
Thirty-six laying hens were used in the first experiment of Thorn- test. Control group (9 hens) was given 0.2 cm3 saline (154 mmol/l) and experimental group (27 hens) was given 30 IU/kg ACTH injection (EXACTHIN, Kőbánya Pharmaceutical Factory, Hungary) in 0.2 cm3 sterile saline into the thigh muscle. Blood samples were obtained at 0, 0.5, 1, 2, 4, 6, 8, 12 and 24 hours after injection of ACTH or saline for measuring the total RBC count. Blood smears were taken for counting the total and differential counts of white blood cells.
In the second experiment of Thorn-test, control group (9 hens) were given 0.2 cm3 saline. Experimental group (27 hens) were given 20 IU/kg ACTH in 0.2 cm3 sterile saline for four consecutive days into the thigh muscle. Every day, six hours after the injection, blood samples were collected into tubes using Na2EDTA solution as an anticoagulant.
On Day 5, 7, 9 and 11, saline or ACTH injection were not given to hens, but blood samples were obtained from the control and experimental groups. Parameters of measurement were glucose, cholesterol, triglyceride and total protein content of plasma.
Mean, standard deviation and coefficient of variation (CV%) were calculated from levels detected in each individual, for each parameter investigated. Multiple range tests and cluster analysis were used to determine significant differences between sexes, tribes, blood parameters
and control and experimental groups of Thorn test (Sváb, 1981, Szűcs, 2002).
3. Results and discussion
3.1. Measurement of blood parameters of the Yellow Hungarian breed
The measured data of blood parameters of Yellow Hungarian chickens were compared with the next reference values of the scientific literature: Lucas et al. (1961); Mészáros (1976); Jain (1986) and Bárdos (2000).
Red blood cells
The mean number of RBCs is 2.43±0.41x10¹²/l in hens and 3.05±0.73x10¹²/l in cocks. Comparing these values to the data of Lucas et el. (hen: 2.88 to 3.0x10¹²/l, cock: 3.78x10¹²/l), Mészáros (hen:
2.72x10¹²/l, cock: 3.23x10¹²/l), Jain (2.5 and 3.5x10¹²/l) and Bárdos (3.0 and 3.8x10¹²/l) it has been concluded that the number of RBCs is at the lower end of the range presented by other authors.
White blood cells
WBC counts are very homogenous between male and female as the mean total white blood cell count in laying hens is 20.17±6.63x10⁹/l and 22.34±6.30x10⁹/l in cocks. Mészáros and Bárdos reported similar values (19.8x10⁹/l and 20.0x10⁹/l) than those of Yellow Hungarian but Lucas et al. reported a greater sexual difference. In their study total WBC count is higher in female (29.4x10⁹/l) than that of male (16.6x10⁹/l).
However, there is a considerable range in the value of WBC count according to data of Jain (12.0-30.0x10⁹/l).
Differential leucocyte count
There is a minimal difference between the number of heterophils in hens (26.36+5.63%) and cocks (27.06±7.44%). It is consistent to the findings of the mentioned authors except the result of Lucas et al. They reported lower rate (13.1%) in White Leghorn hens and higher (35.1%) in Rhode Island Red hens.
Parameters of differential leucocyte count are highly influenced by the environmental conditions. Ratio of WBC types is quite changeable as it is detected in the number of eosinophils, basophils and monocytes in Yellow Hungarian chicken. The result of eosinophils is 2.96±3.06% in hens and 3.19±4.21% in cocks.
Values of basophils are in inverse ratio to the female (1.48±1.64%) and male (0.87±1.43%). Lucas et al. and Mészáros reported similar low values (2.4% and 1.7%). According to Jain, the number of basophils is negligible but Bárdos reported as high value as 5 to 10%.
Number of lymphocytes observed in Yellow Hungarian exhibits the same tendency as basophils (hen: 63.40±8.88%, cock:
58.23±11.40%). Ratio of lymphocytes is the highest in differential leucocyte count. Similar sexual difference was detected by Mészáros (hen: 64.6%, cock: 59.1%). The other mentioned authors ranged lymphocytes between 40% and 70%.
A considerable difference between male and female was observed in the number of monocytes. Monocyte count is 5.76±5.64% in laying hens but cocks have much higher value (11.13±7.19%). The other mentioned authors observed 5 to 10% monocyte values without sexual differences between male and female.
Thrombocytes
Number of TCs is considerably higher in hens (20.88±8.85x10⁹/l) than cocks (16.07±7.71x10⁹/l). In comparison the data from the literature lower values were ascertained but Jain presented large ranges (20 and 40x109/l) for this parameter. Sexual differences were exhibited by Lucas et al. (hen: 30.8x10⁹/l, cock: 27.6x10⁹/l) in White Leghorn breed.
Mészáros observed similar but less numerous differences between the sexes (hen 26.5x10⁹/l, cock: 25.4x10⁹/l). Number of TCs is varied between large limit values as they have multiple functions (Lam, 2002).
In addition to blood clotting, these cells have the ability to phagocytize and chemotaxis.
Hemoglobin
Hb levels in Yellow Hungarian hens were considerably lower (83.16±8.75 g/l) than in cocks (133.10±10.31 g/l). The obtained value of hens was lower with 15 to 25 g/l than the measured values of Lucas et al.
in White Leghorn and Rhode Island Red laying hens. Mészáros published
higher Hb concentration (hen: 91.1 g/l, cock: 117.6 g/l) but data of Yellow Hungarian were within the range of variation reported by Jain.
Reason of the lower Hb concentration may be the time of blood sampling as it happened at the end of laying period. In laying hens, Hb concentration decreases due to the productional period (Nikinmaa, 1990).
MCV
Similar tendency can be found between sexes as the value of MCV is lower (119.42±3.38 fl) in hens and higher (125.44±1.87 fl) in cocks. These results accord well with the data of Jain. Values of MCV in birds are related linearly to body size by Hawkey et al. (1989). This phenomenon causes sexual differences between male and female.
Measurement of MCV is estimated great importance in modern hemogram as it is a constant parameter, which has not depend on nutritional conditions, age or climatic conditions (Bearhop et al., 1999).
PCV
The mean PCV values (hen: 0.29±0.05 l/l, cock: 0.39±0.09 l/l) are well within the range of 0.22-0.35 reported by Jain. Higher hematocrits have, however, been documented for hens and cocks (0.45 l/l) by Bárdos.
Lower PCV can indicate anaemia, stress, blood loss or diseases by Morton (1994). Since Yellow Hungarian breed was healthy during blood sampling, the reason of lower PCV may be the measured lower RBC count.
MCH and MCHC
These are calculated parameters counted from the measured data of RBCs. MCH are 34.22±4.42 pg/cell in Yellow Hungarian hens and 43.64±7.94 pg/cell in cocks. MCHC is 286.76±17.76 g/l in hens and 342.15±46.15 g/l in cocks. It has been documented that known of normal values of RBC and hemimetric indices (MCV, hemoglobin, PCV, MCH, MCHC) has a great importance in distinction of healthy and unhealthy bird (van Wyk et al., 1998).
4.2. Sex differences of haematological parameters
Hematological study of Yellow Hungarian breed has permitted to establish a sexual difference in the measured parameters. Results of
When sex was examined as main effect, RBCs, monocytes, hemoglobin, MCV and PCV were higher in males than those of females (P<0.001). Also, significant differences were apparent for the number of lymphocytes, thrombocytes (P<0.01) and basophils (P<0.05). The number of WBCs, heterophils and eosinophils showed no significant differences.
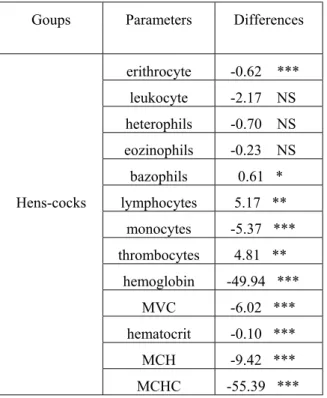
Table 1. Significant differences in blood parameters of Yellow Hungarian hens and cocks
Goups Parameters Differences
erithrocyte -0.62 ***
leukocyte -2.17 NS heterophils -0.70 NS eozinophils -0.23 NS bazophils 0.61 *
Hens-cocks lymphocytes 5.17 **
monocytes -5.37 ***
thrombocytes 4.81 **
hemoglobin -49.94 ***
MVC -6.02 ***
hematocrit -0.10 ***
MCH -9.42 ***
MCHC -55.39 ***
***P<0.001, **P<0.01, *P<0.05., NS=no significancy, MCV = mean corpuscular volume, MCH = mean corpuscular hemoglobin, MCHC = mean corpuscular hemoglobin concentration
3.3. Significant differences among Yellow Hungarian strains
Total average value (TAV) was calculated by all the data of 157/275 laying hens. Significant differences were examined between strains and TAV by discriminancy and cluster analysis to conclude the variety the genetic resources of the breed. Quantitative values (RBC, WBC, TC, Hb, MCV, and PCV) differ significantly at P<0.001 in four
strains, at P<0.01 in six strains and at P<0.05 in 8 strains no significant differences. In conclusion, evaluation of quantitative blood parameters resulted 18 strains where the values differed significantly from the TAV.
Comparing the measurement results of strains with TAV, in the values of differential leucocyte counts (qualitative values) was found less differences. 5 strains differed at P<0.001, 3 strains differed at P<0.01 and one strain at P<0.05. The other 22 strains showed no significant differences. Therefore, Yellow Hungarian breed seems to be more homogenous in the qualitative parameters. Beside these, each living creature reacts differently to the environmental conditions. This phenomenon caused large and high values in coefficient of variation, so significancy of qualitative values cannot be evaluated quite precisely.
3.4. Results of blood plasma analysis
Parameters of blood plasma were only measured by samples of 3 hens in each tribe. The number of samples did not make it possible to analyse significancy among tribes.
Plasma biochemical and electrolyte values with mean, standard deviation and coefficient of variation are showed in Table 2.
The obtained results were within the range of variation presented in the literature (reference values were shown in Part 2). They corresponded to the physiological status of hens during the laying cycle.
A slight difference could only be measured in the iron content of the plasma. The mean value of iron content of plasma tended to the lower limit of the range presented in the literature (15 and 40 µmol/l). TIBC of the Yellow Hungarian laying hens approached to the upper limit of the range presented in the literature (55 and 68 µmol/l). The low iron content and the relatively high TIBC value expect latent iron deficiency when the iron content of the plasma is still within the normal range but the signs of exhausted organism begin to develop.
Table 2. Organic and inorganic parameters of plasma in Yellow Hungarian laying hens
dimension n mean SD CV%
Total protein g/l 96 50,4 7,3 14.5
Albumin g/l 64 17,2 2,1 12.2
α globulin g/l 64 5,5 0,7 12.7
β1 globulin g/l 64 5,6 0,7 12.5
β2 globulin g/l 64 4,9 0,6 12.2
γ globulin g/l 64 17,7 4,1 23.2
A/G ratio 64 0,56 0,04 7.1
Triglyceride g/l 64 13,0 3,4 26.3 Cholesterol mmol/l 64 2,7 0,7 27.4
Glucose mmol/l 64 13,8 3,0 21.9
Sodium mmol/l 96 147,4 8,6 5.8 Potassium mmol/l 96 3,9 0,6 15.4 Chloride mmol/l 96 111,3 7,4 6.6
Calcium mmol/l 96 5,8 1,0 17.8
Phosphorus mmol/l 96 1,3 0,2 16.7 Magnesium mmol/l 96 1,1 0,1 11.1
Iron µmol/l 96 17,6 2,6 15.0
TIBC µmol/l 96 66,1 5,4 8.2
n=number of sampled hens, A/G: albumin/globulin ratio, TIBC: total iron binding capacity
3.5. Results and discussion of Thorn test
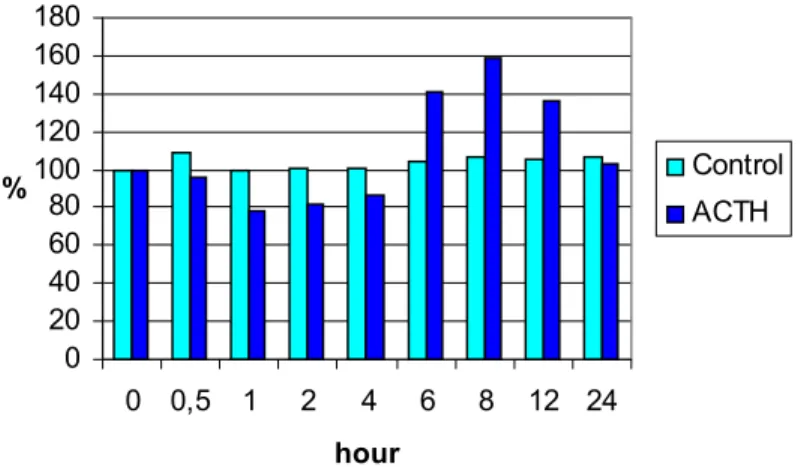
In Experiment 1 the changes of WBCs and differential leucocyte types was measured after an injection of saline in control and ACTH in experimental group. Results are shown in Diagram 1. Number of WBCs slightly elevated ½ hour after the saline injection but remained unchanged afterwards. This initial increase was probably caused by the injection itself. The WBC response to ACTH injection was biphasic.
There was a decrease in the number of leucocytes after one hour of ACTH injection and remained so for several hours. Then a sharp increase
could be measured at 6 hour and values of control and experimental goups differed significantly (P<0.001). The maximum level of ACTH- treated group was observed at 8 hour after the ACTH injection.
Decreasing of WBC number in experimental group continued progressively and probably reached the normal range some hours later.
Figure 1. Effect of an ACTH injection on the number of blood leucocytes (x109/l)
0 20 40 60 80 100 120 140 160 180
0 0,5 1 2 4 6 8 12 24 hour
% Control
ACTH
The initial decrease of WBCs in ACTH treated group was probably caused by lymphocytopenia (Siegel, 1995). Decreasing was the largest after 4 hour of ACTH injection. WBC values increased during the next hours because of the sudden increase of heterophils.
A variety of stressors (restraint, environmental climatic conditions, feed and water deprivation, diseases, handling, etc.) probably induce similar alterations as the ACTH treatment. Therefore, changes in WBC count appear to be an early and sensitive indicator of the stress conditions.
The aim of Experiment 2 was to investigate the changes of metabolism in response of stress parameters.
Glucose levels of control hens exhibited a small increase between Day 3 and 5 (17,0 mmol/l). It was probably caused by the stressor of consecutive handlings (twice a day). ACTH treatment exhibited elevated
differed significantly (P<0.01) from the control group. Between Day 2 and 5 the difference increased consistently (25,4-26,7 mmol/l) at P<0.001 differences between control and experimental group. From Day 5 glucose levels began to decrease and gradually returned to the range of control group. On Day 11 glucose level of experimental group was already lower (12,6 mmol/l) compared to control group.
ACTH caused similar changes in plasma cholesterol content compared with the changing of glucose levels. On Day 4 and 5 a subtle increase was obtained in control group (3,4 mmol/l) comparing with the initial value on the first day. Values of standard deviation and coefficient of variation also exhibited a small increase. These slight changes were probably caused by the consecutive handlings (injections, blood sample collections), as birds could not get accustomed to the repeated handlings (Freeman et al., 1975).
Cholesterol value of ACTH treated group elevated on Day 2 (from 2.7 mmol/ to 3.6 mmol/l) and this difference was significant (P<0.05). There was a further increase on Day 3 and 4 (3.7 mmol/l and 4.1 mmol/l) at P<0.01 and P<0.001 significancy. On Day 5 after cessation of ACTH treatment, cholesterol level began to decrease (3.6 mmol/l, P<0.05) and on Day 7 it returned to the normal range.
Triglyceride value of ACTH treated group began to increase only on Day 3 (13.5 g/l, P<0.05) compared to control birds. On Day 4 and 5 there were further increases with higher significant differences (15.9 g/l and 16.3 g/l, P<0.001). Then a slow, gradual decline was observed but triglyceride content was even higher on Day 11 compared to that of control group. Triglyceride mobilization is started after draining glycogen reservoir in the liver. Therefore, triglyceride content could not be used as an early indicator of stress.
Total protein content of plasma showed the less notable changing in ACTH treated group. The first slight significant difference between control and experimental groups was observed on Day 2 (53.2, P<0.05).
Differences enhanced on Day 3 and 4 (60 g/l, P<0.01) but on Day 5 plasma protein showed a tendency to decline (52.5, P<0.05) and on Day 7 and 9 values were lower compared with the control value.
Changing of total protein content is influenced by more factors.
ACTH treatment increases the level of corticosterone in blood, which results the increase of protein synthesis in the liver. At the same time gluconeogenesis is started accompanied by an increase in the rate of
protein degradation and glucogenetic amino acids serve as the starting molecules of glucose synthesis.
In conclusion, repeated administration of ACTH induced physiological responses with metabolic changes. The obtained set of results from the Yellow Hungarian breed can serve as reference values to evaluate harmful stress effects in the future.
4. New scientific results
1. Haematological and plasma chemical parameter (up to 31 parameters) were established and clarified in the Yellow Hungarian breed. These data are important, as they are the first report of the hematophysiological parameters of this native specific breed. These set of reference values can assist as indicators of variations in health status, as well as serve the maintenance of the breed.
2. Measurement of RBCs and hemimetric indices (MCV, Hb, PCV, MCH and MCHC) were established and can serve as relevant diagnostic tools and sensitive indicator of bird’s general health that can detect the latent abnormalities.
3. Significancy and cluster analysis among strains parameter by parameter exhibited numerous differences. These results can prove that despite of the inbreeding and long-term selecting stocks, this breed possesses dependable genetic variance.
4. Increased H/L ratio (from 0.50 to 0.90 or more) in Thorn test can be used as an early indicator of stress and indicates the immunosuppressive effect of stressors. The repeated administration of ACTH induced physiological responses with metabolic changes. The obtained set of results can serve as reference values to evaluate harmful stress effects in the future.
5. Scientific paper publications and lectures in the topic of dissertation
1. Scientific publications:
Vitinger E.(1996): Effect of an ACTH Injection on Peripheral Blood LeucocytePopulations in Yellow Hungarian Laying Hens.
Acta Agronomica Óváriensis. Vol.37.No.1.p.45-49.
Vitinger E.(1996): Az őshonos sárga magyar tyúkfajta kvantitatív és
kvalitatív vérképe.
Állattenyésztés és Takarmányozás. Vol. 45. 5. p. 465-471.
Vitinger, E., Kovácsné Gaál, K., Vitinger, N., Orbán, A.: Blood biochemistry values in Yellow Hungarian laying hens Állattenyésztés és Takarmányozás (accepted)
Vitinger, E., Kovácsné Gaál, K., Vitinger, N., Szalka,É.: Physiological responses to repeated ACTH injections in Yellow Hungarian laying hens
Acta Agraria Kaposváriensis (accepted) 2. Dissertation
Vitinger E.(1995): Vérképvizsgálatok az őshonos sárga magyar tyúkállományban.
Doktori disszertáció.
3. Lecture:
Vitinger, E., Kovácsné Gaál, K., Bakcsa, F. (2004): Egyes
vérparaméterek stabilitásának vizsgálata az őshonos sárga magyar tyúkállományban.
XXX. Óvári Tudományos Napok, 2004. október 7.
Mosonmagyaróvár