1
Redistributive and Developmental Policies of the Brazilian State during the World Economic Upswing
Annamária Artner
1Abstract
This article forms a part of a longer study that deals with the developmental problems of the peripheries in the global hierarchical world economy. This part of the research introduces the economic and social policies of semi-peripheral Brazil under the Lula era, the most successful catching-up period of the largest Latin-American country after the Second World War. The research questions were how the government influenced domestic consumption and investments in the period of the world economic expansion, and how efficient these policies were in increasing the Brazilian economic growth and mitigating the historically deep poverty and inequality. The article concludes that the developmentalist and redistributive government policies could not have had meaningful positive results if beneficial world economic circumstances had not made it possible by facilitating export and production.
Keywords: Brazil, income distribution, role of state, periphery, world system.
Introduction
The years of the so called “Pink Tide” of Latin America began in the 1990s. In these years, left-wing governments got to power in several countries of the sub-continent. Luiz Inácio Lula da Silva, son of a working-class family with many children and one of the founders of the Partido dos Trabalhadores (Workers’ Party, 1980), won the presidential elections amidst this tide, in 2002, and served two terms as President, until the end of 2010. After finishing the stabilisation program led by the IMF on the bases of an earlier agreement, Lula initiated an economic and social policy turn which aimed at serving the
1 Dr. Habil. Annamária Artner, C.Sc. is an economist, senior research fellow at the Institute of World Economics of the Centre for Economic and Regional Studies and college professor at Milton Friedman University, Budapest. Email: artner.annamaria@krtk.mta.hu.
2
interests of the Brazilian working-class. This meant the refusal of the neoliberal,
„corporate-governance-like”, i.e. strictly profit-oriented management of the domestic economy, and the replacement of that with a more people-oriented, income-redistributive course. Lula was succeeded by Dilma Rousseff between 2011 and 2017, who continued Lula’s policies, albeit with less success. The reason for this was that in that time the world economic circumstances have become unfavourable. The longer-term world-economic embeddedness of Brazil is detailed by Artner (2013 and 2019).
The economic cycles of the old and emerging centre economies, i.e. the United States, Europe and China have largely determined the playing field of successive Brazilian governments, mainly through the expansion of export markets. For the Brazilian socio-economic successes this world economic upswing constituted the necessary condition. The sufficient condition was the left-wing socio-economic policy initiated by Lula and continued by Rousseff. Below, we will discuss these policies.
Income Redistribution
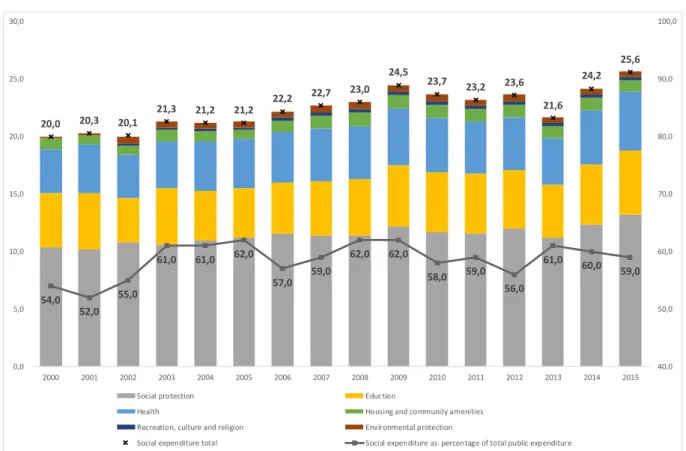
As an indicator of the redistribution policy we begin with social expenditures. Between 2002 and 2009, these grew from 20.1 per cent to 24.5 percent of the GDP, and after a period of decline due to the crisis, they reached 25.6 in 2015 (see Figure 1). All sub- groups of the total social expenditures grew as well, including healthcare, education and social security. These covered the costs of government programmes such as the scholarship programme launched in 2005 for poverty-stricken families’ children to increase their participation in higher education, the programme for the improvement of access to drinking water, or the programme to prevent juvenile pregnancy and child labour, etc., which reflect that the Lula regime aimed at elaborating a complex social policy system (Lehoczki, 2011: 43).
3
Figure 1. Brazil, social expenditure of the public sector, 2000-2015 (percentages of GDP and of total public expenditure) Source: CEPAL. Database on Social Investment in Latin
America and the Caribbean. Brazil. At
https://observatoriosocial.cepal.org/inversion/en/countries/brazil (accessed on 21 May 2020).
In the post-crisis years (after 2008), not only did the governments maintain active social and budgetary policy but increased and complemented those with employment- stimulating transfer programmes, focusing on kids’ schooling and access to healthcare.
As the UN special agency, the Economic Commission for Latin America and the Caribbean, stated: this strategy reflected the recognition that it is exactly in times of crisis and economic downturns that social policies need to be strengthened and their resources increased (ECLAC, 2011: 132). This view is contrary to the Bretton Woods twins’ (IMF and World Bank) restrictive and budgetary rigour-based „austerity” policies.
During Lula’s presidency, besides the rise of minimal wages that affected the lives of 48 million people (this is the number of wageworkers whose wage is calculated based on the minimal wage – Bruha, 2015), cash-transfer programmes were launched and the ongoing social projects (social pension, allocation for elderly and sick people, measures aiming at decreasing child labour, etc.) were widened. The most famous among them is
20,0 20,3 20,1
21,3 21,2 21,2
22,2 22,7 23,0
24,5 23,7 23,2 23,6 21,6
24,2 25,6
54,0 52,0
55,0
61,0 61,0 62,0 57,0
59,0
62,0 62,0
58,0 59,0 56,0
61,0 60,0 59,0
40,0 50,0 60,0 70,0 80,0 90,0 100,0
0,0 5,0 10,0 15,0 20,0 25,0 30,0
2000 2001 2002 2003 2004 2005 2006 2007 2008 2009 2010 2011 2012 2013 2014 2015
Social protection Eduction
Health Housing and community amenities
Recreation, culture and religion Environmental protection
Social expenditure total Social expenditure as percentage of total public expenditure
4
the program “Bolsa Familia” that reached 14 million families, i.e. cca. 50 million people (26 per cent of the Brazilian population, while 70 per cent of Brazilians live under 2.5 USD/day) by 2014. The budgetary envelope of these social transfer programmes was not revised even under the major restrictions in 2015.
Social stability and economic growth have also been supported by initiatives to strengthen state apparatus and controlling effectiveness (tax income rose, slave-like labour2 decreased, labour market protection for workers improved, etc.), subsidised credit lines to agrarian families, and lower interest rates in general (Beghin 2008:5).
From 2003 to 2009, the Gini index, which measures the degree of inequality in the distribution of income, decreased from 59.3 per cent to 53.9 per cent and the trend continued (2015: 51.3 per cent). The number of people living under the poverty line dropped from 24 to 9 per cent, the number of people living in absolute poverty (living on less than 1.25 USD/day) dropped from 10 to less than 4 per cent. 30 million people were lifted from poverty in less than a decade.3
However, we must not forget that the expansion of social policy and the increase of social cash transfers could be financed by growing taxes from a growing GDP and that Bolsa Familia was supported by the World Bank’s soft loans as well (WB, 2010).
Nonetheless, the policy turn was exceptional. In previous decades, income reallocation did not favour the poor: money actually flowed back to where it came from – in what we call „perverse redistribution”. The Lula course changed these trends, which is also reflected in the change of the tax policy.
In 2009, Brazilian companies paid 69 per cent of their pre-tax profits for the state in the form of taxes and contributions while this amount in the US was only 46.8 per cent and in Hungary 53.3 per cent, and in Canada 29.2 per cent.4 In the following years, this Brazilian „advantage” further grew, since, under Lula and Rousseff, Brazil did not take part in the tax-and-contribution-decreasing “contest”5. The share of taxes on income,
2 Although slavery was abolished in Brazil in 1888 by law, quasi-slavery and coercive labour of vulnerable people lives on, especially in isolated, inner agricultural holdings (fazendas) rendering the complete abolition of this practice difficult.
3 World Bank DataBank Online. World Development Indicators, Brazil http://databank.worldbank.org/data//reports.aspx?source=2&country=BRA&series=&period=#
4 Although in some Latin-American countries this ratio is higher (e.g. in Argentina: 108.2 per cent, in Bolivia: 80 per cent), the rest of the BRICS countries fare far better: China at 63.5 per cent, India at 63.3 per cent, Russia at 46.5 per cent, South-Africa at 30.5 per cent (WB- PWC 2011: 98-100).
5 In 2016, taxes were the following: Brazil, 68.4 per cent; USA, 43.8 per cent; Hungary, 46.5 per cent;
Canada, 20.9 per cent; Argentina, 106 per cent; Bolivia, 83.7 per cent; China, 67.3 per cent; India, 55.3 per cent; Russia, 47.5 per cent; South Africa, 28.9 per cent (WB-PWC 2018:88-91).
5
profits and capital gains within total taxes substantially grew from 36 per cent to 47 per cent between 2004 and 20096, which, together with poverty alleviation programmes, refer to the decrease of “perverse redistribution”.
Souza & Medeiros (2013) examined household income elements and their effects on inequality between 2003 and 2009, and concluded that the Gini index reduced mainly due to labour market inequality decrease. Although state-related income flows were lifted from 25 to 29 percent of the disposable income of households, their role in declining income inequality reached only about one-third. Social assistance transfers were the most effective, being in 20 per cent responsible for decreasing income inequality, followed by social security pensions (10%), unemployment benefits (8%) and direct tax changes (5%) – these made up 43 percent of the effect mitigating income inequality. However, public servants’ wages used to be and stayed highly unequal, and were in 10 per cent responsible for countering the positive trend, and their negative effect disrupted Bolsa Familia’s positive effects one-to-one. All in all, Lula’s cash transfers resulted rather in “gradual or marginal improvement” (Souza & Medeiros 2013:26) than in complex reform that would have changed the historical nature of the Brazilian state redistribution system.
Some experts argue that Brazilian growth was spurred by domestic demand after 2002, especially by the rising consumption of households (IMF 2013:15-16, Oxford Economics 2012, Ricz & Nagy 2016). Our research, based on World Bank data7, does not corroborate this assumption. In fact, the weight of household consumption within GDP decreased further – as part of a trend that started in 1997 – after 2002, albeit at a slower pace. In 2005, this ratio increased a bit, and then continued decreasing and reached a lower level in 2008 (59.7 per cent) than in 2004. Household consumption within GDP rose from 2009 to 2013 (producing a spike in 2009) to reach 61.7 per cent in 2013 (still lower than in 2002). In 2014 and in the two consecutive crisis years, it continued to grow and reached 64 per cent in 2016 (lower than in 2001).
Therefore, the differentia specifica of the 2004-2011 catching up period was not at all the rising proportion of household consumption or a general growth in domestic consumption. Instead, it was – besides the upswing of the export market – the increased economic role of the state. We will analyse this role in the next chapter.
6 World Bank DataBank Online. World Development Indicators https://data.worldbank.org/country/brazil
7 World Bank DataBank Online. World Development Indicators https://data.worldbank.org/country/brazil
6 Role of the State in the Economy
Brazilian state investments decreased from 2002 to 2003 due to the execution of the IMF- programme but increased dynamically later, especially after 2007. The Lula government reactivated industrial policy already during its first term (2003-2006) (industrial policy was put on hold after the 1983 neoliberal IMF-led turn, similarly to other Latin-American countries).
In 2005, the government launched an experimental infrastructural programme (PPI) and in 2007 it started the Growth Acceleration Programme (PAC). The entire amount devoted to PAC between 2007 and 2010 was 504 billion BRL (236 billion USD), but was raised during the crisis to 638 billion BRL, and a second phase was launched in 2011 with a target amount of 959 billion USD to be spent until 2014. The total planned budget of PACs reached 880 billion USD, but the real spending amounted to 40 per cent higher at the end. Most investments (85-90 per cent of all investments) were private (BNDES, 2016).
Reviving industrial policy also meant that the government provided soft loans for priority sectors through the state developmental bank (BNDES). This was the very same bank whose experts argued for domestic development priorities already in the 1990s.
BNDES loans reached 2.2 per cent of GDP in 2005 and surmounted 4 per cent of GDP by 2010 to register a slight decline and reach almost 4 per cent of GDP by 2013 (190.4 billion BRL). Later on, during the crisis years, the amount of BNDES-loans decreased (2016: 88.3 billion BRL – BNDES, 2016).
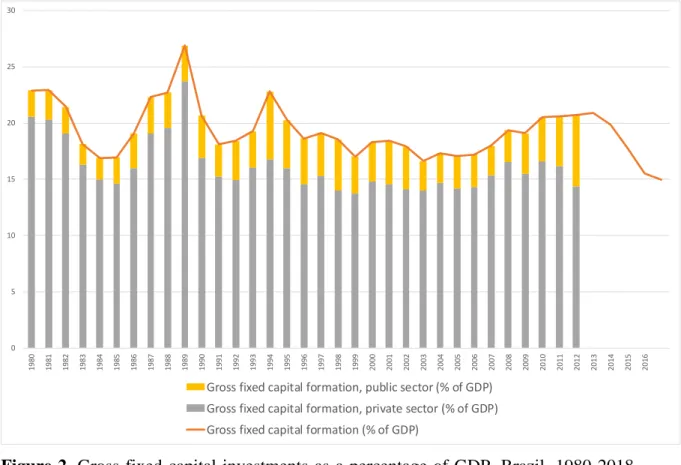
This backdrop helped economic actors to exploit favourable world economic circumstances. GDP growth accelerated (in 2007, it was over 6 per cent), while 6 million new jobs were created, the budgetary deficit remained manageable, unemployment decreased year by year, similarly to the external indebtedness to GDP ratio, and the current account deficit turned into surplus. Exports grew dynamically, although its ratio to GDP decreased, and imports increased as well. From 2008 on, thus, the balance of trade showed a deficit. Due to the decrease of export surplus, commodity and service trade contributed to GDP-growth negatively from 2006. The domestic market became the engine of growth. The investments to GDP ratio increased from 16.9 per cent in 2003 to 21.6 per cent in 2008, and, apart from the crisis year of 2009, it maintained a similar level until 2013 (Figure 2). Fixed investments were led by the private sector (boosted by soft loans provided through the state development bank), and the state investments to GDP ratio only started growing after the crisis, as a compensation for halting private
7
investments (see the growing sum of the PAC envelope), reaching and surmounting 2002 levels only after 2009.
Figure 2. Gross fixed capital investments as a percentage of GDP, Brazil, 1980-2018.
Source: The World Bank, World Development Indicators https://data.worldbank.org/country/brazil.
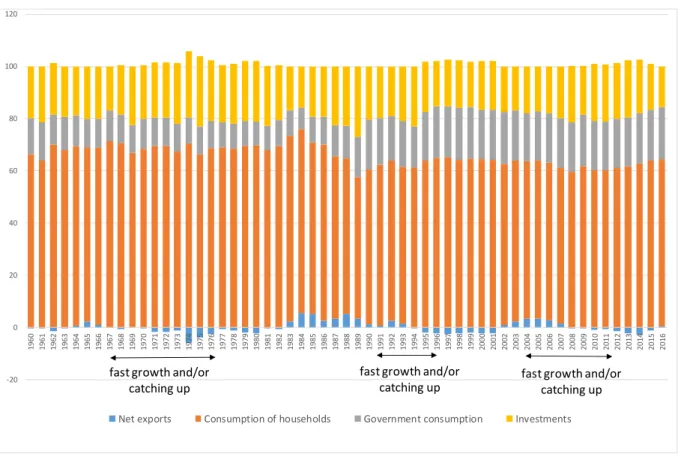
Figure 3 shows how Brazilian GDP was used from 1960 to 2016. This diagram draws our attention to the fact that during the “market-led”, “export-oriented” phase after 1980, state spending within GDP grew, and, further, that external imbalances are recurring in Brazil’s economic history (years of negative net export). Our earlier research (Artner 2019) about the catching-up periods of Brazil – on the bases of the GDP per capita – proved that although there is no direct overlapping between export surplus or deficit and growth acceleration/catching-up periods, there has been no successful period that would have built exclusively on export-oriented years (i.e. when the trade balance was in surplus). There is, however, such a success period, namely in the 1970s, which was characterized by negative trade balance from the beginning to the end. We can also see that catching-up periods started with export surplus (1991-96, 2004-2011), while they always ended in negative trade balance. These phenomena allow us to conclude, that for
0 5 10 15 20 25 30
1980 1981 1982 1983 1984 1985 1986 1987 1988 1989 1990 1991 1992 1993 1994 1995 1996 1997 1998 1999 2000 2001 2002 2003 2004 2005 2006 2007 2008 2009 2010 2011 2012 2013 2014 2015 2016
Gross fixed capital formation, public sector (% of GDP) Gross fixed capital formation, private sector (% of GDP) Gross fixed capital formation (% of GDP)
8
catching up, external resources are necessary, but the use of external resources leads to domestic and external imbalances, that put an end to the catching up phase.
Figure 3. Brazil’s GDP by consumption 1960-2016, percentage. Source: The World Bank, World Development Indicators https://data.worldbank.org/country/brazil.
Table 1. Average distribution of Brazilian GDP and GDP-growth during dynamic growth and/or catching-up periods. Source: Author’s own calculations based on The World Bank, World Development Indicators https://data.worldbank.org/country/brazil.
1967-1976 1991-1996 2004-2011
of GDP total (%)
net exports -2.8 -1.6 0.6
investments 23.6 19.1 20
consumption of households 68.6 64 60.4 consumption of government 10.5 18.6 19
(consumption total) 79.1 82.6 79.4
of GDP-growth (%)
net exports -2.5 -2.2 -2.7
-20 0 20 40 60 80 100 120
1960 1961 1962 1963 1964 1965 1966 1967 1968 1969 1970 1971 1972 1973 1974 1975 1976 1977 1978 1979 1980 1981 1982 1983 1984 1985 1986 1987 1988 1989 1990 1991 1992 1993 1994 1995 1996 1997 1998 1999 2000 2001 2002 2003 2004 2005 2006 2007 2008 2009 2010 2011 2012 2013 2014 2015 2016
Net exports Consumption of households Government consumption Investments fast growth and/or
catching up
fast growth and/or catching up fast growth and/or
catching up
9
investments 23.2 17.3 25
consumption of households 68.8 65.2 59.3 consumption of government 10.5 19.8 18.4
(consumption total) 79.3 85 77.7
Based on the above, we can answer the question of what the major engine of growth was during the Lula era. Table 1 shows the average structure of GDP use in the catching-up periods, along with the structure of GDP increase. As it appears, between 2004 and 2011, both within the GDP and within its increase, the proportion of household consumption is less than in the previous catching-up periods (1967-76 and 1991-96). Between 2004 and 2011, net exports (due to the first half of this period) and government consumption were of major importance compared to the two other catching-up periods – the weight of government consumption growth is especially interesting when compared to its pre-1980 level.
The composition of GDP increase tells us more about the engine of growth. This testifies to the importance of investments, partly due to the world economic upswing, and partly also to state industrial policy and, indirectly, its consumption-multiplier effect.
Conclusion
As the Brazilian example illustrates, both liberal (export-led) and state-led (domestic market-oriented) economic policies emerge at the end of cycles with the aim to remedy external and domestic imbalances accumulated previously, but, in the end, they walk a path similar to that of their predecessors. The key question is the weak profit-producing capacity of periphery capital, which is reproduced by the logic of the global cycles of accumulation – led by the centre – and poses an obstacle to accumulation on the peripheries and in the way of their catching up to developed countries (Artner 2018).
Brazil was successful in catching up during the import substitution period after the Second World War, during the 1990s and under Lula. The first catching-up period was ended by the oil price explosion crisis in the 1970s and resulted in tje decreasing role of the state in managing the domestic economy, in the “opening” of the economy, and in increasing the export ratio. The next catching-up (in the 1990s), during which the export ratio decreased, ended with the burst of the US-led dotcom bubble in 2000-2001. The change in the prevailing discourse was the revaluation of the role of the state, first in the
10
social sphere (2002-2006), and then, after 2007, in managing the domestic economy. This phase did not end due to “wasteful social spending”. After the 2008 global financial crisis and the end of the growing period of commodity prices (the “commodity super-cycle”) in 2011, the Brazilian government tried to fuel growth by investments — a reasonable move.
However, at the lowest point of the commodity cycle and the 2015-2016 drop in world trade, the crisis hit, and gave way to criticism of the current government and a new turn towards the neoliberal agenda that – under the disguise of budgetary rigour – corrected the previous redistribution system that was somewhat shifted in favour of the working class under the Labour Party presidents.
We can conclude that the global accumulation cycles of the hierarchic world system designate each nation-state’s position and limit their development and the room for manoeuvre of governments. The developmentalist and redistributive government policies of Brazil could not have had meaningful positive results if beneficial world economic circumstances had not made it possible by facilitating export and production.
The recent political turn in Brazil, which began with Rousseff’s fall and ended in the Presidency of the right wing Jair Bolsonaro, proves that an economic and social policy against profitability is not sustainable in the long term, especially not in (semi-)peripheric countries, which have less of a opportunity to transfer this burden to other countries where both wages and taxes are lower.
References
Artner, Annamaria (2013): A perifériás fejlődés anatómiájához – Brazília. [The Anatomy of then peripheral development – Brazil] Eszmélet No 98, nyár pp. 69-90.
Artner, Annamaria (2018): Is Catching Up Possible? The Example of Central and Eastern Europe. Science & Society, 82(4), pp. 502–530
Artner, Annamaria (2019): Brazília korunk világrendszerében. [Brazil in the world system] Statisztikai Szemle 97(1) pp. 5-44.
Beghin, Nathalie (2008): Notes on Inequality and Poverty in Brazil: Current Situation and Challenges. Background paper to the development of From Poverty to Power:
How Active Citizens and Effective States Can Change the World, Oxfam International 2008. http://policy-practice.oxfam.org.uk/publications/notes-on- inequality-and-poverty-in-brazil-current-situation-and-challenges-112516 BNDES (2016): Annual Report 2016. The Brazilian Development Bank. The Departmant
of Communication and Dissemination of Knowledge. May.
11
https://www.bndes.gov.br/SiteBNDES/export/sites/default/bndes_pt/Galerias/Ar quivos/empresa/RelAnual/ra2016/RA_2016_INGLES_final.pdf
Bruha, Patrick (2015): Minimum Wage in Brazil. The Brazil Business. 3 June, 2015.
http://thebrazilbusiness.com/article/minimum-wage-in-brazil
CEPAL. Database on Social Investment in Latin America and the Caribbean. Brazil.
https://observatoriosocial.cepal.org/inversion/en/countries/brazil
ECLAC (2011): Social Panorama of Latin America. 2010 Economic Commission for Latin America and the Caribbean (ECLAC). March 2011 ISBN 978-92-1-121754-
4 http://www.cepal.org/cgi-
bin/getProd.asp?xml=/publicaciones/xml/1/41801/P41801.xml&xsl=/dds/tpl- i/p9f.xsl&base=/tpl-i/top-bottom.xsl
IMF (2013): Brazil. IMF Country Report No. 13/313. 2013 Article Iv Consultation.
Selected Issues. October.
https://www.imf.org/external/pubs/ft/scr/2013/cr13313.pdf
Lehoczki, Bernadett (2011): A felemelkedés mátrixa –Brazília a Lula-érában. [The matrix of advancement – Brazil in the Lula era] Köz-Gazdaság 6(1) pp. 37-56.
Ricz, Judit – Nagy, Sándor Gyula (2016): A brazil gazdasági válság: helyzetkép, okok és kiutak. [The Brazilian economic crisis: situational picture, reasons and ways forward] Külügyi Szemle 15 (3) pp. 94-120.
Souza, Pedro, H.G.F. – Medeiros, Marcelo (2013): The Decline in Inequality In Brazil, 2003-2009: Role Of The State. IRLE Working Paper No 154-13, Institute for Research on Labour and Employment. University of California, Berkeley.
https://escholarship.org/content/qt33q062zj/qt33q062zj.pdf
The World Bank, World Development Indicators, Brazil.
https://data.worldbank.org/country/brazil
WB (2010): Brazil’s Landmark Bolsa Família Program Receives US$200 Million Loan.
The World Bank Press release, September 17
http://www.worldbank.org/en/news/press-release/2010/09/17/brazils-landmark- bolsa-familia-program-receives-us200-million-loan
WB-PWC (2011): Paying Taxes 2011. The Global Picture. The World Bank Group,
PricewaterhouseCoopers International Limited.
http://www.pwc.com/gx/en/paying-taxes/pdf/paying-taxes-2011.pdf
WB-PWC (2018): Paying Taxes 2018. Thirteen years of data and analysis on tax systems in 190 economies: A look at recent developments and historical trends. The World
12
Bank Group, PricewaterhouseCoopers International Limited https://www.pwc.com/gx/en/paying-
taxes/pdf/pwc_paying_taxes_2018_full_report.pdf?WT.mc_id=CT13-PL1300- DM2-TR 2-LS1-ND30-TTA4-CN_payingtaxes-2018-intro-pdf-button