Ranking the Key Areas for Autonomous Proving Ground Development Using Pareto
Analytic Hierarchy Process
SZABOLCS DULEBA1, TAMÁS TETTAMANTI 2, ÁDÁM NYERGES 3, AND ZSOLT SZALAY 3
1Department of Transport Technology and Economics, Faculty of Transportation Engineering and Vehicle Engineering, Budapest University of Technology and Economics, 1111 Budapest, Hungary
2Department of Control for Transportation and Vehicle Systems, Faculty of Transportation Engineering and Vehicle Engineering, Budapest University of Technology and Economics, 1111 Budapest, Hungary
3Department of Automotive Technologies, Faculty of Transportation Engineering and Vehicle Engineering, Budapest University of Technology and Economics, 1111 Budapest, Hungary
Corresponding author: Ádám Nyerges (adam.nyerges@gjt.bme.hu)
This work was supported in part by the Ministry of Innovation and Technology National Research, Development and Innovation Office (NRDI) within the framework of the Autonomous Systems National Laboratory Program and in part by Magyar Tudományos Akadémia (MTA) Bolyai Research Scholarship under Grant BO/8/20.
ABSTRACT Autonomous or highly automated road vehicles and all related technologies are under intensive research and development. Moreover, internationally a massive investment increase can be observed in the automotive industry. According to this megatrend, new automotive test tracks appear or older ones transform to be capable of testing and proving for autonomous vehicles. Therefore, the question emerges: what are the key areas for automated drive development, which must be financed in case of autonomous proving ground design? It is a real challenge to be able to make the right decisions due to a lack of numerous experiences in this field. In this research, experts of automated driving technology have been surveyed and their opinion and knowledge have been synthesized. As a strong purpose of gaining robust results, the conventional AHP has been amended by the Pareto approach to ensure that the derived weights correspond to the expert scoring intention so perfectly that it cannot be more improved. Since the non-Pareto optimal weight results might cause rank reversal in the final prioritization, the applied Pareto test guarantees that the final outcome reflects the expert evaluators’ incentive. The conducted analysis has indicated that the obtained results are robust not only from the sensitivity point of view but also from the Pareto optimality approach. The proposed hierarchical decision model is therefore applicable to assist decision making for autonomous proving ground developments. The main contribution of the article, however, is to present the first reliable prioritization of the autonomous proving ground elements to extend the body of professional knowledge.
INDEX TERMS Automotive proving ground, autonomous and highly automated vehicles, analytic hierarchy process, optimal decision making, autonomous test track development.
I. INTRODUCTION
Thanks to the widespread automation in all fields of science and technology, also road vehicles are manufactured with a growing number of automated features or subsystems. This global trend is also amplified by the general motivation called sustainable transportation which aims to reduce environmen- tal impacts (energy consumption, emission, etc.), mitigate congestion, and improve social well-being [1]. In our days, it is an important research field to analyze the changes that will
The associate editor coordinating the review of this manuscript and approving it for publication was Jesus Felez .
be experienced by autonomous driving [2], [3]. More atten- tion has to be paid to the testing of the interaction between the different road users and typically to the vulnerable road users [4], [5]. The most important expected outcome of automated cars is the improvement of road traffic safety. The majority of accidents (app. 95%) are produced by human imperfection.
By contrast, autonomous driving technology could eliminate 90% of road traffic accidents [6]. To reach future objectives it is necessary to increase the level of automation of road vehicles and road transport infrastructure. Automated vehi- cles with different levels of automation are already present and fully autonomous cars will appear soon in everyday
transportation, i.e. Connected and Automated Vehicle (CAV) technology will fundamentally transform our life.
As the automation of road vehicles has a strong safety impact, it is of paramount importance to control the CAV development process from the perspective of technological regulation and law [7]. To guarantee the safety operation of these new technologies novel testing and validation pro- cesses are needed [8]. There are several approaches to analyze the safety properties of automated vehicles. For instance, EuroNCAP handles it as a new, more complex active safety system [9]. When speaking about CAV safety and its test- ing, it also unavoidable to recall the importance of cyber security, e.g. [10] proposed a novel a cyber-risk classifi- cation framework for CAVs. Besides, it will be necessary to define new standards to classify the complexity of auto- mated or autonomous vehicles. The most famous standards are the SAE levels [11] and a new relevant ISO standard (ISO 26262-1:2018) was also born in this field recently [12].
Based on the experience of the independent and international organizations for standardization, national governments can also create new regulations for these new technologies. At the same time, the national regulations shall need more interna- tional harmonization in the future [1]. Another important sug- gestion in the literature concerning the efficient international standardization of the CAV technology is that autonomous driving should be integrated into the mainstream education [13] for seamless adoption.
Obviously, the CAV revolution affects many areas of sci- ence and technology, i.e. control theory, artificial intelli- gence, transportation engineering, information technology, etc. However, the importance of the various fields is different regarding the CAV technology development. To determine the key areas in the development process is therefore a key problem. The right decision making of the relevant stakehold- ers (industry, government, authorities, national public tender system, research institutes) needs to be supported. To the best knowledge of the authors, none has approached the issue so far. Only three research articles were found close to this topic. Chenet al.[14] introduced an optimization method to design proving ground for CAVs, but only focused on defin- ing necessary road assets without ranking the importance of the revealed elements. Zhankaziev et al.[15] introduced a testing architecture for testing and proving purposes of ITS (Intelligent Transportation Systems) and unmanned driving technologies. Again, this article provided a special range of functionalities without prioritization. Chen et al.[16] pub- lished a method to assess the capability of proving grounds.
Through the proposed method a strong link between proving ground testing results of CAVs and their anticipated public street performance has been found. Although the articles above investigated the key functionalities of CAV proving grounds, they did not conduct extensive research to prioritize them, nor leveraged related expert knowledge. Accordingly, the goal of our article is to provide an efficient methodol- ogy to assist CAV related development, namely the planning of future automotive proving grounds which are specially
dedicated for CAV testing and proving. As a main result, a hierarchical decision model is presented directly applicable for ranking future functionalities of CAV test tracks.
Beside the identified research gap, the article is also moti- vated by the favorable situation that a brand new automotive proving ground, called ZalaZone (https://ZalaZone.hu/en/), is underway in Hungary near the city of Zalaegerszeg. This test track is specially designed to be capable of serving techno- logical testing and proving processes of autonomous/highly automated vehicles. The more, the mission of ZalaZone is not limited to pure commercial use. It is also a major goal to lay the foundation for research and innovation activities in national and international cooperation with universities, research centers and industrial participants [17].
In all, the goal of the article is to introduce a novel method to determine and rank the key areas for CAV devel- opment, more specifically for CAV proving ground design.
To this end, an efficient classification for all related areas is presented. Based on the classification, questionnaires have been worked out. The target group of the questionnaires consisted of academic people. The results of the ques- tionnaires are evaluated by the Analytic Hierarchy Process (AHP), a well-known method for decision making based on multiple criteria [18]. The AHP technique was cho- sen as it is intensively applied in transport related deci- sion making [19], [20] and [21]. Furthermore, since expert opinions have been acquired and because of the pioneer characteristics of the research, the robustness of the results plays a key role in drawing conclusions. Thus, the original AHP technique has been integrated with the Pareto approach to ensure that the eigenvector method has produced non- improvable weight scores connected to the decision elements of autonomous testing.
The article is organized as follows. Section 2 presents the theoretical preliminaries applied later for decision making support. Section 3 contains the methodology used to analyze the features based on a questionnaire. Section 4 discusses the core outcomes of the Pareto AHP based analysis. Finally, research concluding remarks are provided in Section 5.
II. THE APPLIED METHODOLOGY: PARETO AHP
Since autonomous car testing is approached as a multi- criteria decision making (MCDM) problem in this research, the appropriate methodological tool could be selected from MCDM techniques. One of the objectives was to synthesize strategic, tactical and operational issues for the analysis as well as general and more specific items. These divisional aspects could all be considered by a hierarchical decision structure proven to be comprehensive for expert evalua- tors. Consequently, Analytic Hierarchy Process seemed to be suitable for the analysis. However, based on a recent development of the method [22], [23], the original technique has been amended by an optimization process aiming to improve the gained weight scores by the Pareto principle, in terms of their approximation of the expert evaluation values.
In this section the original AHP method and the improved Pareto Analytic Hierarchy Process (PAHP) model are also introduced briefly.
A. OVERVIEW ON ANALYTIC HIERARCHY PROCESS (AHP) Analytic Hierarchy Process is based on the decision struc- ture created from the decision criteria of a complex decision structure [18]. Criteria, sub-criteria, sub-sub-criteria, etc. are identified with the last level of the alternatives in the decision tree. The linkages of the elements are also important since they determine not only the pairwise comparisons in the procedure but also the final weights and alternative scores by considering the respective scores of the elements at previous level.
The method of AHP can be summarized as follows. Let us assume that there are n alternatives in decision A_1, A_2,. . . ,A_n, and m criteria: C_1, C_2,. . . ,C_m.
Let us denote A(p) the pairwise comparison matrix of the alternatives with respect to the criterion p, and w(p) the weight vector calculated from the matrix A(p) by Saaty’s eigenvector method [18] (other calculations methods also exist) based on the following equation:
Aw=λmaxw (1)
whereλ_max denotes the maximum eigenvalue of matrix A.
Eigenvector w can be calculated based on the formula below:
(A−λmaxI)=0 (2)
Let also haveC, the pairwise comparison matrix of the crite- ria withwCbeing the weight vector belonging toC. Then the final evaluation scores of the alternativesu(w) can be gained by:
u(w)=wC1w1+wC2w2+. . .+wCmwm (3) The reciprocity (aji =1/aij, whereaii =1) is necessarily to be fulfilled for each pairwise comparison matrices (PCMs), so for eachCandA(p). However these experiential matrices are most likely not consistent, soaik 6=aijajk, in whichi,j and k represent the rows and columns of the pairwise comparison matrix A or C.
Thus, the consistency of PCMs have to be checked for the experiential matricesCandA(p) by the consistency ratio (CR)defined by [24], which is acceptable when its value is smaller than 0.1. The calculation of theCRis as follows:
CR=CI/RI (4)
whereRIis the average of consistency indexCIof randomly generated PCMs with the same size.
CIis calculated as given below:
CI=(λmax−n) /(n−1) (5) The pairwise evaluation of the PCMs are generally done based on the Saaty-scale in which ‘1’ denotes equal impor- tance rate of the elements, ‘3’ means moderate importance of an element over another, ‘5’ marks strong importance,
TABLE 1.An Example for Pareto Non-Optimality.
‘7’ means very strong importance, while ‘9’ denotes extreme superiority of an element over another. Intermediate values 2, 4, 6, 8 can also be applied to express superiority. To express inferiority, fractions (1/2, 1/3, . . . , 1/9) can be used.
If multiple evaluators are applied in the process, individual scores have to be aggregated. Aczél and Saaty [24] proved that only the geometric mean ensures that there is no rank reversal in the aggregation method compared to the arithmetic mean. The aggregation of the individual PCM scores is con- ducted as follows:
A=l r
Yl
g=1aijg (6)
whereaijg denotes entries in the same matrix position i,j, filled in by theg-th decision maker andldenotes the number of total evaluators, whileAis the gained aggregated matrix for which the eigenvector method can be applied and final overall weight scores can be derived.
Conducting the sensitivity analysis is also part of the AHP procedure which enables the decision makers to check the robustness of the results by detecting the impact of slight changes of certain weight scores on the whole decision struc- ture ranking.
B. THE APPLIED PARETO ANALYTIC HIERARCHY PROCESS (PAHP)
A reasonable expectation, both from the decision maker and the analyst, for any weight vector is that it could not be improved in a trivial way, namely, such that every pairwise ratio is at least as close to the corresponding matrix element given by the decision maker and it is strictly closer in at least one position. Formally, weight vectorwis called Pareto optimal (or efficient) if no dominating weight vectorw0exists such that |aij − w0i/w0j| ≤ |aij −wi/wj| for all pairs of indicesi,j, and if the inequality is strict for at least one pair of indicesi,j.
In the history of AHP applications, the eigenvector calcula- tion of Saaty [24] (see Formula 2) has been assumed to fulfil the Pareto principal. However, surprisingly, the eigenvector is not always Pareto optimal [25].
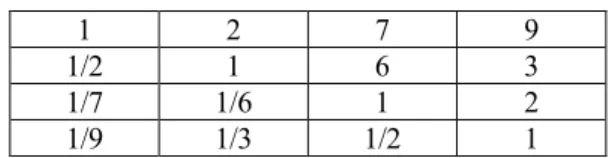
Let us consider the following 4×4 pairwise comparison matrix with acceptable inconsistency (CR<0.1).
Its right eigenvector calculated by the Saaty method is [0.552625;0.302041;0.081295;0.064038]T. However, this eigenvector is not Pareto optimal because in its neighborhood another (dominating) vector can be found for which the difference between the aij and wi/wj
TABLE 2. Non-Perfect Approximation of the Saaty Eigenvector (AHP).
TABLE 3. Improved Approximation by the Dominant Eigenvector (PAHP).
values is smaller. This dominating weight vector is [0.559862;0.297156;0.079980;0.063002]T.
For demonstration, we provide thewi/wjapproximation of theaijelements of the 4×4 PCM and it is visible that in the case of the dominating weight vector the approximation is better. For instance, thea13element is perfectly approximated by the dominant weight vector: 0.559862/0.07998022=7.
Finding a sufficient and necessary condition for the Pareto optimality of the eigenvector is a challenging open problem, but now we can state that there are non-Pareto cases which can be improved in terms of better approximation of the evaluators’ intentions.
Even though Pareto optimization generally causes merely slight modification in the weight vector coordinates, there is not only theoretical, but also practical evidence that the non-Pareto optimality in AHP might cause rank reversal, which means that the real intention of the modelling; the prioritization of the criteria or alternatives can be biased.
By simulation, [22] showed that for a 4 × 4 matrix, the conventional AHP would have set up the ranking of C2, C1, C3, C4, the Pareto optimal ranking, however, was C1, C2, C3, C4. [23] concluded that in practical AHP models, if the Pareto non-optimality is on the higher levels of the hierarchy, the rank reversal is very probable even in case of a slight modification in the weight vector coordinates. This is due to the hierarchical nature of the AHP, because the weight of the attributes in the lower levels are partly determined by the respective higher level weight of the connected attribute.
Bozóki and Fülöp [22] developed a linear programming based algorithm to check whether a given weight vector is Pareto optimal, and if it is not, then a dominating Pareto optimal weight vector is found. Duleba and Moslem [23]
demonstrated the Pareto optimality test in a real-world multi- criteria decision problem and ran the optimization process and calculations on real scoring. In our research, this algo- rithm has been applied to all aggregated matrices to test if the intentions of the experts are well approximated.
FIGURE 1. The general procedure of Pareto-test [23].
We find it important to include the test of Pareto optimality, because a non Pareto optimal weight vector cannot express, in the best possible way, the preferences of the decision maker.
However, it has to be emphasized that if the eigenvector is not Pareto optimal, there might exist a dominating Pareto optimal weight vector in its very small neighborhood. Consequently, the improvement in the weight scores is in most of the cases just small. Considering this, the Pareto test is recommended for sensitive and multi-level decision problems in which even relatively slight modifications in weight scores play signifi- cant role. If the weight scores of some decision elements are close to each other (sensitivity) or the slight modification is on the highest level and the modified score flows down in the whole hierarchy (multi-level decision problems), checking Pareto optimality can be a crucial issue.
The general procedure of Pareto-test, created by [23] can be seen in Fig. 1.
We have applied all steps of Pareto-test in our survey for ensuring the robustness of the final results.
III. HIERARCHICAL DECISION MODEL FOR
AUTONOMOUS PROVING GROUND DEVELOPMENTS According to the method presented in Section 2, a question- naire based investigation process has been worked out. As a first step a hierarchy tree in the field of connected and auto- mated vehicles had to be determined. The defined hierarchy tree has three main levels according to the common decision making structure when the problem is divided into several sub-problems embracing strategic, tactical, and operational decisions [26], i.e. decisions must be approached on
1. strategic level, 2. tactical level, 3. operational level.
TABLE 4. The Strategic Level ofIn-Vehicle Enablersand Its Sublevels.
The strategic level is directly adopted from the report of [27], which was prepared under the initiative of European Com- mission’s Directorate-General for Research and Innovation.
The reason for this adoption is the relevance, i.e. the content of the report is based on the contribution of different relevant European stakeholders from industry, academic field as well as authorities. The report’s original aim was to develop a research and innovation roadmap for CAV transport. Thus, it was fully applicable for the questionnaire based investi- gation, the goal of which was to determine the key areas of autonomous proving ground developments.
The strategic level has to embrace all significant areas of autonomous transport. It covers a wide field of disciplines, all the way from vehicle control to socio-economic issues affected by autonomous transport. The seven elements of the strategic level [27] are listed below:
1. In-vehicle enablers 2. Vehicle validation
3. Shared, connected and automated mobility services for people and goods
4. Socio-economic impacts, user/public acceptance 5. Human factors
6. Physical and digital infrastructure, and secure connec- tivity
7. Big data, artificial intelligence
Given the strategic level adopted from literature, the next step of hierarchy tree building was to determine the sublevels. As one of the contributions of the conducted research we defined the elements on the tactical and on the operational level. The aim was to detail the subdivisions of the different areas of
automated transport. The final hierarchy tree is based on the report of [27], the cited articles in the next paragraphs as well as on our experiences and knowledge. For the AHP analysis it is not important to complete every level, e.g. in our case the operational level is not fully detailed. Basically, the aim was that all the elements should directly relate to autonomous transport. At the same time, we did not intend to analyze the hierarchy of different science areas.
In the following subsections each strategic level is intro- duced in detail together with the tactical and operational levels. The levels are tabulated into the subsequent tables.
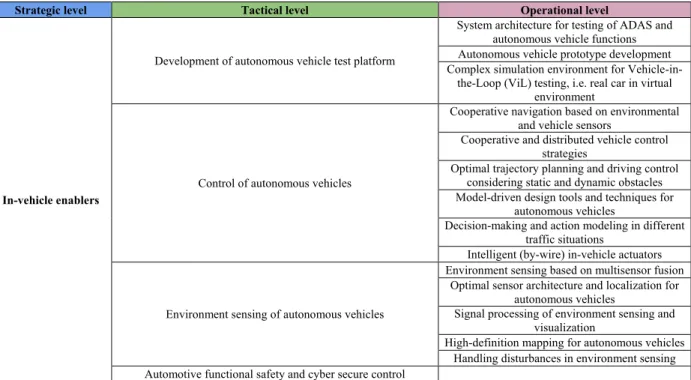
A. IN-VEHICLE ENABLERS
In a CAV the human driver is partially or fully substituted by a controller’s logic. The new testing and validation processes have to focus on the operation of that control system. The design of the control architecture elements and the testing procedure of their cooperation is one of the most impor- tant steps of realizing in-vehicle automated functions. The subdivisions of the in-vehicle enablers are the development process, the control system architecture, the environment sensing and the functional safety. Many of them were detailed earlier in the article of Gáspáret al.[28]. The strategic level ofIn-vehicle enablersis tabulated into Table 4.
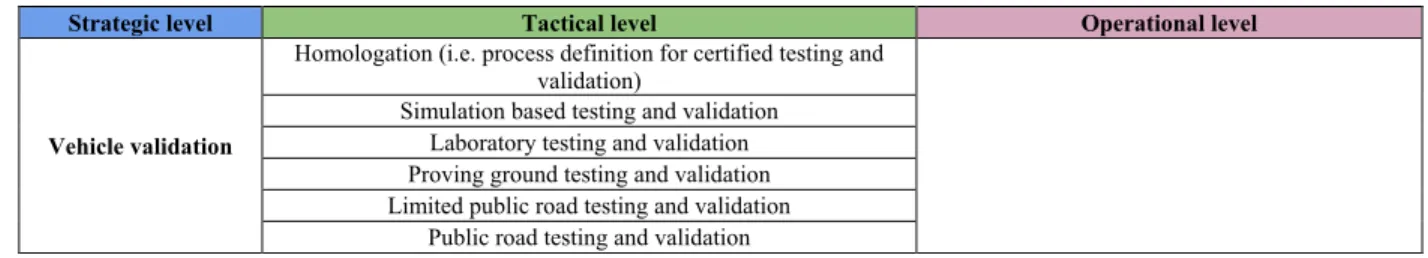
B. VEHICLE VALIDATION
Due to the safety issues of the automated vehicle features testing and validation processes became more important than earlier. Conventional vehicle tests typically focus on the behavior of the vehicle in various road conditions. Test cases
TABLE 5. The Strategic Level ofVehicle Validationand Its Sublevels.
usually concentrate on the dynamic properties and endurance capabilities of a single vehicle. In the case of CAV transport, however, the testing and validation are not restricted to a single vehicle anymore, but rather to a complex traffic system where the automated vehicle is a part of the surrounding traffic environment. CAVs must be tested in different traffic use-cases. Due to the stochasticity of traffic situations the testing and validation process should be more complex than earlier: it shall be carried out by the ‘‘V-model’’ of product development [29]. The subdivision of the vehicle validation is created based on the article [30]. This article introduced the CAV testing and validation pyramid which lavers were adopted corresponding to the elements in the tactical level.
The operational level was left blank intentionally as it has minor influence from the aspect of the whole research. The strategic level ofVehicle validationis tabulated into Table 5.
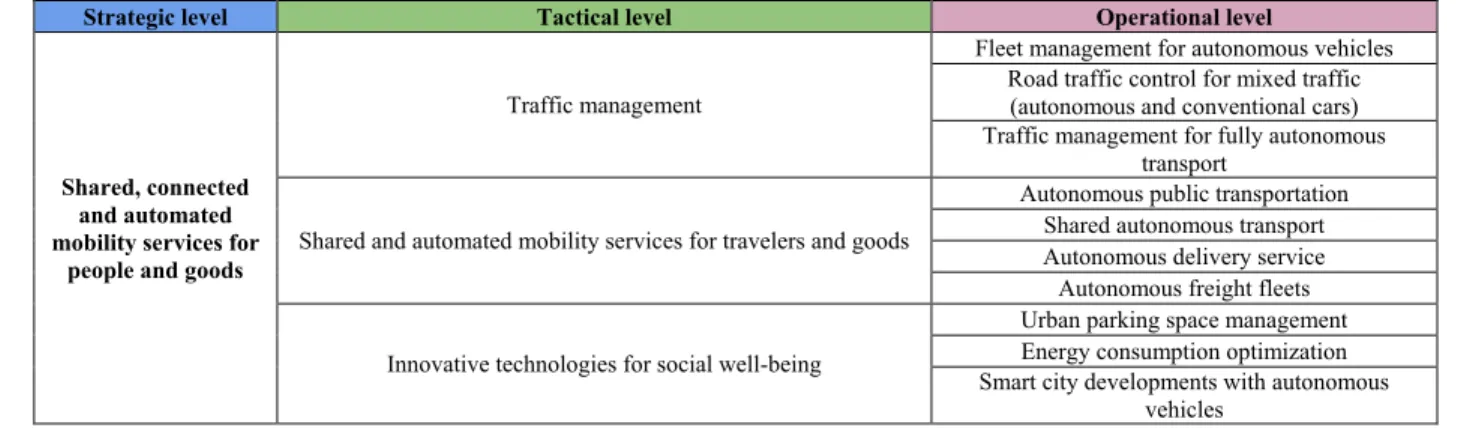
C. SHARED, CONNECTED AND AUTOMATED MOBILITY SERVICES FOR PEOPLE AND GOODS
With the arrival of autonomous vehicles, the whole trans- portation system will continuously change. Everyday trans- port of people and goods will transform to new services to be offered. This process has already started with the appearance of the concept of MaaS (Mobility as a Service) a few years ago. This means that based on the driverless capability of road vehicles, shared mobility services can distribute and so optimize the transportation needs in the future. Although mobility services mean software development mainly, the implications of this change is also worth investigating in a test track environment, e.g. traffic management, autonomous public transport, smart city developments. The subdivision of this strategic element is based on previous article [31]. The strategic level ofShared, connected and automated mobility services for people and goodsis given by Table 6.
D. SOCIO-ECONOMIC IMPACTS, USER/PUBLIC ACCEPTANCE
The social and economic impacts are unavoidable and will be disruptive due to the fast technological changes in both automotive and information technologies. Accordingly, the issues of education planning, research support, change of legislation as well as public acceptance must be carefully prepared and conducted in order to adapt users smoothly to the proper use of the new technologies. Apart from trans- portation, automated driving technology can reach society
through education and legislation. Moreover, CAV transport creates jobs in the research area. The well-organized educa- tion, research and legislation are key factors of the acceptance of CAV technologies. The strategic level ofSocio-economic impacts, user/public acceptanceand its tactical sublevels are provided by Table 7 (again with operational level intention- ally left blank).
E. HUMAN FACTORS
The human factors are important throughout the whole devel- opment process of autonomous cars as humans will always be present in the system. The more, human factors arise the main challenges in the development. The automated tech- nologies must deal with human interactions and behavior, e.g. in the context of human and autonomous vehicles inter- action or traveler’s behavior in autonomous public transport.
Therefore, also the implications of human factors need to be considered in a test track environment. The subdivision on the tactical level is based on the research of Hudsonet al.[4]. The strategic level ofHuman factorsis tabulated with its sublevels into Table 8 (operational level intentionally left blank).
In the previous part the possible research and development areas at autonomous proving ground have been determined for the survey research. The full hierarchy tree of the areas is provided in the Appendix.
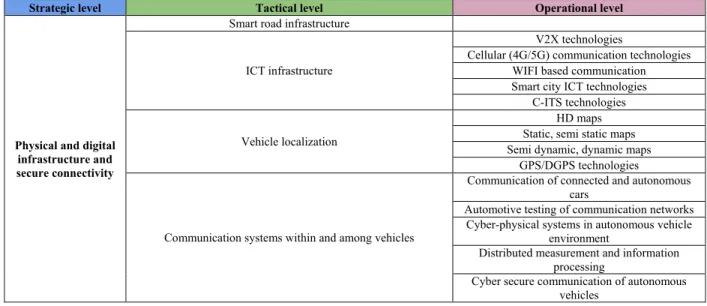
F. PHYSICAL AND DIGITAL INFRASTRUCTURE AND SECURE CONNECTIVITY
The proper testing possibility of smart road infrastructure is important in a test track as future autonomous vehicles’
operation will strongly depend on the intelligent infrastruc- ture. Similarly, the surrounding ICT infrastructure needs to be tested intensively. Vehicle localization (HD maps, satellite navigation) and communication systems within and among vehicles are also indispensable to be developed in a test track environment. Based on the connected technologies the local- ization and the control of automated vehicles can be further improved, e.g. by combining a GNSS system with environ- ment mapping, the local lateral and longitudinal control can be more accurate. Besides, by V2X (Vehicle-to-everything) communication traffic management can be made more effec- tive. If infrastructure is present for CAV control, the wireless communication systems are to be deployed. Communication involves further challenge into road transport, i.e. cyber secu- rity must be guaranteed at all times [10]. Due to the wide
TABLE 6. The Strategic Level ofShared, Connected and Automated Mobility Services for People and GoodsWith Its Sublevels.
TABLE 7. The Strategic Level ofSocio-Economic Impacts, User/Public Acceptanceand Its Sublevels.
TABLE 8. The Strategic Level ofHuman FactorsIts Sublevels.
utilization possibilities of connected technologies in the field of autonomous transport the subdivision of this strategic part is more detailed. The elements of the tactical level represent the typical utilization types of connected technologies. The operational level enumerates here different technical devel- opment opportunities. This subdivision applies several ideas from the research of Gáspáret al.[28]. The strategic level of Physical and digital infrastructure and secure connectivity and its sublevels are provided by Table 9.
G. BIG DATA, ARTIFICIAL INTELLIGENCE
Data management is also a crucial issue in the context of autonomous transportation. On the one hand, data of the individual cars must be safely and efficiently handled. On the other hand, traveler data is also a significant value for application in CAV transport operation and management, i.e. autonomous transport of the future can be optimized based on relevant and up-to-date travel data. Appropriate stor- age, access, analytics and privacy issues are to be therefore investigated and regularized. The basic applications of these tasks must be launched when testing on the test track. To realize traffic management with connected vehicles a huge amount of data has to be handled. Many research investi- gate the challenges of big data management. Besides, the
achievements of artificial intelligence also can be applied in the decision making processes in modern traffic management systems. The subdivision is partially based on the research of Bartoliniet al[7]. The strategic level of Big data, artificial intelligencewith the tactical and operation levels are given in Table 10.
H. QUESTIONNAIRES FILLED BY THE TARGET GROUP Based on the hierarchy tree explained in the previous part, two types of questionnaires have been worked out. The members of target group had to complete these questionnaires. In the questionnaires the participants had to give higher scores to the given element if they regarded it as a more important key factor in the spread of autonomous driving. To explain it from another aspect, the questionnaires investigated which area needs more development financing to facilitate autonomous driving. In the first questionnaire the target group had to give a score to each element in every level of the hierarchy tree. The results of this questionnaire were used to check the results of the second questionnaire, which was based on the Pareto AHP method. Another important goal of the first questionnaire was to present the hierarchy tree. While the members filled the first questionnaire, they could visually understand the structure of the hierarchy tree. In the second questionnaire,
TABLE 9. The strategic level ofPhysical and Digital Infrastructure and Secure Connectivityand Its Sublevels.
TABLE 10. The Strategic Level ofBig Data, Artificial Intelligenceand Its Sublevels.
the elements of the hierarchy tree had to be compared and to be scored in pairs. Filling this questionnaire needed more time as it did not show the hierarchy tree. At the same time, the second questionnaire provided more detailed results.
The questionnaires were completed in February of 2019 by the target group designated at the authors’ institutional affiliation (i.e. the Budapest University of Technology and Economics). The participants of the target group came from different scientific areas and from different hierarchy levels, at the same time they were all familiar with CAV technologies and working together with industrial partners as well under the umbrella of CAV research and development projects. In all, the target group contained 20 members whose opinion can be regarded well-founded due to their everyday work.
Besides, it is important to emphasize that the participants work in different technology fields which were beneficial as usually experts overestimate their specialization. Although the target group was based on the Higher Education Excel- lence Program (BME FIKP-MI/FM) running at the university from 2018 to 2021, all participants of the group work in different discipline of CAV transport development both for the university and ZalaZone test track [32]. The evaluators were transportation engineers, vehicle engineers, electrical
engineers, software engineers, control engineers as well as civil engineers. From the aspect of qualification, there were PhD students, lecturers, university professors, as well as research fellows in the pattern. It must be emphasized, how- ever, that about half of the target group participants also hold a position in industrial companies (that is common in the Hungarian academic area), i.e. they have a clear view from commercial and industrial aspects. The questionnaire was completed on article with personal attendance of the instructor. Thus, the false filling due to any misunderstanding could be avoided. The first questionnaire needed 15 minutes to fill, and the second one needed 40 minutes on average.
Since the pattern consisted strictly specialized experts, the size of 20 can be considered sufficient for an MCDM and within that for an AHP survey. As a justification to this practice in decision making research, consider the research of Lee [33] which applied 21 evaluators with different back- grounds, i.e. researchers, business executives and public agency staff members in a public transport survey.
IV. RESULTS
Pareto-test, presented in the Methodology section, has been carried out following the rules of PAHP. Having set up the
TABLE 11. The Aggregation of Individual Scoring of the Surveyed Experts by the Geometric Mean.
hierarchical decision tree of autonomous proving ground development (see Table 4 ), we created the questionnaires and collected survey data as introduced in the previous section.
The consistency check ensured that all evaluations were within the range of acceptable inconsistency, namely the computed Consistency Ratio was below the 0.1 threshold in each experiential pairwise comparison matrix. Afterwards, we used the geometric mean to create the aggregated matrices for each part of the hierarchical decision tree (see Table 11).
Then we applied the eigenvector method (Formula 2) for every aggregated matrix, but simultaneously, we have tested the Pareto optimality of the eigenvector in case of all the 18 pairwise comparison matrices (the eigenvectors of 3×3 matrices are always Pareto optimal). We have not found any matrix with non Pareto optimal eigenvector. For demonstra- tion, the aggregated matrix of the first level decision elements is provided by Table 11.
Its eigenvector is w = [0.1990,0.2281,0.1055,0.0833, 0.0923,0.1351,0.1567]T, which is Pareto optimal and there is no dominating Pareto optimal weight vector that can be found.
This approximation cannot be improved (it is not perfect due to the small but acceptable inconsistency of the scoring), so the results of the AHP process can be considered Pareto optimal. In case this first level weight score calculation would not have been optimal, even little modifications would have caused a significant change in lower level ranking of the deci- sion elements. The efficiency test has proven the robustness of the survey in terms of deriving the weight scores from the evaluated matrices. Consequently, the final scores can be considered as trustworthy and the results as reliable.
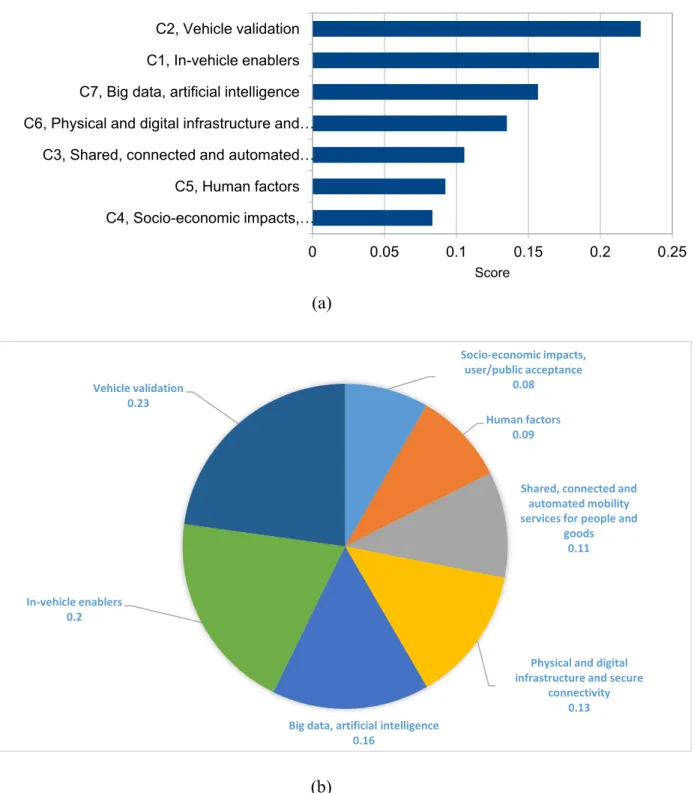
On strategic level according to the target group’s opinion, the key factors of the development are the control systems of the autonomous vehicles, i.e. In-vehicle enablers (C1) andVehicle validation(C2) reached the highest scores. Their importance is obviously more significant compared to the other elements. Big data, artificial intelligence (C7) and Physical and digital infrastructure and secure connectivity (C6) got medium high score. The least important elements on strategic level areShared, connected and automated mobility services for people and goods(C3),Human factors(C5) and Socio-economic impacts, user/public acceptance(C4). The
evaluation shows that the scientific fields connected more to the social sciences were considered as less important areas.
It is also possible to explain the results by the future of the new technologies. First, CAV control technologies have to be realized, i.e. the first step is to design, test and validate the new control systems. If they operate well, they will be able to physically appear in road transport. The issues with human factors and socio-economic impacts will obviously appear in a later phase when CAV transport becomes more and more reality and used in practice. The results of the strategic level can be seen in Fig. 2a. The relationship in scores of the strategic level items can be better perceived in Fig. 2b.
The scores of the tactical level are meaningful because the tactical level does not have empty parts. According to the results of the Pareto AHP method the most important elements of the tactical level are theAutomotive functional safety and cyber secure control(C14),Public road testing and validation(C26) andBig data for efficient transport planning and traffic management(C72). Besides, it can be seen that the elements which are related to environment sensing, vehi- cle testing, vehicle localization and artificial intelligence are also reached higher scores. In the results less important are Human factors and dynamic characteristics(C51) andTravel behavior in autonomous public transport(C55).
The high score of public road testing and validation must be emphasized. It means that the target group found, it is not enough to test the new technologies in a closed area, the stochasticity of traffic situations also requires real traffic environments. The further elements in function of the scores of the tactical level show similarity with the strategic level:
the elements related to vehicle control systems, safety and localization have higher scores. It justifies that the operability, reliability and the safety operation are the main key factors in the next few years. The human factors again got lower scores. Surprisingly, the topic of big data in road transport achieved a high score which was unexpected as it rather means transport operation and management issues than CAV development. The low scores of laboratory and simulation testing as well as validation were also unexpected. Probably, the target group balanced the difference between the different testing levels and from this aspect public road testing really have a stronger effect on road safety. It is also an interesting
FIGURE 2. (a) Comparison of the results on the strategic level. (b) Comparison of the results on the strategic level represented by pie chart.
result that the target group regarded research itself more important than education, although most of the participants (beside their research and development activities) teach in university programs.
The results on the tactical level are shown in Fig. 3.
On the operational level there are also similar areas as on the higher level and there are also new areas in the list of key elements. The target group selected the
following fields as the most important topics for CAV research and development:Road traffic control for mixed traf- fic (autonomous and conventional cars)(C312),Traffic man- agement for fully autonomous transport(C313),GPS/DGPS technologies (C634) and the Data privacy (C714). There are also significant elements with higher scores that are related to the control system of automated vehicles for instance, with sensor architectures, with trajectory making
TABLE 12. The Consistent Approximation of the Calculated Eigenvector.
FIGURE 3. Comparison of the results on the tactical level.
or with decision making processes. On the opposite side, WIFI based communication (C623), Urban parking space
management(C331),Autonomous freight fleets(C324) and Data storage (C711) got the lowest scores. Typically the
FIGURE 4. Comparison of the results on the operational level.
different communication systems and technologies, as well as the autonomous services reached here consequently low scores.
An interesting result of the operational level that it repeats one result of the tactical level: the high score for road traffic management and control. Behind the results, the importance
of urban traffic issues can be found. Urban traffic manage- ment needs vehicle localization and communication between them. The elements which are related to localization (and also to vehicle control or environment sensing) obtained higher scores, in contrast to the lower scores of the connected tech- nologies (that was unexpected).
TABLE 13. The Results of the Sensitivity Analysis.
TABLE 13. (Continued.)The Results of the Sensitivity Analysis.
The higher score of control systems and the lower score of the autonomous delivery services or the autonomous freight fleets show similarity as in higher levels. Probably, the back- ground of that target group opinion is that the development of the basic functions is more important than the features that will be able to realize by them.
The results on the operational level can be seen in Fig. 4.
The sensitivity analysis proved the stability of the gained ranking results. We have conducted numerous versions of the analysis and selected decision elements from the first level of the decision hierarchy to examine the impact of the modifications on the lower levels and find out if the originally
obtained priority is sensitive. The most obvious selection from the testing point of view was to pick the closest two first level items, theVehicle validation(C2) and In-vehicle enablers (C1) and subscribing some points from C2 and adding to C1. We have reached the limit of the change of 0.01 (this can be considered as a significant change for a PAHP test) for which the ranking for all levels still remained stable.
As demonstrated in Table 13, the position of the first five most significant elements did not change, neither on the second, nor on the third level of the decision hierarchy. In Table 13, the affected elements and their new scores are highlighted in bold.
FIGURE 5. Hierarchy tree for research and development topics of autonomous driving and related technologies on automotive proving ground.
V. CONCLUSION
As a main output of the conducted research a hierarchical decision model has been created for testing and proving processes of CAVs and related technologies. The applied methodology has confirmed the robustness of the results twofold. Sensitivity analysis revealed the stability for minor changes in the hierarchical structure weight scores while Pareto test approved that the gained weights are the best possible to reflect the experts’ intention. In the case of expert surveys where the calculated weight scores have high sig- nificance (e.g. in investment decisions), it is highly recom- mended to apply not only the conventional tools of AHP (including sensitivity analysis) but also Pareto optimality test to gain robust results. Accordingly, a Pareto AHP model was carried out and successfully applied for the problem of autonomous proving ground development. Although it is not obvious that the outcome of the recent research in terms of ranking the decision elements of autonomous testing can be generalized due to the specific features of the given test track (size, geographic location. etc.), the proposed hierar- chical decision model and the created PAHP procedure is a proper base for similar problem to assist decision making.
Even though the examined case study did not contain non- Pareto optimal weight vectors, it is highly suggested for other applications conducting the Pareto test to avoid the risk of rank reversal and thus, to avoid biased final decisions. Future work consists of the extension of the current model by adding possible interrelations of the decision elements. However, it has to be emphasized that the linkages of the elements are basically hierarchical, thus AHP can be considered as a good approximation of the problem. Analytic Network Process (ANP) would examine all possible connections of the attributes and for this enormous number of criteria would probably be difficult to apply. A more realistic methodology might be such model which keeps the PAHP results and amends it with the non-hierarchical linkages such as the com- bination of AHP and Interpretive Structural Modelling [34].
APPENDIX See Fig. 5.
REFERENCES
[1] D. J. Fagnant and K. Kockelman, ‘‘Preparing a nation for autonomous vehicles: Opportunities, barriers and policy recommendations,’’
Transp. Res. A, Policy Pract., vol. 77, pp. 167–181, Jul. 2015, doi:
10.1016/j.tra.2015.04.003.
[2] E. Fraedrich, D. Heinrichs, F. J. Bahamonde-Birke, and R. Cyganski,
‘‘Autonomous driving, the built environment and policy implications,’’
Transp. Res. A, Policy Pract., vol. 122, pp. 162–172, Apr. 2019, doi:
10.1016/j.tra.2018.02.018.
[3] M. L. Cunningham, M. A. Regan, T. Horberry, K. Weeratunga, and V. Dixit, ‘‘Public opinion about automated vehicles in Australia: Results from a large-scale national survey,’’Transp. Res. A, Policy Pract., vol. 129, pp. 1–18, Nov. 2019, doi:10.1016/j.tra.2019.08.002.
[4] J. Hudson, M. Orviska, and J. Hunady, ‘‘People’s attitudes to autonomous vehicles,’’Transp. Res. A, Policy Pract., vol. 121, pp. 164–176, Mar. 2019, doi:10.1016/j.tra.2018.08.018.
[5] P. Liu, Z. Xu, and X. Zhao, ‘‘Road tests of self-driving vehicles: Affective and cognitive pathways in acceptance formation,’’Transp. Res. A, Policy Pract., vol. 124, pp. 354–369, Jun. 2019, doi:10.1016/j.tra.2019.04.004.
[6] M. M. Waldrop, ‘‘Autonomous vehicles: No drivers required,’’Nature, vol. 518, no. 7537, pp. 20–23, Feb. 2015, doi:10.1038/518020a.
[7] C. Bartolini, T. Tettamanti, and I. Varga, ‘‘Critical features of autonomous road transport from the perspective of technological regulation and law,’’ Transp. Res. Procedia, vol. 27, pp. 791–798, 2017, doi:
10.1016/j.trpro.2017.12.002.
[8] N. Kalra and S. M. Paddock, ‘‘Driving to safety: How many miles of driving would it take to demonstrate autonomous vehicle reliability?’’
Transp. Res. A, Policy Pract., vol. 94, pp. 182–193, Dec. 2016, doi:
10.1016/j.tra.2016.09.010.
[9] A. Miller, ‘‘Euro NCAP roadmap—Autonomous vehicles, vehicle and system testing,’’ inProc. Vehicle Test Develop. Symp., Stuttgart, Germany, May 2016, pp. 1–25.
[10] B. Sheehan, F. Murphy, M. Mullins, and C. Ryan, ‘‘Connected and autonomous vehicles: A cyber-risk classification framework,’’
Transp. Res. A, Policy Pract., vol. 124, pp. 523–536, Jun. 2019, doi:
10.1016/j.tra.2018.06.033.
[11] SAE International, ‘‘Taxonomy and definitions for terms related to on-road motor vehicle automated driving systems,’’ SAE Standard J3016_201806, 2018. [Online]. Available: https://www.sae.
org/standards/content/j3016_201806/
[12] International Standard Road Vehicles—Functional Safety, International Organization for Standardization, Standard ISO 26262-1:2018, Geneva, Switzerland, 2018. [Online]. Available: https://www.iso.
org/standard/68383.html
[13] Z. Szalay, D. Esztergár-Kiss, T. Tettamanti, P. Gáspár, and I. Varga,
‘‘RECAR: Hungarian research centre for autonomous road vehicles is on the way,’’ ERCIM News, Special Theme, Auto. Vehicles, vol. 109, pp. 27–29, Apr. 2016. [Online]. Available: https://ercim- news.ercim.eu/en109/special/recar-hungarian-research-centre-for- autonomous-road-vehicles-is-on-the-way
[14] R. Chen, M. Arief, and D. Zhao, ‘‘An ‘Xcity’ optimization approach to designing proving grounds for connected and autonomous vehicles,’’ 2018, arXiv:1808.03089. [Online]. Available: http://arxiv.org/abs/1808.03089 [15] S. Zhankaziev, A. Vorob’yov, and D. Morozov, ‘‘Principles of creating
range for testing technologies and technical solutions related to intelligent transportation systems and unmanned driving,’’Transp. Res. Procedia, vol. 50, pp. 757–765, Jan. 2020, doi:10.1016/j.trpro.2020.10.091.
[16] R. Chen, M. Arief, W. Zhang, and D. Zhao, ‘‘How to evaluate proving grounds for self-driving? A quantitative approach,’’ IEEE Trans. Intell. Transp. Syst., early access, May 15, 2020, doi:
10.1109/TITS.2020.2991757.
[17] Z. Szalay, Á. Nyerges, Z. Hamar, and M. Hesz, ‘‘Technical specification methodology for an automotive proving ground dedicated to connected and automated vehicles,’’Periodica Polytechnica Transp. Eng., vol. 45, no. 3, pp. 168–174, 2017, doi:10.3311/PPtr.10708.
[18] T. L. Saaty, ‘‘A scaling method for priorities in hierarchical structures,’’
J. Math. Psychol., vol. 15, no. 3, pp. 234–281, 1977, doi:10.1016/0022- 2496(77)90033-5.
[19] D. Tsamboulas and G. Mikroudis, ‘‘EFECT—Evaluation framework of environmental impacts and costs of transport initiatives,’’Transp. Res. D, Transp. Environ., vol. 5, no. 4, pp. 283–303, 2000, doi:10.1016/S1361- 9209(99)00038-3.
[20] A. Tudela, N. Akiki, and R. Cisternas, ‘‘Comparing the output of cost benefit and multi-criteria analysis,’’Transp. Res. A, Policy Pract., vol. 40, no. 5, pp. 414–423, Jun. 2006, doi:10.1016/j.tra.2005.08.002.
[21] L. Kisgyörgy and J. Tóth, ‘‘Fuzzy analysis of comfort along travel chains,’’
Transport, vol. 35, no. 2, pp. 203–212, May 2020, doi:10.3846/transport.
2020.12634.
[22] S. Bozóki and J. Fülöp, ‘‘Efficient weight vectors from pairwise compari- son matrices,’’Eur. J. Oper. Res., vol. 264, no. 2, pp. 419–427, Jan. 2018, doi:10.1016/j.ejor.2017.06.033.
[23] S. Duleba and S. Moslem, ‘‘Examining Pareto optimality in analytic hierarchy process on real data: An application in public transport service development,’’Expert Syst. Appl., vol. 116, pp. 21–30, Feb. 2019, doi:
10.1016/j.eswa.2018.08.049.
[24] J. Aczél and T. L. Saaty, ‘‘Procedures for synthesizing ratio judgements,’’
J. Math. Psychol., vol. 27, pp. 93–102, Mar. 1983, doi:10.1016/0022- 2496(83)90028-7.
[25] R. Blanquero, E. Carrizosa, and E. Conde, ‘‘Inferring efficient weights from pairwise comparison matrices,’’Math. Methods Oper. Res., vol. 64, no. 2, pp. 271–284, Oct. 2006, doi:10.1007/s00186-006-0077-1.
[26] G. Desaulniers and M. Hickman, ‘‘Public transit,’’ inHandbooks in Opera- tions Research and Management Science, C. Barnhart and G. Laporte, Eds.
Haarlem, North-Holland: Transportation 14, 2007, pp. 69–128.
[27] G. Meyer, V. Blervaque, and P. Haikkola, ‘‘STRIA roadmap on connected and automated transport: Road, rail and waterborne,’’ Eur.
Commission, New Delhi, India, Directorate-Gen. Res. Innov. Rep., 2019.
[Online]. Available: https://ec.europa.eu/research/transport/pdf/stria/stria- roadmap_on_connected_and_automated_transport2019-TRIMIS_
website.pdf
[28] P. Gáspár, Z. Szalay, and S. Aradi. (2014).Highly Automated Vehicle Systems. BME MOGI. Accessed: Aug. 21, 2019. [Online]. Available:
http://www.mogi.bme.hu/TAMOP/jarmurendszerek_iranyitasa_angol/
index.html
[29] I. Passchier, G. Van Vugt, and M. Tideman, ‘‘An integral approach to autonomous and cooperative vehicles development and testing,’’ inProc.
IEEE 18th Int. Conf. Intell. Transp. Syst., Sep. 2015, pp. 348–352.
[30] Z. S. Szalay, ‘‘Structure and architecture problems of autonomous road vehicle testing and validation,’’ inProc. 15th Mini Conf. Vehicle Syst. Dyn., Identificat. Anomalies (VSDIA). Budapest, Hungary: Budapest Univ. of Technology and Economics, 2016, pp. 229–236.
[31] T. Tettamanti, I. Varga, and Z. Szalay, ‘‘Impacts of autonomous cars from a traffic engineering perspective,’’Periodica Polytechnica Transp. Eng., vol. 44, no. 4, pp. 244–250, Oct. 2016, doi:10.3311/PPtr.9464.
[32] D.-J. Lee, ‘‘A multi-criteria approach for prioritizing advanced pub- lic transport modes (APTM) considering urban types in Korea,’’
Transp. Res. A, Policy Pract., vol. 111, pp. 148–161, May 2018, doi:
10.1016/j.tra.2018.02.005.
[33] S. Duleba, ‘‘An AHP-ISM approach for considering public preferences in a public transport development decision,’’Transport, vol. 34, no. 6, pp. 1–10, 2019, doi:10.3846/transport.2019.9080.
SZABOLCS DULEBA received the M.Sc. and Ph.D. degrees in management science in 2001 and 2008. He is currently an Associate Profes- sor with the Department of Transport Technology and Economics, Budapest University of Technol- ogy and Economics. His current research interests include multi-criteria decision-making in logistics and transportation management. Except for pub- lishing in top journals, he participated in several national and EU research projects.
TAMÁS TETTAMANTI received the M.Sc. and Ph.D. degrees in traffic engineering in 2007 and 2013. He acts as an associate professor and also participates in research and industrial projects as researcher and a project coordinator. He has coauthored more than 100 scientific articles, two patents, and several books. His current research interests include road traffic modeling, estima- tion, and control with applications in intelligent and autonomous transportation systems. He is a member of Committee on Transport Engineering of Hungarian Academy of Sciences. He is a Management Committee Member with the European Cooperation in Science and Technology COST Action CA162222 (Wider Impacts and Scenario Evaluation of Autonomous and Connected Transport).
ÁDÁM NYERGES received the M.Sc. degree in vehicle engineering in 2013. Since 2013, he has been a Researcher and an Assistant Lec- turer with the Budapest University of Technology and Economics. Besides, he participated in sev- eral research in the topic of automated vehicle testing and validation. His current research inter- ests include the simulation and the controlling of complex systems, typically internal combustion engines, hybrid, and electric powertrain systems.
ZSOLT SZALAYreceived the M.Sc. degree in elec- trical engineering and the M.Sc. degree in business administration from the Budapest University of Technology and Economics, in 1995 and 1997, respectively, and the Ph.D. degree in mechanical engineering in 2002. He is currently an Associate Professor and the Head of the Budapest University of Technology and Economics, Hungary. He wrote more than 200 scientific publications. His research interests include advanced automotive technolo- gies, the IoT telematics, and the security of vehicle cyber-physical systems.