Characterization of mercury(II)-induced inhibition of photochemistry in the reaction center of photosynthetic bacteria
Gábor Sipka1,2, Mariann Kis1, and Péter Maróti1,+
1Department of Medical Physics, University of Szeged, Hungary
2Department of Plant Biology, Hungarian Academy of Science, Biological Research Centre, Szeged, Hungary
The publisher's version: Sipka, G., Kis, M. & Maróti, P. Photosynth Res (2017).
https://doi.org/10.1007/s11120-017-0474-8
+Corresponding author
Rerrich Béla tér 1, Szeged 6720, Hungary e-mail: pmaroti@sol.cc.u-szeged.hu phone: 36-62-544-120
Keywords: Bacterial photosynthesis; bacteriochlorophyll absorption spectroscopy;
bacteriochlorophyll fluorescence spectroscopy; bioenergetics; mercury(II) contamination; quinones;
Abbreviations BChl bacteriochlorophyll; BPhe bacteriopheophytin; cyt c2+ reduced cytochrome c;
DF delayed fluorescence; LDAO lauryl dimethylamine N-oxide; NEM N-Ethylmaleimide; P bacteriochlorophyll dimer; pCMB p-Chloromercuribenzoate; PF prompt fluorescence; QA primary acceptor (ubiquinone); QB secondary acceptor; Rba. Rhodobacter; RC reaction center.
Abstract
Mercuric contamination of aqueous cultures results in impairment of viability severe damage of photosynthetic bacteria primarily by inhibition of the photochemistry of the reaction center (RC) protein. Isolated reaction centers (RCs) from Rhodobacter (Rba.) sphaeroides were exposed to Hg2+
ions up to saturation concentration (~103 [Hg2+]/[RC]) and the gradual time and concentration- dependent loss of the photochemical activity was monitored. The vast majority of Hg2+ ions (about 500 [Hg2+]/[RC]) had low affinity for the RC (binding constant Kb~5 (mM)-1) and only a few (~ 1 [Hg2+]/[RC]) exhibited strong binding (Kb~50 (μM)-1). Neither type of binding site had specific and harmful effects on the photochemistry of the RC. The primary charge separation was preserved even at saturation mercury(II) concentration, but essential further steps of stabilization and utilization were blocked already in the 5 < [Hg2+]/[RC] <50 range whose locations were revealed. 1) The proton gate at the cytoplasmic site had the highest affinity for Hg2+ binding (Kb~0.2 (μM)-1) and blocked the proton uptake. 2) Reduced affinity (Kb~0.05 (μM)-1) was measured for the mercury(II) binding site close to the secondary quinone that resulted in inhibition of the interquinone electron transfer. 3) A similar affinity was observed close to the bacteriochlorophyll dimer causing slight energetic changes as evidenced by a ~30 nm blue shift of the red absorption band, a 47 meV increase in the redox midpoint potential and a ~20 meV drop of in free energy gap of the primary charge pair. The primary quinone was not perturbed upon mercury(II) treatment. Although the Hg2+ ions attack the RC in large number, the exertion of the harmful effect on photochemistry is not through mass-action but rather a couple of well-defined targets. Bound to these sites, the Hg2+ ions can destroy H-bond structures, inhibit protein dynamics, block conformational gating mechanisms and modify electrostatic profiles essential for electron and proton transfer.
The reaction center (RC) of photosynthetic bacterium Rba. sphaeroides is a membrane-bound protein complex that converts the absorbed light energy into electrochemical energy including the reduction of quinone and generation of a membrane potential (Okamura et al. 2000; Wraight 2004). It consists of three polypeptide subunits (Stowell et al. 1997). The subunits L and M each contain five transmembrane helices and bind all the active cofactors which are arranged into A and B branches.
Each branch originates at the bacteriochlorophyll dimer (P), near the periplasmic side of the membrane, and continues through a monomeric bacteriochlorophyll (BChl) and bacteriopheophytin (BPhe). The A and B branches terminate at the cytoplasmic side of the membrane at the acceptor quinones (ubiquinone-10) QA and QB, respectively. The third RC subunit (H) contains one transmembrane helix anchoring in the membrane and a soluble domain that caps the L and M polypeptides on the cytosolic side of the membrane. The H subunit contains none of the active cofactors, but contributes to structural stability of the RC and contains residues implicated in proton transfer (Wraight 2004; Wraight and Gunner 2009; Maróti and Govindjee 2016). After absorption of light by P, charge separation occurs and an electron is transferred down a potential gradient from excited singlet state of P through monomeric BChl (or by a super-exchange mechanism) to BPhe in
~3 ps, and then transferred on to QA in ~200 ps. If the QB site is occupied, electron transfer proceeds further, from QA to the QB, in ~100 μs. In the absence of cytochrome c or any similar secondary electron donor to reduce P+, these semiquinone species are not stable and relax via both thermal and electron tunneling mechanisms from QA– in ~100 ms and from QB– in ~1 s (charge recombination).
In the presence of an electron donor to P+, a second excitation can occur and QB becomes doubly reduced and picks up two protons. The QBH2 leaves the RC and is replaced by a quinone from the quinone pool in the membrane (see (Wraight and Gunner 2009) for a review of the quinone reduction cycle).
As metals bound to proteins can perform a number of crucial biological reactions, the method of binding of heavy metal ions to RC has been frequently used to identify critical residues and mechanisms. The effects of metal binding on the kinetics of electron/proton transfer can reveal novel structural and functional aspects of the RC (Utschig and Thurnauer 2004). Utschig et al. and Thurnauer showed that Zn2+ was bound to the RC with high affinity and affected the rate of the first interquinone (QA– → QB) electron transfer by changing the protein dynamics (Utschig et al. 1998;
Utschig et al. 2005). The binding of Cd2+, Zn2+ and Ni2+ to the surface accessible region on the H- subunit (HisH126, HisH128, and AspH124) was observed that resulted in a drastic reduction (> 102 -fold) in the rate of proton transfer by creating a barrier for proton entry into the internal proton transfer pathway (Paddock et al. 1999; Axelrod et al. 2000; Gerencsér and Maróti 2001). The binding of Cu2+
at two different locations and its inhibitory effects were reported (Yruela et al. 1993; Utschig et al.
1998). Yruela et al. concluded that Cu2+ impaired the photosynthetic electron transport between BPhe and QA in photosynthetic RC. In this study they reported, the metal ion could bind to amino acid residues HisM217, ThrM220, TrpM250, and G1uL104 located between BPhe and QA in such a way that the local conformation of the domain was disrupted. Utschig et al. observed that the QA− → QB electron transfer slowed in the presence of Cu2+. In their interpretation, the copper can bind to the group of four histidines (HisH68, HisH126, HisH128 and HisL211) located beneath the QB binding pocket that acts both as proton entry to the RC and a site of protein motions coupled to electron transfer. Coppers bound to non-specific sites of the protein matrix can be used to design new metalloproteins (Hellinga 1996; Zastrow and Pecoraro 2013). Although manganese binds with low affinity to the RC (the dissociation constant is greater than 100 M), a redox active Mn site in the bacterial RC can be constructed to mimic the function of the manganese cluster in photosystem II (Thielges et al. 2005;
Kálmán et al. 2011).
Among the divalent cations, the mercury(II) ion plays special role as it cleaves the proteins specifically at salt- and disulfide (cys-cys) bridges. The RC is rich in these regions and the Hg2+ ion might have several binding sites with high affinities, therefore various sections of the electron transport chain would be affected at lower [Hg2+] that would lead finally to complete shutdown of the
photochemistry of the RC. The decomposition of the various Hg2+-induced effects into well-defined processes is a great challenge. The most sensitive target of the attack of the Hg2+ ion is the secondary quinone binding site and the inhibition of the primary interquinone electron transfer has proved to be the earliest sign of mercury(II) pollution (Paddock et al. 1999; Asztalos et al. 2010). Compared to the sensitivity of the secondary quinone, the activities of the primary quinone and the donor sites were found to be much more resistant to the mercury(II) ion. The effect of mercury(II) was different if the RC was kept in the dark or in the light (in charge separated state), indicating different structures with different energy maps (Kálmán and Maróti 1994; Brzezinski and Andreasson 1995; Katona et al.
2005) and different exposure to Hg2+ ion under these conditions.
In this work, we have attempted to map the locations and consequences of mercury(II) binding that lead to successive inhibition of the primary photochemistry by modifying 1) the energetics of the cluster of protonatable amino acids around QB (rapid effect) and 2) the structure of the protein (slow process). These studies highlight mercury(II) as a global priority contaminant whose importance as a chemical of major concern to the phototrophs (bacteria and algae) and plants has been underscored by a number of recent publications. They describe the influence of Hg stress on agro-ecosystem (Zhao et al. 2014), the cellular and molecular targets of Hg toxicity in phototrophs (Asztalos et al. 2012;
Deng et al. 2013; Kis et al. 2015; Kis et al. 2017) and how phototrophs affect Hg cycling (i.e., alteration of Hg redox state, Hg scavenging, potential for methylation) (Gregoire and Poulain 2014).
The mercury (II) ion as one of the most toxic agents to photosynthetic bacteria (Giotta et al. 2006) and primarily attacks the RC protein (Asztalos et al. 2010; Asztalos et al. 2012). The present study could offer new insight into the research for the early detection and molecular mechanism of mercury(II) pollution of aqueous habitats.
Materials and Methods
Materials. RCs from Rba. sphaeroides R-26 were isolated in detergent LDAO as described earlier (Maróti and Wraight 1988). The function of the secondary quinone was reconstituted by addition of an excess of ubiquinone (ubiquinone-50) at a molar ratio of 5:1. Inter-quinone electron transfer was blocked by use of terbutryn prepared in ethanol prior to use. Replacement of the native ubiquinone with low potential quinones in the QA site was accomplished using the procedure of Okamura (Okamura et al. 1975) with slight modifications (Kálmán and Maróti 1994). The multiple turnover of the RC was assured on the donor side of the RC by addition of cytochrome c from horse heart (type VI, Sigma) prepared in aqueous solution and reduced to > 90% by bubbling H2 gas into the solution in the presence of palladium black (Gerencsér et al. 1999). The concentration and purity of the RC were determined from steady-state absorption at 802 nm using the absorption coefficient ε802 = 318 mM–1·cm–1 and from absorption ratio of 280 nm vs. 800 nm, respectively (McPherson et al. 1993). The typical purity of the RC was 1.30.
The mercury(II) ion was added in form of HgCl2 with equimolar amount of citrate to avoid the creation of poorly soluble mercury(II) salts (Asztalos et al. 2010). The RC was kept illuminated or in the dark under anaerobic conditions during the mercury treatment. N-Ethylmaleimide (NEM) and p-Chloromercuribenzoate (pCMB) were used as a general sulfhydryl modifying agent at 20 mM and 5mM concentration, respectively (Gao and Wraight 1990).
Assay of mercury(II) binding. The amount of Hg2+ bound to the RC was determined by use of indirect spectrophotometric measurement of the Hg2+-dithizone complex (Theraulaz and Thomas 1994; Kis et al. 2017). First, all metal ions that were able to form complex with the dithizone and could disturb the mercury(II) assay were removed from the RC solution. After addition of variable amounts of HgCl2, the RC solution was passed through a 10 kDa molecular filter. The concentration of free (unbound) Hg2+ was determined from the normalized difference of the absorbances (A) measured at 480 nm (Hg2+-dithizonate) and 585 nm (dithizone): R=(A585–A480)/A585 (Greenberg et al.
1992). The assay was calibrated by construction of the standard curve of R vs. the concentration of HgCl2 solution before each measurement.
Optical measurements. The steady state and room temperature absorption spectra were recorded on a Helios γ spectrophotometer (Thermo Electron Corporation). The kinetic traces of absorption changes induced by saturating Xe flash or by continuous illumination were detected by a home-constructed spectrophotometer (Maróti and Wraight 1988). The charge recombination was followed at wavelengths 430 nm or 860 nm, the first electron transfer at 402 nm and the second electron transfer at 450 nm. For mercury(II) treatment in light, the RC was illuminated in the optical cuvette via a fiber guide from a halogen lamp (200 W) through a red-pass filter (R-690) at right angle to the monochromatic measuring beam. The illumination was electronically controlled by a photographic shutter (Melles Griot 04 IES 001). At specific times, the illumination was switched on, mercury(II) was added and mixed and after particular duration, the exciting light was switched off for kinetic measurements.
The decay of the yield of delayed fluorescence of the bacteriochlorophyll dimer after flash excitation was measured by a home-made kinetic fluorometer described earlier (Turzó et al. 2000;
Filus et al. 2004; Maróti and Wraight 2008; Asztalos and Maróti 2009). The free energy drop from P* to P+QA−, ΔGP*A, was calculated by comparison of the delayed and prompt fluorescence yields, according to (Arata and Parson 1981):
ph fl fl D Q B
P ()d
)d ln (
* A
η η k k t t PF
t t T DF
k
G , (1)
where ∫DF(t)dt and ∫PF(t)dt are the integrated intensities of delayed and prompt fluorescence, measured in the same sample but at very different excitation intensities (both in the linear region) to give similar emission intensities. ∫DF(t)dt is determined by a one-exponential fit to the decay of the delayed fluorescence signal; ∫PF(t)dt is determined by electronic integration of the prompt fluorescence, using a time constant (0.1 s) similar to that of the delayed fluorescence decay time. The Boltzmann factor is kBT (25 meV at room temperature), the radiative rate constant of prompt fluorescence is kfl (= 8·107 s−1 (Arata and Parson 1981; McPherson et al. 1990)), the quantum yield of photochemical trapping is ηph (≈1.0 (Wraight and Clayton 1974)), the quantum yield of the prompt fluorescence is ηfl (4·10−4 (Zankel et al. 1968; Woodbury et al. 1985)) and the rate of decay of the delayed fluorescence is kD that coincides with the rate of the P+QA− → PQA charge recombination.
As the kinetics are not strictly exponential (McMahon et al. 1998), the determination of kD based on single exponential decomposition of the delayed fluorescence decay may introduce some systematic errors in the determination of the free energy gap ΔGP*A (Rinyu et al. 2004; Maróti and Wraight 2008). RC of high purity (< 1.30) is needed where fluorescence of the impurities is negligible.
The circular dichroism (CD) spectra in the spectral range of 550–900 nm were recorded with a JASCO 815 spectropolarimeter. RC samples were solubilized in TL buffer (10 mM Tris and 0.03%
LDAO at pH 8). The measurements were performed in a standard UV quartz cell of 1-cm optical path length at room temperature.
Electrochemical redox titration. The redox midpoint potential of P/P+ of the RC was measured by a homebuilt electrochemical cell with a three-electrode-arrangement (Mäntele 1993) equipped in a steady-state spectrophotometer. The working electrode was a fine gold mesh with 55% optical transparency, the counter electrode was a Pt wire ring and Ag/AgCl served as the reference electrode.
The electric potentials of the working and reference electrodes were controlled by a PGSTAT10 potentiostat/galvanostat at ambient temperature. The typical medium contained the following redox mediators: 4 M phenazine ethosulphate, 4 M phenazine methosulphate, 40 M TMPD, 40 M 2,6- dichlorophenolindophenol, 20 M 1,2-naphthoquinone, 20 M 1,4-naphthoquinone, 20 M 2,5- dihydroxy-p-benzoquinone, 20 M anthraquinone sulphonate and 150 M potassium ferricyanide.
The relative amount of oxidized P at each potential was determined from the magnitude of the absorption maximum at 865 nm and 835 nm compared with the absorption maximum at 800 nm. The
optical path and the volume of the cell were 50 µm and 200 µL, respectively. Before each measurement, a minimum of 5 min equilibration was allowed to permit the sample to achieve the actual redox potential. All experiments were performed at room temperature.
Curve fitting procedures and structural prediction of Hg binding to RC. Least-squares optimization was used 1) to decompose the complex kinetic traces of flash-induced absorption changes and fluorescence decay into exponentials and 2) to estimate the model parameters. The optimization algorithms were implemented in Matlab (The MathWorks, Natick, MA). The RC coordinates were taken from protein data bank (rcsb.org) 3I4D (Fujii et al. 2009) and PyMol software was used for presentation.
Results
Multiple binding equilibrium of mercury(II) ions by RC.
The stoichiometry of mercury(II) binding to RC was measured by dithizone assay. The number of binding sites
Hg2 bound/
RCwas determined from the directly measurable total and free Hg2+
concentrations as [Hg2+]bound = [Hg2+]total –[Hg2+]free. The number of occupied binding sites on the RC increased in two waves upon increase of the free Hg2+ ions in the solution and a relatively large mercury(II) concentration ([Hg2+]/[RC]>103) was needed to saturate the Hg2+ binding (Fig. 1). The binding curve indicates that the RC protein has approximately 500 binding sites having weak or strong affinity for mercury ions whose binding constants and binding numbers differ by two orders of magnitudes at least. Very few mercury(II) ions are taken up by high affinity and the vast majority of the mercury(II) ions are picked up nonspecifically with weak binding.
Figure 1. Number of occupied binding sites
Hg2 totalHg2 free
/
RC on native RC () and on RC treated by sulfhydryl modifiers pCMB (▲) and NEM (□) as a function of free mercury(II) concentration [Hg2+]free in double logarithmic representation. The points were fitted by a model of two types of identical and independent binding sites (see Eq. (2)). The arrows show the observed half-[Hg2+]/[RC] concentrations derived from inhibition of the second electron transfer, the first electron transfer and charge recombination and the steady state red absorption band of the dimer, respectively. Conditions:[RC] = 1 M in TL buffer; [NEM] = 20 mM; [pCMB] = 5 mM.
Sulfhydryl-modifying reagents pCMB and NEM were We used in this experiment sulfhydrylmodifying reagents in an attempt to alter the binding effects of the mercury (Fig 1). The purpose of the pCMB and NEM reagents was to reveal clarify the high affinity binding sites to where a very few mercury(II) ions are bound with high binding constants.
Mercury(II)-induced spectroscopic and energetic changes of the RC
The Hg2+ ions bound in large number and mainly nonspecifically to the RC, and induce characteristic structural and functional changes of the protein including the pigments (primarily the BChl dimer) and the electron transport both on the donor and acceptor sides. The harmful effect of Hg2+ on the RC can be followed by the steady state red absorption spectra of two pigments, the dimer (P, 860 nm) and the monomeric BChl (800 nm) (Fig. 2A). The dimer is more sensitive to the presence of high concentrations of mercury(II) and a substantial drop of the absorption can be observed when [Hg2+] approaches the saturation level. This change is accompanied by an increase in the slope of the straight line from +1 to +2 in the Hill plot constructed from Fig. 1 (not shown). This may reflect a structural change of the RC localized to the dimer. The monomeric BChl, however, does not show a significant loss even at saturating Hg2+ concentrations. Similarly, the primary photochemistry has proved to be highly resistant to the mercury(II) attack as the RC maintained the main function of charge separation (formation of P+and QA−) even at saturating Hg2+ concentrations (see Fig. 3D).
Consider the first signs and consequences of mercury(II) effects on the RC which appear well below the saturation level. The steady-state absorption spectrum of the dimer band (at 865 nm) shows a clear blue shift by ~ 30 nm upon mercury(II) treatment up to [Hg2+]/[RC] = 100 without loss of the amplitude (Fig. 2A). While the positions and the amplitudes of the absorption bands of the monomeric BChl (at 800 nm) and the BPheo (at 760 nm) remain unchanged, the shift of the dimer band is reversible and a clear isosbestic point is observable. This indicates that there is an interconversion of two components that absorb at 865 nm and 835 nm. The mercury(II)-induced blue shift of the dimer absorption band can be reverted by a decrease in the pH with characteristic pKa of 6.1 (Fig. 2B). This observation suggests the importance of an acidic protonatable group in the vicinity of the dimer whose protonation would inhibit the binding of Hg2+, causing a red shift of the dimer band. The mercury(II)- induced shift should have an electrostatic origin as it can be reversed by ionic screening at sufficiently high ionic solution strength (Fig. 2C).
Figure 2. Blue-shift of the steady-state absorption band of the RC dimer due to increase of Hg2+ concentration (A); pH-titration of the blue shift caused by 100 [Hg2+]/[RC] (B) and reversal of the blue shift attributed to increase of the ionic strength of the NaCl solution (C). Conditions: 1 µM RC, TL buffer and increase of [HgCl2] up to 100 [Hg2+]/[RC] (A), pH adjusted by HCl or KOH in pH buffer mixture (B) and increase of [NaCl] up to 50 mM (C).
The mercury(II)-induced energetic change of the dimer is expressed not only by the blue shift of the dimer absorption band but by modification of the CD spectrum of the RC (Fig. 3A), by positive shift of the redox midpoint potential of P/P+ (Fig. 3B) and by increase of the intensities of the delayed
(DF) and prompt (PF) fluorescence of the BChl dimer (Fig. 3C). The changes of the CD spectrum due to Hg2+ binding are qualitatively consistent with energetic perturbation of the dimer as the characteristic dimerlike CD bands, large, narrow and negative at 810 nm and smaller, broader and positive at 860 nm (Zabelin et al. 2009) are obviously modified but P still preserves its dimeric character.
The electrochemical redox titration of P/P+ follows single (Nernst) component of midpoint redox potential Em ~500 mV in the untreated RC and Em ~535 mV in the presence of 50 [Hg2+]/[RC]
and Em ~545 mV in the presence of 100 [Hg2+]/[RC]. The electrostatic influence of bound Hg2+ ion in the vicinity of P causes an increase of Em by 47±12 mV.
Significant increases inthe intensities of DF and PF are observed upon addition of Hg2+ (Fig.
3C). As the increase of the observed DF is accompanied by a similar increase in the PF, the free- energy gap between P* and P+QA– derived from Eq. (1) remains nearly unchanged upon mercury(II) treatment (Fig. 3D). As with the free energy level of P/P*, we found that the free energy level of QA/QA– was also insensitive to Hg2+. This was determined by detection of flash-induced charge recombination in the RC where the native UQ was replaced by AQ (anthraquinone) at the QA site.
Due to the low potential quinone at QA, the P+QA–PQA back reaction occurred through a thermally activated P+BPhe− transient state; therefore the rate of charge recombination became sensitive to the free energy level of QA. However, the mercury(II) treatment did not affect the rate of back reaction indicating a negligible effect of Hg2+ on the energetics of QA (data not shown). Taking into account the relevant energetic changes, the +47 meV increase in the P/P+ state obtained from electrochemical measurements accounts entirely for the +49 meV increase of the P/P* gap causing the observed 30 nm blue shift of the dimer absorption band of the mercury(II) treated RC. The independent energetic measurements clearly demonstrate that the mercury(II) ions exercise a much larger energetic influence to the dimer side than to the primary acceptor side of the RC.
Figure 3. Energetic changes of the RC dimer (P) induced by mercury(II) ion tracked by different methods. A) steady state CD spectrum of the RC before (black) and after (red) treatment with 100 M [Hg2+]/[RC]. Conditions: 3 µM RC in TL buffer; B) Redox titration of P/P+ measured at the red absorption band in the absence (black, 865 nm) and in the presence (red and blue, 835 nm) of 50 [Hg2+]/[RC] and 100 [Hg2+]/[RC]. The complex band due to blue shift of Hg2+ was decomposed into Gaussian components. Conditions: 75 µM RC in TL buffer, 1 mM bipiridyl, 150 µM ferriCN. C) Relative yields of delayed (DF) DF(t)|Hg2dt/DF(t)|0dt and prompt (PF) PF(t)|Hg2dt/PF(t)|0dt fluorescence and D) free energy gap between P* and P+QA– upon increase of the mercury(II) concentration. Conditions: 1 M RC in TL buffer, 60 M terbutrin.
Electron transfer measurements
One of the most essential functions of the RC is the movement of electron to P+ via docked reduced cytochrome (cyt) c protein. To study the effect of Hg2+ on the cyt c binding site, the flash-induced kinetics of the reduction of P+ by cyt c2+ (decay of P+) and oxidation of cyt c2+ by P+ (increase of cyt c3+) were measured at 835 nm and at 550 nm vs. 540 nm wavelengths, respectively. The multicomponent flash-induced P/P+ and cyt c2+/cyt c3+ kinetics were very similar in the native and mercury(II) treated RCs (data not shown). One can conclude that the mercury(II) ion does not modify the docking of the reduced cyt c to the RC nor the electron transfer from cyt c22+ to P+.
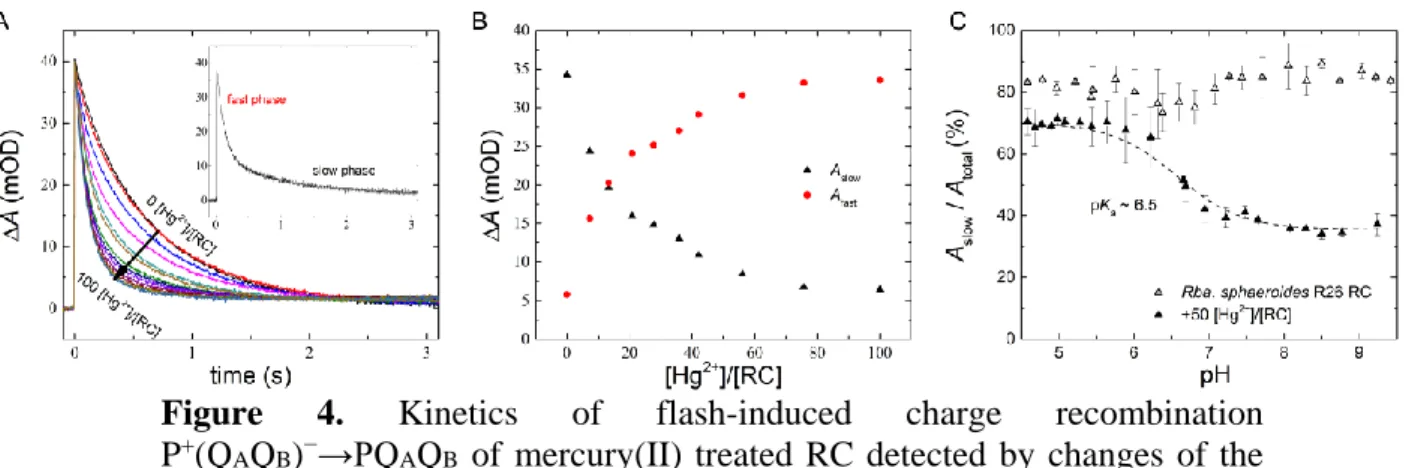
The P+(QAQB)−→PQAQB charge recombination detected by absorption change at 430 nm serves as a valuable tool to track structural and functional changes of the RC. The decay kinetics after flash excitation can be decomposed into fast and slow phases (Fig. 4A). Whereas the fast component with ~120 ms decay time constant and ~ 15% relative amplitude in our experiment corresponds to RCs with lack of QB activity (P+QA−→PQA), the slow component results from sharing the electron in the quinone complex between QA and QB (P+QAQB−→PQAQB). Upon addition of Hg2+ ions, the amplitude of the slow phase gradually decreases while that of the fast phase increases keeping the total amplitude constant (Fig. 4B). The decay times of the phases remain constant during the mercury(II) treatment. At [Hg2+]/[RC] ~ 100 stoichiometry, the fast component will dominate indicating the nearly complete inhibition of QB activity (the recombination originates entirely from the primary acceptor). The mercury(II) effect on the QB-mediated back reaction is reversible as the decrease of the amplitude of the slow component can be reverted and the bound Hg2+ ions can be screened by sufficiently high ionic strength (data not shown). These results are a clear sign of inhibition of the QB activity by the Hg2+ ion bound in the vicinity of the acceptor side. The inhibition is pH-dependent: a protonatable group of pKa~6.5 influences the effect of mercuric ion (Fig. 4C). Its protonated form protects the QB activity from harmful effects of Hg2+ ions.
Figure 4. Kinetics of flash-induced charge recombination P+(QAQB)−→PQAQB of mercury(II) treated RC detected by changes of the
absorption at 430 nm (A), combined changes of the amplitudes of the fast and slow phases (B) and pH dependence of the amplitude of the slow phase in the absence and in the presence of 50 μM Hg2+ (C). Conditions: 1.5 µM RC in TL buffer and 0-100 [Hg2+]/[RC] (A and B) and 1 mM MES, MOPS, Tris, CHES and CAPS buffers respectively and 50 [Hg2+]/[RC] (C).
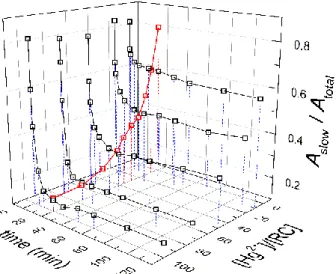
The Hg2+-ion needs some time to occupy the binding site close to QB and to perform its action described above. Thus, the observed mercury(II) effect on the charge recombination depends not only on the applied Hg2+ concentration but on the time of treatment, as well. The complex dependence is demonstrated as drop of the fraction of the slow component of the flash-induced P+(QAQB)−→PQAQB
back reaction in a quasi 3D plot (Fig. 5). At room temperature, stationary levels of the amplitudes can be achieved within 10-20 minutes upon the highest levels of mercury(II) treatment.
Figure 5. Time- and concentration dependence of mercury(II) effect on the charge recombination kinetics decomposed into slow and fast phases. The fraction of the slow phase amplitude is measured as function of Hg2+
concentration (at fixed time, red line) and duration of the treatment (at fixed Hg2+ concentration, black lines).
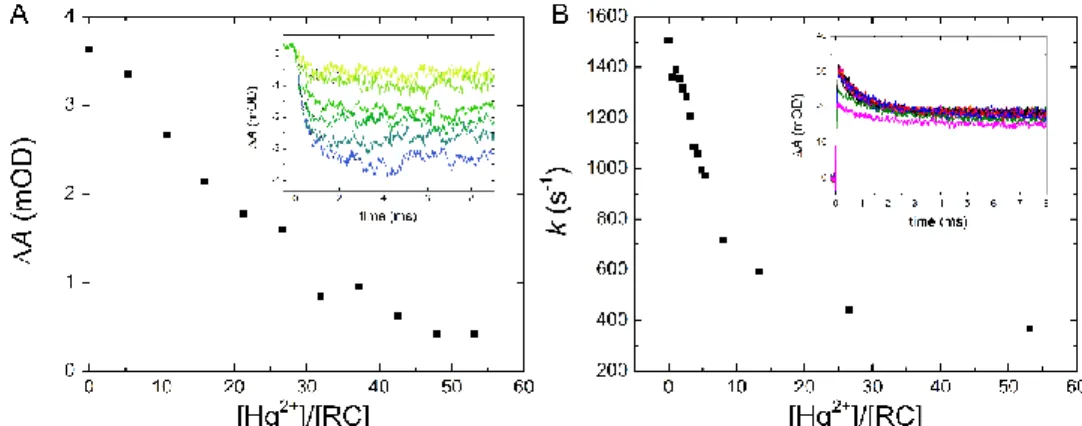
The mercury(II)-induced inhibition of the secondary quinone side can be supported by direct interquinone electron transfer measurements and further details can be revealed. Upon mercury(II) addition to the RC, both the first (QA−QB→QAQB−, Fig. 6A) and the second (QA−QB−→QAQBH2, Fig.
6B) interquinone electron transfers are damaged as the amplitudes and the rate constants of the kinetics are decreased, respectively. However, the sensitivities to mercury(II) exposure are different and therefore the mechanisms of the inhibition might be also different. The amplitude of the first electron transfer drops to half at about 20 [Hg2+]/[RC] stoichiometry which is close to the inhibition value obtained for the charge recombination (see Fig. 4B). This may involve a common origin of the damage, most probably the mercury(II)-induced interuption of QA to QB electron transfer. The inhibition of the 2nd electron transfer is much more (about 5 times) sensitive to the mercury(II) concentration because the drop of the rate of the untreated RC to its half value occurs at ~5 [Hg2+]/[RC] stoichiometry. Based on earlier works on divalent cations (Cd2+, Zn2+ and Ni2+), the mechanism of Hg2+ effect on the 2nd electron transfer is probably not the block of the interquinone electron transfer but rather the inhibition of the proton uptake.
Figure 6. Mercury(II)-induced drop of the amplitudes of the first interquinone electron transfer QA−QB→QAQB− (A) and drop of the rate constants and amplitudes (inset) of the second interquinone electron transfer QA−QB−→QAQBH2 (B). Insets: actual kinetics of absorption changes at 398 nm (A) and 450 nm (B) after the first (A) and the second (B) flash excitation in the absence and presence of fast electron donor to P+, respectively.
Conditions: 1 µM RC in TL buffer (A) and + 20 M cyt c2+ (B).
Charge recombination can be induced not only after flash excitation (dark adapted RC) but also after prolonged and intensive illumination (light adapted RC) that keeps the RC in a charge- separated state for longer period of time (Fig. 7). Under our conditions, about 40% of the generated charge pair behaves as expected after flash excitation: one can observe fast and slow relaxations with
~100 ms and ~1 s decay times from P+QA– and P+QB– states, respectively. However, about 60% of the P+(QAQB)– charge pair generated in the light behaves differently because they perform multiphasic kinetics that extend over a very long time range. After termination of the illumination, the charge pair is resistant to fast recombination and the relaxation becomes extremely slow and kinetically complex in the dark. The charge pair in that fraction of the RC may undergo a series of sub-structural steps of the donor (P) and/or the acceptor (QAQB) sides that would result in more and more stabilized states.
Thermal agitation accelerates the escape of the charge pair from the trapped state as proved by increase of the rate of relaxation upon enhancement of the temperature in the physiological range (data not shown). The mercury(II) treatment (Fig. 7) enhances not only the fraction of RCs taking part in the stabilization process (from about 60% to 90%) but the relaxation time as well, making the charge recombination practically irreversible. P+ in the trapped state is susceptible to an exogenous reductant (ascorbic acid) rather than to QA−
(or QB−
) needed for charge recombination.
Figure 7. Charge recombination kinetics of RC after long and intense illumination detected by absorption change (A) at 430 nm on logarithmic and linear (inset) time scales. Addition of ascorbic acid (arrow) caused sudden drop of A. Conditions: 1.5 µM RC in TL buffer, 10 minutes continuous illumination from 100 W filament lamp, 60 µM terbutrin (if added) and 50 [Hg2+]/[RC] (if added).
Discussion
Our experiments on the stoichiometry of Hg2+ binding demonstrated that an isolated RC protein can bind a large number of mercuric ions. Although the vast majority of the ions bind non-specifically and loosely to the RC, a few of them have strong affinity to the protein and have a direct influence on the photochemical function of the protein. We will list and track these possible binding sites and characterize the ways in which these Hg2+ ions bound to crucial points of the RC achieve their harmful effects.
The mercuric saturation curve in Fig. 1 can be well approximated by a standard model of identical and independent binding sites:
freefreefree free
1
1 K Hg
Hg K n Hg
K
Hg K n
s s s w
w w
(2)
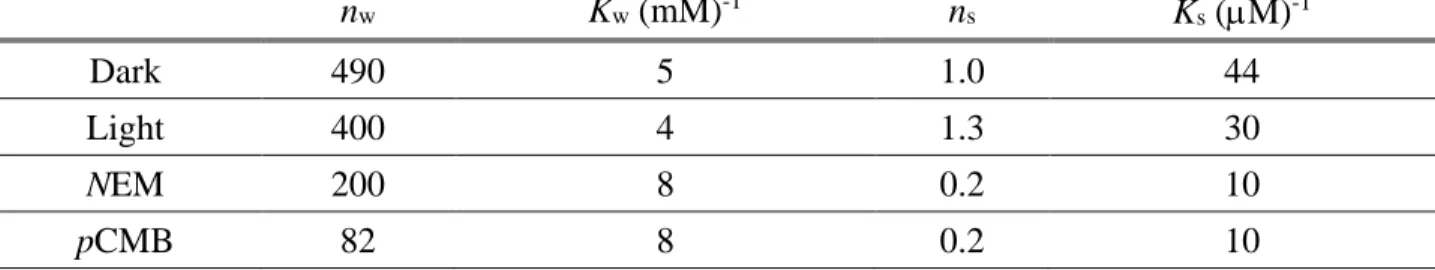
with two different (weak and strong) binding sites of binding numbers nw and ns and of binding constants Kw and Ks. The results of decomposition of the experimentally obtained saturation curves into two components according to Eq. (2) for different conditions are summarized in Table I. The successful decomposition of the Hg2+ binding curve into two phases demonstrates no cooperation of the binding sites over a very wide range of mercury(II) concentration. It is remarkable that despite the large number, the binding sites remain independent, i.e. their binding status does not influence the binding properties of their neighbors.
Very few mercury(II) ions are bound with the high affinity binding constant Ks ~ 50 (M)-1. These binding sites should be associated with sulfhydryl groups because N-ethylmaleimide and p- Chloromercuribenzoate, general sulfhydryl modifying agents, reduce the available number of strong binding sites of Hg2+ significantly. As the number of cysteine residues (5) and methionine residues
(23) is larger than that of the strong binding sites, we conclude that not all –S groups are accessible for Hg2+ binding. It is worth mentioning that the mercury(II) binding site with the strongest affinity has no detectable influence on the photochemical processes. All of the mercury(II)-induced harmful effects on photochemistry arise from a couple of binding sites of moderate strength (0.2 – 0.02 (M)-
1). Unfortunately, these binding sites could not be experimentally separated from the overwhelmingly large number of weak binding sites characterized by Kw ~ 5 (mM)-1. Given that the RC has a relatively large surface, a large number of deep voids and variable electrostatic surface profile, plenty of places for the Hg2+ ions to bind are assured. This is shown in the 3D movie attached to the electronic version of the MS. For comparison with other proteins, even the weak binding constants of mercury(II) to bacterial RC are much larger than those to other proteins such as catalase (Chen et al. 2015) or bovine serum albumin (Chunmei et al. 2014). From the large number of binding sites and relatively high binding affinities, one can conclude that the RC serves as sponge for mercury(II) ions. As the Hg2+
ions are able to accumulate so effectively, they make the protein vulnerable to toxicity. Based on the enhanced sensitivity of the RC to mercury(II), photosynthetic bacterium Rba. sphaeroides can serve as a toxicity bioindicator organism.
Table I. Number of binding sites (n) and binding constants (K) for weak (w) and strong (s) binding of mercury(II) to RC under various conditions (dark/light and treatment with NEM and pCMB sulfhydryl modifiers). Conditions as in Fig. 1. The parameters were derived from fitting the mercury(II) saturation curves by Eq. (2).
nw Kw (mM)-1 ns Ks (M)-1
Dark 490 5 1.0 44
Light 400 4 1.3 30
NEM 200 8 0.2 10
pCMB 82 8 0.2 10
Hg2+ bound closely to the dimer
The NIR absorption band peaking at 865 nm in the RC is identified as the low energy exciton component of the Qy transition of the BChls of the P dimer. The peak position is highly sensitive to the different perturbations of the P environment that affect the electronic structure of the dimer and the coupling between PL and PM. The blue shifts from 865 nm to 845-850 nm was observed upon RC dehydration in polyvinyl alcohol (PVA) films or glassy trehalose matrices and were explained by dehydration-induced reorganizations in the dimeric structure of P (Malferrari et al. 2015). Similar effects were reported as a result of changes in the detergent type and concentration. Positively charged detergent (cetyl-trimethyl-ammonium bromide, CTAB) induced a blue shift of the Qy band in LDAO solubilized RC from Rba. sphaeroides, which was reverted on the subsequent addition of the anionic surfactant deoxycholate (Müh et al. 1997). When RC was solubilized by zwitterionic surfactants (sulfobetaine), the position of the Qy band is tuned by the detergent/RC ratio (Müh et al. 1998).
Furthermore, the position of the Qy band of the dimer was affected by point mutations in the proximity of P. In the two mutants of Rba. sphaeroides, in which the histidine residues coordinating the central Mg2+ ions of the two BChls of P (HisL173 and HisM202) have been changed to leucine, obtaining BChl/Bphe heterodimers, the Qy band is shifted to 850 nm (Müh et al. 1998). Contrary to expectations, the double mutation Ile→HisL177+His→LeuL173 did not bring about a heterodimer RC but caused a 46 nm blue shift of the of the long wavelength P absorption band (Vasilieva et al. 2012).
The observed shifts upon mutations showed some correlation with the introduced H bonds (Allen and Williams 1995; Deshmukh et al. 2011). Generally, the formation of an H-bond with PM resulted in a blue shift in the position of the P-band, and the introduction of the H-bonds with PL caused red shifts
in this parameter (Deshmukh 2013). With the increase in the number of H-bonds from 1 to 3 or 4, the observed shifts of the dimer band from 865 nm became negligible. An abrupt blue shift and an associated broadening of the special pair band were also observed at high (about 265 MPa) pressure (Timpmann et al. 2017). The reversible change was assigned to a pressure-induced rupture of a lone hydrogen bond that binds the photo-chemically active L-branch primary electron donor bacteriochlorophyll cofactor to the surrounding protein scaffold. In addition, other different reasons may induce the shift of the dimer absorption band including the reconstitution of the QB site (Debus et al. 1985), the aggregation of the protein (Gast et al. 1996) or the solubilization in non-aqueous solvents (Milano et al. 2017).
We observed a blue shift of similar magnitude upon treatment of the RC with increasing concentration of mercury(II) ions up to 100 [Hg2+]/[RC], and a well-defined isosbestic wavelength between the steady state absorption spectra of the monomeric and dimeric BChls of the untreated RC (Fig. 2). The blue shift under different conditions listed above strongly suggests a common origin and accounts for the specific binding of Hg2+ ions to the donor side and for the participation in Mg2+
coordination by the macrocycles of the dimer. The isosbestic point proves 1) the presence and equilibrium of two (and only two) components absorbing in that spectral region and 2) the absence of any intermediate species of significant concentration between the untreated and mercury(II) treated RCs. It is remarkable to relate this observation to the comparative study in RC purified from various species of purple bacteria, where the existence of two classes of RC, characterized by Qy transitions at 865 and 850 nm was demonstrated (Wang et al. 1994).
The isosbestic point comes from a 30nm blue spectral shift of the absorption band of the dimer when the mercury(II)/RC concentration ratio is about 50. The mercury(II)-induced blue shift can be gradually reduced and even eliminated when the ionic strength of the solution is increased. This screening of the influence of Hg2+ strongly indicates that the interaction between the positive charge of the mercury(II) ion and the essential part of the π system of the electrons in P is electrostatic in nature. Contrary to that observed for the dimer, a similar shift of the absorption band of the monomeric BChl was not observed indicating that the location of Hg2+ binding should be closer to P than to BChl, or to the atoms determining the distribution of their π electrons.
It is worth noting that the fluorescence spectrum of the dimer of the mercury(II)-treated RC does not suffer a blue shift of similar magnitude as observed in the absorption spectrum. The mercury(II) could have different (asymmetric) effects on the electronic structures of the dimer in the ground (S0) and excited (S1) singlet states resulting in an increase in the Stokes shift between the central transitions of the absorption and fluorescence spectra. Measurements on model systems and/or approximate quantum mechanical calculations could reveal the exact location of mercury binding and account for the observed spectral shift.
Parallel with the blue shift of the dimer absorption band, an increase of approximately 45 mV in the dimer midpoint potential was observed after mercury(II) treatment (Fig. 3B). It is well established that the P◦/P•+ redox midpoint potential increases with the number and strength of H- bonds to the conjugated carbonyl groups of P (Ivancich and Mattioli 1998). As the Hg2+ ions rather decrease than increase the total number of H-bonds, the increase of Em of the dimer is due to other factors including changes of the local charges, conformational geometries and excitonic interactions.
The Hg2+ ion bound to the vicinity of the dimer can account for these changes.
Hg2+ bound to the proton gate
Bivalent cations (Zn2+, Cd2+ and Ni2+) have very high affinity to the entrance of the proton channel consisting of three major protonatable amino acids AspH124, HisH126 and HisH128 and block the uptake of the H+ ions from the aqueous cytoplasmic phase (Paddock et al. 1999; Gerencsér and Maróti 2001).
Figure 6B demonstrated that Hg2+ performed a similar obstruction of proton uptake but with a significantly smaller binding constant (~ 5 (M)-1). It became also evident that the Hg2+ ion bound to the proton gate did not modify the interquinone electron transfer. Therefore, an additional strong
mercury(II) binding site should exist on the cytoplasmic side that severely influences the electron transfer from QA to QB.
Hg2+ bound closely to QB
As the rate of interquinone electron transfer is much (about 103 times) slower than expected from the Marcus theory (~106 s-1), protein conformational gating should control the QA−→QB electron transfer (Graige et al. 1996). Although the exact mechanism of the switch is under debate, movements of QB
from distal (inactive) to proximal (active) positions (Stowell et al. 1997; Koepke et al. 2007) and/or of the subdomain of the H subunit with natural boundaries of ProH121 and ThrH226 (Katona et al. 2005) and/or even a single residue (Shlyk et al. 2017) are possible candidates. We observed that the Hg2+
ion blocked the conformational gate and the first electron transfer (together with the slow phase of the charge recombination) was inhibited. As the energetics of the primary quinone has not been modified under mercury(II) treatment, the Hg2+ had to sit close to and influence the energetics of QB. We attribute the action of bound Hg2+ to block the movement of the mobile secondary quinone and/or the subdomain of the H subunit. Whereas QB is involved in an extended H-bonding structure (the O4
carbonyl with HisL190 Nδ, the O1 carbonyl likely with SerL223, IleL224 and GlyL225 (Paddock et al. 2007;
Wraight and Gunner 2009) and one methoxy-group with ThrL226 NH) in the (to the non-heme Fe2+) proximal position, a single hydrogen bond between one oxo-group of QB and the N of IleL224 is formed in the distal conformation. As discussed in the case of the dimer site, the binding of Hg2+ ion can easily break the crucial H-bonds making the structure unable to move and fulfill the conformational switch necessary for the interquinone electron transfer.
As the mercury(II) binding constants to the proton gate and to the sensitive point of the conformational gate are very close, the inhibition of proton uptake and interquinone electron transfer can be separated in a narrow Hg2+ concentration range (5-50 μM) only. At higher concentrations, the mercury(II) blocks both the proton uptake and the interquinone electron transfer.
Time-dependent inhibition of the charge recombination
The conformational block is not always a prompt consequence of the mercury(II) binding to the RC but can be delayed according to
conf2 RC-Hg RC-Hg
Hg
RC KB kconf (3) The rate constant kconf is relatively small and represents a complex process. It could be measured as the relative amplitude of the slow phase of the back reaction after both flash excitation (Fig. 5) and prolonged strong illumination (Fig. 7). Shorter (after flash excitation) and longer (after long and bright illumination) delays were required to develop the final conformational states. The nature of the conformational changes exposed to the P+(QAQB)− charge pair are different. As discussed above, we propose that the acceptor side is unambiguously responsible for the conformational change that inhibits the interquinone electron transfer after flash excitation. After prolonged exposure, however, the donor side accounts for the extremely long process of the recombination: the P+(QAQB)− charge pair undergoes stabilization via a series of conformational substates (van Mourik et al. 2001;
Andréasson and Andréasson 2003; Kriegl et al. 2003). As soon as the oxidized dimer (P+) was chemically reduced during the recombination process, the slow decay terminated immediately. The light-driven conformational substates around the dimer cause the extreme long lifetime of the charge pair. The mercury(II) ions bound to the dimer site facilitate further the stabilization by control of the conformational changes (dynamics) of the RC. Long lived P+ generated by extended and bright illumination and Hg2+ bound close to the dimer have similar effects on the conformational free energy landscape of the charge pair.
The mercury(II)-treated RCs suffer damages similar to those treated with trypsin (Brzezinski and Andreasson 1995) and the comparison is interesting. Trypsin cleaves the protein preferentially at
Arg and Lys residues and modifies its function in a time-dependent manner reflected in changes of the charge recombination rate, in inhibition of the QA– → QB electron transfer and eventually in block of the charge separation. In contrast to Hg2+ ions, the tryptic digestion (trypsination) in the dark degrades the acceptor side preferentially and affects the charges close to the QA binding site but leaves the donor side relatively intact. The dark/light transition does open the RC structure for additional targets upon trypsination but not upon mercury(II) treatment (Table 1).
Conclusions. Among the possible targets of mercury(II) attack to whole cells (Kis et al. 2017) and membranes (chromatophores) of photosynthetic bacteria (Asztalos et al. 2012), the photochemistry of the RC protein has proved the most sensitive. The dimer and the secondary quinone are the most vulnerable sites marked by inhibition of the proton uptake and the interquinone electron transfer. The Hg2+ ions bind to these sites reversibly by relatively large binding constants and impede the photochemistry via changes of the electrostatics, H-bond structure, conformation and dynamics of the protein. Attempts were made to identify the mercury(II)-induced mechanisms leading to subsequent inhibition of the major photochemical processes. This study successfully furthered the understanding of the toxicity mechanism of mercury(II) on bacterial reaction center protein at the molecular level.
Acknowledgements. We are grateful to Prof. James Smart (Department of Biological Sciences, University of Tennessee at Martin, USA) for valuable discussions and gratefully acknowledge financial support from GINOP-2.3.2-15-2016-00001, OTKA-K 112688, Photosynthesis – Life from Light – Foundation (Hungary) (GS), COST (CM1306) and EFOP-3.6.2-16-2017-0005 (MK and PM).
References
Allen JP, Williams JC (1995) Relationship between the oxidation potential of the
bacteriochlorophyll dimer and electron transfer in photosynthetic reaction centers. J Bioenerg Biomembr 27 (3):275-283. doi:10.1007/Bf02110097
Andréasson U, Andréasson LE (2003) Characterization of a semi-stable, charge-separated state in reaction centers from Rhodobacter sphaeroides. Photosynth Res 75 (3):223-233.
doi:10.1023/A:1023944605460
Arata H, Parson WW (1981) Delayed fluorescence from Rhodopseudomonas sphaeroides reaction centers - Enthalpy and free-energy changes accompanying electron-transfer from P870 to quinones. Biochim Biophys Acta 638 (2):201-209. doi:10.1016/0005-2728(81)90228-0 Asztalos E, Italiano F, Milano F, Maróti P, Trotta M (2010) Early detection of mercury
contamination by fluorescence induction of photosynthetic bacteria. Photochem Photobiol Sci 9 (9):1218-1223. doi:10.1039/c0pp00040j
Asztalos E, Maróti P (2009) Export or recombination of charges in reaction centers in intact cells of photosynthetic bacteria. Biochim Biophys Acta 1787 (12):1444-1450.
doi:10.1016/j.bbabio.2009.06.007
Asztalos E, Sipka G, Kis M, Trotta M, Maróti P (2012) The reaction center is the sensitive target of the mercury(II) ion in intact cells of photosynthetic bacteria. Photosynth Res 112 (2):129- 140. doi:10.1007/s11120-012-9749-2
Axelrod HL, Abresch EC, Paddock ML, Okamura MY, Feher G (2000) Determination of the binding sites of the proton transfer inhibitors Cd2+ and Zn2+ in bacterial reaction centers.
Proc Natl Acad Sci USA 97 (4):1542-1547. doi:10.1073/pnas.97.4.1542
Brzezinski P, Andreasson LE (1995) Trypsin treatment of reaction centers from Rhodobacter sphaeroides in the dark and under illumination: protein structural changes follow charge separation. Biochemistry 34 (22):7498-7506. doi:10.1021/bi00022a025
Chen L, Zhang J, Zhub Y, Zhang Y (2015) Molecular interaction of inorganic mercury(II) with catalase: a spectroscopic study in combination with molecular docking. RSC Adv 5 (97):79874-79881. doi:10.1039/C5RA15301H
Chunmei D, Cunwei J, Huixiang L, Yuze S, Wei Y, Dan Z (2014) Study of the interaction between mercury (II) and bovine serum albumin by spectroscopic methods. Environ Toxicol Phar 37 (2):870-877. doi:10.1016/j.etap.2014.01.021
Debus RJ, Feher G, Okamura MY (1985) LM complex of reaction centers from
Rhodopseudomonas sphaeroides R-26 - characterization and reconstitution with the H- subunit. Biochemistry 24 (10):2488-2500. doi:10.1021/bi00331a015
Deng C, Zhang D, Pan X, Chang F, Wang S (2013) Toxic effects of mercury on PSI and PSII activities, membrane potential and transthylakoid proton gradient in Microsorium pteropus.
J Photochem Photobiol B 127:1-7. doi:10.1016/j.jphotobiol.2013.07.012
Deshmukh SS (2013) Molecular assignment of light-induced structural changes using site-directed mutant reaction centers. Concordia University, Montreal, Quebec, Canada
Deshmukh SS, Williams JC, Allen JP, Kálmán L (2011) Light-induced conformational changes in photosynthetic reaction centers: redox-regulated proton pathway near the dimer.
Biochemistry 50 (16):3321-3331. doi:10.1021/bi200169y
Filus Z, Laczkó G, Wraight CA, Maróti P (2004) Delayed fluorescence from the photosynthetic reaction center measured by electronic gating of the photomultiplier. Biopolymers 74 (1- 2):92-95. doi:10.1002/bip.20051
Fujii R, Adachi S, Roszak AW, Gardiner AT, Cogdell RJ, Isaacs NW, Koshihara S, Hashimoto H (2009) Structure of the carotenoid bound to the reaction centre from Rhodobacter
sphaeroides 2.4.1 revealed by time-resolved X-ray crystallography.
doi:10.2210/pdb3i4d/pdb
Gao JL, Wraight CA (1990) Sulfhydryl modifying reagents inhibit QA- oxidation in reaction centers from Rhodobacter sphaeroides and capsulatus, but not Rhodopseudomonas viridis.
Photosynth Res 26 (3):171-179. doi:Doi 10.1007/Bf00033130
Gast P, Hemelrijk PW, VanGorkom HJ, Hoff AJ (1996) The association of different detergents with the photosynthetic reaction center protein of Rhodobacter sphaeroides R26 and the effects on its photochemistry. Eur J Biochem 239 (3):805-809
Gerencsér L, Laczko G, Maróti P (1999) Unbinding of oxidized cytochrome c from photosynthetic reaction center of Rhodobacter sphaeroides is the bottleneck of fast turnover. Biochemistry 38 (51):16866-16875. doi:10.1021/bi991563u
Gerencsér L, Maróti P (2001) Retardation of proton transfer caused by binding of the transition metal ion to the bacterial reaction center is due to pKa shifts of key protonatable residues.
Biochemistry 40 (6):1850-1860. doi:10.1021/bi0021636
Giotta L, Agostiano A, Italiano F, Milano F, Trotta M (2006) Heavy metal ion influence on the photosynthetic growth of Rhodobacter sphaeroides. Chemosphere 62 (9):1490-1499.
doi:10.1016/j.chemosphere.2005.06.014
Graige MS, Paddock ML, Bruce JM, Feher G, Okamura MY (1996) Mechanism of proton-coupled electron transfer for quinone QB reduction in reaction centers of Rb sphaeroides. J Am Chem Soc 118 (38):9005-9016. doi:10.1021/Ja960056m
Greenberg AE, Clesceri LS, Eaton AD (1992). Standard methods for the examination of water and wastewater, 18th edn. Amer Public Health Assn, Washington, D.C.
Gregoire DS, Poulain AJ (2014) A little bit of light goes a long way: the role of phototrophs on mercury cycling. Metallomics 6 (3):396-407. doi:10.1039/c3mt00312d
Hellinga HW (1996) Metalloprotein design. Curr Opin Biotechnol 7 (4):437-441.
doi:10.1016/S0958-1669(96)80121-2
Ivancich A, Mattioli TA (1998) A comparative study of conserved protein interactions of the primary electron donor in photosynthetic purple bacterial reaction centers. Photosynth Res 55 (2-3):207-215. doi:10.1023/A:1006033617734
Kálmán L, Maróti P (1994) Stabilization of reduced primary quinone by proton uptake in reaction centers of Rhodobacter sphaeroides. Biochemistry 33 (31):9237-9244.
doi:10.1021/bi00197a027
Kálmán L, Williams JC, Allen JP (2011) Energetics for oxidation of a bound manganese cofactor in modified bacterial reaction centers. Biochemistry 50 (16):3310-3320.
doi:10.1021/bi1017478
Katona G, Snijder A, Gourdon P, Andreasson U, Hansson O, Andreasson LE, Neutze R (2005) Conformational regulation of charge recombination reactions in a photosynthetic bacterial reaction center. Nat Struct Mol Biol 12 (7):630-631. doi:10.1038/nsmb948
Kis M, Sipka G, Asztalos E, Rázga Z, Maróti P (2015) Purple non-sulfur photosynthetic bacteria monitor environmental stresses. J Photochem Photobiol B 151:110-117.
doi:10.1016/j.jphotobiol.2015.07.017
Kis M, Sipka G, Maróti P (2017) Stoichiometry and kinetics of mercury uptake by photosynthetic bacteria. Photosynth Res 132 (2):197-209. doi:10.1007/s11120-017-0357-z
Koepke J, Krammer EM, Klingen AR, Sebban P, Ullmann GM, Fritzsch G (2007) pH modulates the quinone position in the photosynthetic reaction center from Rhodobacter sphaeroides in the neutral and charge separated states. J Mol Biol 371 (2):396-409.
doi:10.1016/j.jmb.2007.04.082
Kriegl JM, Forster FK, Nienhaus GU (2003) Charge recombination and protein dynamics in bacterial photosynthetic reaction centers entrapped in a sol-gel matrix. Biophys J 85 (3):1851-1870. doi:10.1016/S0006-3495(03)74613-X
Malferrari M, Turina P, Francia F, Mezzetti A, Leibl W, Venturoli G (2015) Dehydration affects the electronic structure of the primary electron donor in bacterial photosynthetic reaction centers: evidence from visible-NIR and light-induced difference FTIR spectroscopy.
Photochem Photobiol Sci 14 (2):238-251. doi:10.1039/c4pp00245h
Mäntele W (1993) Reaction-induced infrared difference spectroscopy for the study of protein function and reaction-mechanisms. Trends Biochem Sci 18 (6):197-202. doi:Doi 10.1016/0968-0004(93)90186-Q
Maróti P, Govindjee (2016) The two last overviews by Colin Allen Wraight (1945-2014) on energy conversion in photosynthetic bacteria. Photosynth Res 127 (2):257-271.
doi:10.1007/s11120-015-0175-0
Maróti P, Wraight CA (1988) Flash-induced H+ binding by bacterial photosynthetic reaction centers - comparison of spectrophotometric and conductimetric methods. Biochim Biophys Acta 934 (3):314-328. doi:10.1016/0005-2728(88)90091-6
Maróti P, Wraight CA (2008) The redox midpoint potential of the primary quinone of reaction centers in chromatophores of Rhodobacter sphaeroides is pH independent. European biophysics journal : EBJ 37 (7):1207-1217. doi:10.1007/s00249-008-0301-4
McMahon BH, Muller JD, Wraight CA, Nienhaus GU (1998) Electron transfer and protein dynamics in the photosynthetic reaction center. Biophys J 74 (5):2567-2587.
doi:10.1016/S0006-3495(98)77964-0
McPherson PH, Nagarajan V, Parson WW, Okamura MY, Feher G (1990) pH dependence of the free energy gap between DQA and D+QA- determined from delayed fluorescence in reaction centers from Rhodobacter sphaeroides R-26. Biochim Biophys Acta 1019 (1):91-94.
doi:10.1016/0005-2728(90)90128-Q
McPherson PH, Okamura MY, Feher G (1993) Light-induced proton uptake by photosynthetic reaction centers from Rhodobacter sphaeroides R-26.1. II. Protonation of the state DQAQB2-. Biochim Biophys Acta 1144 (3):309-324. doi:10.1016/0005-2728(93)90116-W
![Figure 1. Number of occupied binding sites Hg 2 total Hg 2 free / RC on native RC () and on RC treated by sulfhydryl modifiers pCMB (▲) and NEM (□) as a function of free mercury(II) concentration [Hg 2+ ] free](https://thumb-eu.123doks.com/thumbv2/9dokorg/1423414.120593/5.893.208.680.589.906/figure-number-occupied-binding-sulfhydryl-modifiers-function-concentration.webp)
![Figure 2. Blue-shift of the steady-state absorption band of the RC dimer due to increase of Hg 2+ concentration (A); pH-titration of the blue shift caused by 100 [Hg 2+ ]/[RC] (B) and reversal of the blue shift attributed to increase of the ionic stren](https://thumb-eu.123doks.com/thumbv2/9dokorg/1423414.120593/6.893.58.790.463.909/figure-absorption-increase-concentration-titration-reversal-attributed-increase.webp)