Analysis of Households’ Investment Decisions Based on International Data*
Eszter Balogh – Zsuzsa Kékesi – Balázs Sisak
The paper attempts to pinpoint the economic, demographic and risk-taking factors that influence households’ demand for risky financial assets, using the Household Finance and Consumption Survey (HFCS) database as the basis for the analysis.
From the perspective of risky asset holding, supply is also important, and therefore clustering was used to identify several country groups based on capital market features. The study mainly focuses on the countries that are, similar to Hungary, less active based on their capital market features, but the characteristics of countries with a more active capital market are also presented for comparison. In line with the empirical literature, demand for risky assets is examined using econometric tools, isolating the effect of the significant factors. Accordingly, separate logit models were created for the demand factors in the different country groups under review, i.e.
those with a less mature and those with a highly mature capital market. The results indicate that income, wealth, skills and risk-taking positively influence risky asset holding, while liquidity constraints and background risks have a negative influence;
the findings confirm the preliminary expectations and can be deemed robust.
Journal of Economic Literature (JEL) codes: D14, D31, E21 Keywords: income, savings, financial assets, household
1. Introduction
According to widespread empirical evidence, households’ holdings contain a very low share of risky assets, for example equities, well below the theoretical optimum.1 The theory of portfolio selection would warrant a much higher ratio of equities than what is suggested by the data. The lower ratio of equities compared to the theoretical level is characteristic of many countries, even developed ones: despite the higher returns from the risk premium, households underweight equities in their portfolios (Zhan 2015). A salient example for this that among households
* The papers in this issue contain the views of the authors which are not necessarily the same as the official views of the Magyar Nemzeti Bank.
Eszter Balogh is a Junior Analyst at the Magyar Nemzeti Bank. E-mail: baloghes@mnb.hu Zsuzsa Kékesi is a Senior Economic Analyst at the Magyar Nemzeti Bank. E-mail: kekesizs@mnb.hu Balázs Sisak is a Senior Economic Analyst at the Magyar Nemzeti Bank. E-mail: sisakb@mnb.hu The Hungarian manuscript was received on 25 September 2018.
DOI: http://doi.org/10.33893/FER.18.1.6087
in the United States whose liquid instruments amount to at least USD 100,000, only half hold equities. Hungarian households’ equity exposure is low even by international standards. In an international comparison, indirect equity wealth, held through financial institutions (insurers, pension funds, investment funds) is also low in Hungary, although in this respect the country lags a little less behind.
The micro-database of the Household Finance and Consumption Survey (HFCS) facilitates an examination of the reasons behind the low exposure to risky assets indicated in macro data.2 The household-level data collection performed across the euro-area countries in three waves so far was joined by Hungary on a voluntary basis3 in the second wave (2014); the latest survey was conducted in 2017. The survey involved over six thousand households in Hungary in both waves of data collection, and the total sample size in the second wave was over 84,000 (for more information on the sample size by country and the reference year, see Table 5 in the Appendix). In addition to questions on households’ financial assets and liabilities, the survey also covers demographic characteristics and consumption habits, and on the whole, it is the most comprehensive data collection in the European Union.4 The data used to identify factors influencing risky asset holding were taken from the database of the survey’s second wave (hereinafter HFCS).
The study attempts to identify the factors that influence whether households hold risky financial assets, which we deem to include listed equities and mutual funds.
The primary objective of the analysis is to establish households’ demographic, income and wealth characteristics that may play a role in their demand for risky financial assets. At the same time, we believe that in any country, households’
demand is strongly influenced by the supply characteristics of risky financial assets, for example the cost of acquiring the necessary information or the typical form of corporate financing. The logistic regression involves several countries to achieve the necessary sample size and thus robust results, and this merging was performed based on supply-side features. When controlling for the characteristics of the supply side, the depth of the capital market was taken into account, which was quantified using the stock market characteristics available in the World Bank Global Financial Development database. In the end, two country groups were created based on the above: those with an active capital market and those with a less active one.5 Overall, Hungary was grouped with countries where these supply-side characteristics are
2 Access to the HFCS database can be gained as described on the relevant webpage of the European Central Bank (ECB) (https://www.ecb.europa.eu/pub/economic-research/research-networks/html/researcher_hfcn.
en.html), after describing the research objective.
3 In addition to Hungary, Poland also performs the survey on a voluntary basis.
4 Nevertheless, it must be pointed out that a common problem that arises in the case of micro-level statistics is accessing the highest and lowest earners. The real issue with the wealthiest is under-reporting of income.
To tackle this, most countries participating in the HFCS design the survey to ensure that wealthy households are oversampled, but the effectiveness of this varies by the different approaches (ECB 2018).
5 The countries with an active capital market included the Netherlands, France, Germany and Finland, while those with a less active capital market were Lithuania, Greece, Hungary, Poland, Estonia, Portugal, Austria, Slovenia and Cyprus. The two country groups include approximately 21,000–23,000 households (ECB 2016b).
similar, and therefore the results of the regression for the country group containing Hungary also hold true for Hungarian households.
The second section of the paper first describes the theoretical background and then presents the studies on the factors determining risky asset holding as well as the analytical framework. Section 3 demonstrates the process of creating the country groups based on clustering, which seeks to capture supply-side factors. Finally, Section 4 discusses the model and the estimates.
2. Theoretical background and analytical framework
The theoretical framework of households’ risky asset holding is based on the research on households’ saving decisions on the one hand, and on the portfolio theory recommending diversification in investment decisions on the other. While household saving levels have long interested researchers, portfolio selection only later garnered considerable attention. The foundations of modern portfolio theory were laid by American economist Harry M. Markowitz (1952) in 1952, with his study “Portfolio Selection” published in The Journal of Finance. One of the most important findings of the theory is that investors seek to maximise returns and diversify during investment decisions, i.e. invest their liquid assets in several securities, to reduce the perceived risks. Initially, the results of the portfolio theory did not attract much attention, because its significance was not seen at that time. In their studies, Sharpe (1964) and Lintner (1965) used Markowitz’s findings to create the capital asset pricing model (CAPM), which describes the equilibrium relationship between securities’ risk and their expected return. The CAPM model confirmed that the results of portfolio theory can be applied in practice as well.
However, according to empirical evidence, investors do not diversify their portfolios in line with the theory, possibly due to information barriers and bounded rationality.
Researchers also attempted to take into account practical experiences in theory.
According to Kahneman and Tversky (1979), one potential explanation for inappropriate diversification is that investors perceive asymmetric risks. Prospect theory says that individuals are likely to overweight losses relative to gains. At the theory level, an attempt was made to handle this by using different elasticities on underperforming markets for example (Bawa – Lindenberg 1977) or by using the volatility of the underperforming market instead of the expected volatility (Harlow 1991). Empirical evidence also showed that investors assign much greater weight to recent events. The myopic loss aversion (MLA) theory by Benatzi and Thaler (1995) merges loss aversion with another concept of behavioural economics, mental accounting described by Kahneman and Tversky (1984). According to King and Leape (1998), households’ portfolio selection decisions cannot be explained by the traditional portfolio selection model, because households do not diversify. This is partly because their consumption and investment decisions may become intermixed and managing a more diversified portfolio is more expensive.
Age may influence not only the amount of households’ savings but also their composition. According to the life-cycle hypothesis, older households should increase their savings and hold less risky assets (Cocco et al. 2005). This is confirmed by Bodie et al. (1992), who explain that in contrast to older households, younger investors have greater labour market flexibility, and therefore they can better diversify the arising shocks. However, King and Leape (1987) found that age positively influences the probability of risky asset holding, even adjusting for the wealth effect. This is attributed to higher financial awareness, which presumably increases with age. Paxson (1990) also confirms that older households hold more stocks and argues that younger households often face a liquidity constraint, so they primarily prefer liquid assets that are considered relatively safe. According to some studies, risky asset holdings increase early in the life cycle and then decline after a while.
Although the theory of portfolio selection makes normative statements about households’ portfolio allocation decisions, empirical research on people’s decisions is still a relatively new area. The theory of portfolio selection increasingly turned towards empirical evidence as questionnaire-based surveys became widespread.
The liberalisation and modernisation of the financial sector has also affected households’ asset allocation: the emergence of new instruments has dramatically transformed financial markets. Researchers started focusing on micro-databases and exploring the factors that influence households’ asset allocation. Most studies endeavoured to explain the share of listed equities, because according to empirical evidence, due to high risk aversion, households hold only a very low amount of equities, which cannot be explained with the standard theory of portfolio selection.
In the literature, this is referred to as the «equity risk puzzle» (Gollier 2001).
The empirical literature most often examines households’ wealth held in listed equities, which falls well short of the level expected by the theory. International empirical evidence suggests that even though a large number of households could afford to invest in equities, many of them refrain from doing so. In the European countries under review, on average only 27 per cent of the households that have a bank deposit of at least EUR 50,000 hold stocks. Within this group, the proportion of stockowners is the highest among Finnish households, at over 50 per cent, while in Greece the same figure is merely 4 per cent. Accordingly, many households do not venture onto the equity market. In an international comparison, Western European countries typically have a higher share of stockholding households, whereas Eastern Europe, including Hungary, has a lower share. Based on international data for 2014, the two Baltic states, Estonia and Latvia, are also in the low-share group, just like Greece, which took a pounding in a sovereign debt crisis. According to the 2014 HFCS data, 1.3 per cent of Hungarian households held listed equities in their portfolios.
2.1. The role of the supply side
A strong correlation can be identified between households’ direct listed equities holding and the equity financing of non-financial corporations (Figure 1). Households can provide the funds necessary for companies partly through financing bank loans, and partly in a more direct fashion, by purchasing corporate equities. In the more mature European economies, the value of the latter is usually over or close to 10 per cent of GDP. By contrast, in Hungary, the value of equities held by households merely amounts to 2 per cent of GDP (it should be noted that if households’ stock holdings were measured relative to financial assets, the result would be similar as relative to GDP). It should also be taken into account that in more advanced countries the non-financial corporation sector may have equity funds of over 100 per cent of GDP, while in Hungary the corresponding figure is just 20 per cent of GDP. Therefore, even though the literature mainly focuses on the effect of the demand for equities, along with households’ demand-side factors, the corporate sector’s supply-side funding structure must also change to allow the amount of household financing to increase, whether through direct or indirect financing.
6 https://ec.europa.eu/eurostat/web/sector-accounts/overview (Downloaded: 20 May 2018) Figure 1
Value of households’ listed equities and non-financial corporations’ equity financing (relative to GDP, 2017)
0 20 40 60 80 100 120 140 160 180 200
0 2 4 6 8 10 12 14 16 18
20 Per cent Per cent
Households’ stock holding
Stock issued by non-financial corporations (right-hand scale)
Latvia
Slovak Republic Czech Republic
Romania Lithuania Estonia Hungary Bulgaria Portugal Poland Croatia Slovenia Cyprus Greece Ireland Netherlands Italy Austria Luxembourg Germany Spain United Kingdom
France Malta Belgium Finland Denmark Sweden
Source: Eurostat – European Sector accounts6
Among the demand-side factors of risky financial assets, the study also takes into consideration the role of the supply side, and therefore, the logistic regression examines two country groups: those with an active capital market and those with a less active one (Figure 2). European countries were clustered to present the results of the HFCS survey, while the depth of the capital market was measured based on the stock market characteristics available in the World Bank Global Financial Development database (for more on the methodology of creating the groups, see Section 3). Of the four country groups created during clustering, two were involved in the analysis, and the first group includes the countries with a less active capital market, for example Hungary. Four countries were classified into the active capital market group. The group of countries with a less active capital market comprises those with lower risky asset holdings, while in the other group, at least 8–10 per cent of households have risky financial assets.
7 https://www.ecb.europa.eu/pub/economic-research/research-networks/html/researcher_hfcn.en.html Figure 2
Share of households holding risky financial assets (equities or mutual funds) (2014)
0 5 10 15 20 25 30 35 40
0 5 10 15 20 25 30 35
40 Per cent Per cent
Countries with less mature capital market Countries with mature capital market Other countries taking part in HFCS
Latvia Greece Slovak Republic Estonia Poland Portugal Hungary Italy Slovenia Austria Spain Ireland France Netherlands Germany Luxembourg Malta Cyprus Belgium Finland
Source: HFCS7
2.2. Factors influencing demand for risky assets
According to empirical studies, households’ insurance, investment fund, pension fund and equity wealth – in other words the share of all risky financial assets – is strongly correlated to per capita income (Figure 3). In European countries, the wealth held in more sophisticated forms of investment typically grows faster than per capita income, so the correlation is not linear. All in all, in higher-income countries, households hold an increasing share of their wealth in riskier assets. This correlation based on macro data is examined in more detail using the available database. We have a detailed breakdown of households’ financial assets from the HFCS survey:
households were asked to report whether they held bank deposits, bonds, managed accounts, equities and mutual funds, and if so, how many. Bank deposits and bonds are typically not risky assets, while only an insignificant number of households have managed accounts. In addition, pension savings form a separate category, but the survey does not provide information on riskiness, i.e. the portfolio where households hold their pension savings. Therefore, based on the available data, it was decided that the risky financial assets under review should include equities and mutual funds, and the descriptive statistics below also refer to the holders of these assets.
8 https://ec.europa.eu/eurostat/web/sector-accounts/overview (Downloaded: 20 May 2018) and https://ec.europa.eu/eurostat/web/national-accounts/overview (Downloaded: 13 April 2018) Figure 3
Relationship between the equity, mutual fund and insurance wealth of the household sector of European countries and GDP per capita
(2016)
BE
BG
CZ
DK
DE EE
GR
ES
FR
HR
IT CY
LT HU
MT
NL
AT
PL PT
RO SK SL
FI
SE
10 0000 15 000 20 000 25 000 30 000 35 000 40 000
50 100 150 200 250 300
Households' holdings of equities, mutual funds and insurance investment (as a percentage of GDP, 2016)
GDP per capita (PPP, 2016) Source: Eurostat – European Sector accounts, National Accounts8
The HFCS survey confirms that, not unrelated to the unequal distribution of financial assets, the proportion of risky asset holdings strongly depends on households’ gross wealth and income (Figure 4). Based on the micro-database, the proportion of households holding risky assets is the highest in the top quintile. Wealth and income fundamentally determine whether households enter the equity investor market.
Low-income households (first two quintiles, based on gross wealth) hold risky assets in very low numbers. As we approach the higher earners, the proportion of risky asset holding grows increasingly, i.e. the correlation is not linear. This correlation holds true at the country level as well: in Hungary, risky asset holding rises from a lower level and more steeply than in European countries. The distribution of risky financial assets by income quintiles shows a similar picture, albeit a lower overall inequality, and therefore the effect of this is also examined in the model-based approach.
Several studies have pointed out the role of education in holding risky assets. The educational attainment of the head of household (reference person)10 is important from the perspective of stockholding because the more educated access relevant information easier, thereby reducing their entry costs, and therefore education may have a positive effect on owning risky assets. Haliassos and Bertaut (1995) found
9 https://www.ecb.europa.eu/pub/economic-research/research-networks/html/researcher_hfcn.en.html
10 The head of household means the person with the highest financial awareness who filled out the HFCS questionnaire.
Figure 4
Proportion of risky financial asset holders in the gross (real and financial) wealth quintiles
0 5 10 15 20 25 30 35 40 45
0 5 10 15 20 25 30 35 40 45
Quintile 1 Quintile 2 Quintile 3 Quintile 4 Quintile 5 Per cent Per cent
Hungary
Countries with less mature capital market Countries with mature capital market
Source: HFCS9
that in all income groups, stockholding was more widespread among households with higher education. In her extended CAPM model, Bertaut (1998) assumes that investing in equities depends on households’ financial awareness, and thus ultimately on education.
According HFCS data, the education of the head of household strongly determines whether a household holds risky assets (Figure 5). This correlation is clearly reflected in the data. In the countries with an active capital market, households’ stockholding increases with the education of the head of household. While the proportion of those holding risky assets is close to 30 per cent for college or university graduate households, in the case of secondary school qualifications, less than one-fifth of households hold equities or mutual funds. The share of those with any risky asset is much lower than this in the countries with a less active capital market, although higher education raises the proportion here as well. It should be noted, though, that according to the HFCS survey, Hungarians with a basic education essentially do not invest directly in equities or investment funds.
Risky asset holding is influenced not only by education, but also by the profession of the head of household. People like to invest in the company they work for, because
11 https://www.ecb.europa.eu/pub/economic-research/research-networks/html/researcher_hfcn.en.html Figure 5
Relationship between educational attainment and risky asset holding
0 5 10 15 20 25 30 35
0 5 10 15 20 25 30 35
Primary education Secondary education Higher education Per cent Per cent
Hungary
Countries with less mature capital market
Countries with mature capital market
Source: HFCS11
they know how it operates. This is referred to in the literature as the “equity home bias” (Lewis 1999), since it increases households’ risks even though they do not perceive this. From a diversification perspective, it is less appropriate for households to invest in their own workplace, as that results in a positive correlation between earned income and the returns from the portfolio held by households. Nevertheless, Carroll (2001) also confirmed that the households that own stocks typically invest in one type, often that of their own workplace.
Women are typically more conservative investors, while marriage is positively correlated with stockholding. According to the international empirical literature, the gender of the head of household fundamentally determines whether the given household holds equities. Female heads of household are less likely to invest in equities than males. For example, Barber and Odean (2001) found that men are more confident about their financial knowledge and hold riskier portfolios.
Furthermore, in a marriage (multiple-earner households), holding risky assets is also more frequent. This is attributable to the fact that income from two different sources mitigates households’ risks (Agnew et al. 2003). Barber and Odean (2001) also argue that married couples make their investment decisions together, thereby weakening the effect of the difference between the genders.
Among external factors, the studies mostly focus on transaction and information costs, as they can negatively impact households’ risky asset holding, especially among the poor. Haliassos (2005) claims that over the medium term, the greatest challenge faced by the financial sector is managing households’ entry to or exit from the risky asset market rather than the fact that households already holding risky assets reweight their portfolios.
Moreover, borrowing constraints also significantly hamper households’ risky asset holding and reduce the value of households’ risky asset portfolio (Guiso et al. 2001).
The existence of borrowing constraints is typically measured by the responses to some survey rather than the lack of savings. Households having low liquid savings may have a similar effect. This is because as income and gross wealth increases, the probability of liquidity constraints falls (Boldizsár et al. 2016), which may also impact risky asset holding.
Besides households’ gross wealth, their other characteristics, for example their attitude towards risk, also influence portfolio allocation decisions. In theory, higher risk aversion should go hand in hand with greater diversification, which would mean lower risk in a household’s portfolio with a given expected return. However, empirical evidence suggests otherwise, because the more risk-averse a household considers itself, the less risky assets it holds. This may suggest that most households do not fully comprehend the risk-reducing effect of diversification (Barberis – Huang
2001), or that households refuse to run risks even despite the expected returns.
Households’ investment decisions may be influenced not only by their attitude towards risk, but also by the background risks perceived by them (income risk, housing risk) (Guiso – Paiella 2008; Cocco 2004; Heaton – Lucas 2000; Zhan 2015;
Dong – Jiang 2016; Fratantoni 1998; Wältermann 2011).
One common feature of the studies on households’ portfolio allocation is that they consider earned income exogenous, which generates background investment risk,12 thereby also influencing asset accumulation and portfolio composition (Haliassos 2005). In other words, the job of the head of household and the risks perceived related to the household’s income play a major role in households’ financial decisions. Although according to some studies earned income is risky, it is not correlated with the return on equity, and therefore equities should be preferred over less risky assets while maximising returns. However, empirical evidence does not support this, as even a low probability of losing earned income reduces stockholding (Cocco et al. 2005). Most studies have found that households with lower income risk are more willing to run additional risks. Agnew et al. (2003) argue that a secure job mitigates income risks, and therefore increasing risk exposure would be optimal. However, several papers have shown that the form of employment, whether people work as employees or as entrepreneurs, also counts.
King and Leape (1998) and Alessie et al. (2004) found that sole proprietors are more likely to hold equities. Bertaut and Starr-McCluer (2002) on the other hand showed that being an employee correlates positively with stockholding, while being self- employed has a negative correlation.
Households are also held back from investing in risky financial assets by housing risk, especially in the case of young households. First, young households typically have fewer liquid assets due to the housing investments made by this generation, and they cannot afford the costs related to participating on the stock market.
Second, their property is a major asset in the household’s wealth, and therefore the fluctuation of property prices has a significant impact on their wealth. Moreover, the changes in property prices and interest rates also affect the amount of loans that can be taken out by the household (Cocco 2004). So housing risk typically affects young households.
12 These variables cannot be measured accurately, and therefore they were quantified based on the available data as described in Section 4.1, and they were only used in the model presented later.
3. The supply side – Classifying countries by clustering
To explore the role of the supply side, the features of the stock markets in the countries participating in the HFCS were used as a basis. According to the literature, households’ stockholding is influenced by the supply side; in other words, by the features of the stock market of the given country, for example the number of companies present on the stock market, their capitalisation, the level and quality of infrastructure or the cost of accessing the necessary information, and thus our analysis also takes this aspect into account. Therefore in the regression examining households’ risky financial asset holding, the countries most similar from supply aspects should be merged. The depth of the capital market was measured based on the stock market characteristics available in the World Bank Global Financial Development database. However, it should be borne in mind that differentiating the supply side based on these indicators is not all-encompassing as regards the risky financial assets included in the logistic regression. The HFCS survey is used to analyse households’ equities and mutual fund holding, while the clustering of countries by capital market depth is performed based on three stock market indicators (see Table 6 in the Appendix). This simplification is necessary primarily due to the limitations of the available data, however, the idea is justified because households typically hold more stocks in the countries where they also have more investment fund wealth. Moreover, Guiso et al. (2003) notes that investment funds played a central role in spreading the “equity culture” in Western Europe in the 1990s. Accordingly, the effect of capital market depth on households’ risky asset holding was taken into account based on the following capital market indicators:
stock market capitalisation (value of listed stocks), the market value of the stocks traded on the market in the reference period (value of transactions) and the turnover ratio, which measures how often stocks change hands.13 Analysis of the data shows a large standard deviation across countries with respect to all three indicators: it is around 30 in all cases, while values range from a couple of per cent to over 100 per cent in some cases14 (Table 1). With countries’ stock markets showing such great variation, the hypothesis that the supply side needs to be controlled by examining the stockholding of the households in several countries seems confirmed.
13 From the indicators, the values included were for the year when the HFCS survey was carried out in the individual countries, with only five exceptions. For Estonia, Finland, Lithuania and Slovakia only data from one year earlier were available, and in the case of Italy, the data for the turnover ratio was also used from one year earlier (ECB 2016a).
14 Because all indicators are expressed as a percentage, relative standard deviation does not need to be calculated, since the standard deviation values can be directly compared.
Table 1
Descriptive statistics of the stock market indicators of the countries participating in the second wave of the HFCS
Statistics Stock market
capitalisation Value of traded stocks Turnover ratio
Minimum 4.9 0.1 0.2
Average 41.9 20.8 39.3
Maximum 109.7 86.3 138.0
First quartile 14.1 0.7 6.9
Median 34.7 9.2 32.9
Third quartile 65.1 36.7 58.3
Inter-quartile range 51.0 36.0 51.5
Standard deviation 30.1 26.0 37.9
Source: Calculated based on the World Bank – Global Financial Development Database15
Countries with a similar stock market size and turnover were grouped together using clustering, which is one of the most widespread methods for classifying the observations of a sample or population. Clustering comes in many shapes and forms, and this study used agglomerative hierarchical clustering, which has the advantage over the other popular method, k-means clustering that no hypothesis is needed as regards the number of groups.16 Based on the other economic characteristics of the countries under review and due to the considerations regarding the sample size of the micro-analysis, in the end four groups were created using clustering (Table 2).
Table 2
Country groups produced by clustering
I II III IV
Austria Cyprus Estonia Greece Hungary Lithuania Poland Portugal Slovakia Slovenia
Belgium Ireland Luxembourg
Malta
Finland France Germany Netherlands
Italy Spain
15 http://databank.worldbank.org/data/source/global-financial-development (Downloaded: 4 June 2018)
16 Hierarchical clustering is a process that initially regards all observations as a separate cluster and merges nearby groups step by step based on the chosen distance calculation and merging process. When uninterrupted, this produces a cluster that contains all the observations. The whole chain was taken into account in the merging process of hierarchical clustering (farthest first – merging the two nearest groups where the distance between their farthest elements is the shortest), while Euclidean distance was used
Of the four groups that resulted from clustering, one can be identified as the country group with a less deep capital market, while another cluster includes the countries with a deeper capital market based on all indicators (Figure 6). To understand the outcome of the classification, the dendrogram of the clustering, which shows the sequence of the classification of the countries, and the original data should be taken into account. This clearly sets apart Cluster III, which includes countries with a mature stock market based on all three indicators. The same holds true for Cluster IV comprising Spain and Italy, but since the economic situation of these two countries differs markedly from the previous group, the two were not merged.
Cluster II includes countries where stock market capitalisation is relatively high, but the other two indicators fall short of Clusters III and IV. In Cluster II countries, there is a sizeable stock market, but the activity, captured by the other two indicators, is more muted than in the countries with a similar capitalisation-to-GDP ratio. Cluster I contains the most countries, ten in all, which have the least mature stock markets relative to the other three groups, and this is where Hungary belongs as well.
Besides the Eastern European HFCS countries, the Baltic states, two Mediterranean countries (Greece and Cyprus) and a sole Western European country, Austria, which lags far behind Cluster III countries in all the indicators, were also included here.
Since this study aims to provide relevant results from a Hungarian perspective, the micro-analysis of risky asset holding focuses on Cluster I, which contains Hungary.
Figure 6
Dendrogram of the clustering
Euclidean distance at the time of merging
200
150
100
50
0 EE SI CY LV Grouping
level
SK PL PT GR AT HU IE MT BE LU FI DE NL FR ES IT
4. Modelling risky financial asset holding
The descriptive analysis presented in Section 2 showed how households’ stockholding develops from a given aspect, however, this method cannot handle the effect of interactions. It is easy to see that for example demographic situation and income are closely correlated, and therefore their effect should be examined simultaneously if the aim is to show whether the isolated effects of the different factors are significant from the perspective of stockholding and mutual fund holding, in other words risky financial assets. Therefore, this section uses the model-based approach and attempts to estimate how the factors analysed in the descriptive section affect households’ risky asset holding as defined above, with respect to the partial effects.
4.1. Model specification
In order to identify the factors influencing households’ risky asset holding, logistic regression is used, a major prerequisite of which is the exact establishment of the questions to be answered during the analysis. First, if households’ stockholding is sought to be analysed, besides indirect holdings, direct ones should be taken into account as well. A major portion of households’ equity wealth comprises indirect holdings (through investment funds, pension funds and insurers), however, direct equity investment through the financial architecture is also low in Hungary. Indirect stockholding is partly a result of the institutional system set up through economic policy measures, but it cannot be clearly isolated from the factors influencing direct stockholding.According to the experience of Western European countries, pension funds play a major role in popularising stockholding: in the countries where pension funds’ total asset holdings are large, households are more likely to own equities.
However, the direction of the relationship is not straightforward, and on account of endogeneity, indirect and direct stockholding should be examined together and simultaneously, perhaps even merging all risky assets. However, the available database does not contain information on all risky assets, so only stockholding and investments in investment funds can be examined.17 The model’s binary dependent variable takes the value 1 if households have any risky assets, so they hold equities or mutual funds.
Second, overcoming the entry barrier is key in risky asset holding: the primary issue to be examined is whether households hold risky assets at all. In portfolio allocation decisions, households’ features may be important, but they play a bigger role in whether households hold any equities at all rather than in the size of the risky portfolio when risky assets are held. For example, Haliassos (2005) pointed out that household characteristics (demographics and other features) strongly influence
17 According to the data from the questionnaire-based survey used here, one-third of those holding mutual funds invest in equity funds, while the share of those investing in risk-free money market funds is negligible.
whether households hold risky assets. However, a less close relationship was found between the proportion of risky assets and household characteristics (a similar result was reported by Guiso et al. 2003). Therefore, it is worth examining how and to what extent certain household characteristics influence, hinder or stimulate, entry into this market.
Third, risky asset holding is influenced not only by the demand side but also by the features of the capital market that cannot be measured accurately. In contrast to the results of the studies presented above, Christelis et al. (2010) showed that the differences in risky asset holding often do not arise from household characteristics.
Instead, the differences in the economic environment explain risky asset holding and the amount invested in such assets. Therefore, the analysis involved the two country groups created during clustering and already used in the descriptive section, the group of countries with a mature and large capital market based on the indicators, and those with a less mature capital market (lower stock market capitalisation and activity), with Hungary belonging to the latter. Although the study primarily aims to examine Hungarian households’ portfolio allocation decisions, including countries with similar stock market characteristics was considered necessary to ensure the appropriate sample size. During the analysis, the model analysing risky asset holding was run for both country groups so that the significance of each factor and the extent of their impact can be compared on two markets that offer different risky assets.
In modelling risky asset holding, the effect of households’ demographic, income and wealth position as well as the impact of background risks were explored.
The modelling sought to establish whether a negative effect of background risks on stockholding can be identified, and whether there was any major difference between the extent of the effects in the two country groups. With the help of the literature, three background risks were identified, as in the paper by Zhan (2015):
income risk, housing risk and entrepreneurial risk. Since these variables cannot be measured accurately, they were quantified using the information available in the database as described below.
• Income risk: high exposure to the labour market and the typical information asymmetry represent an uncertain factor in household income. This is especially true if the household does not gain income from any other source, for example from pension, letting property, or financial investments. Therefore, only those households which earn income solely as employees are considered to be exposed to this risk.
In this respect, this study deviates from the approach employed by Zhan (2015), who used empirical evidence and considered the households working in sectors characterised by high unemployment as exposed to this background risk.18
18 We believe that based only on the sector of employment it is hard to say how much households are exposed to unemployment risk, and Zhan (2015) also failed to produce significant results in this respect.
• Housing risk: as seen in the theoretical summary, property ownership may severely constrain disposable liquid income, and the risk arising from being more exposed to the property market may curb the risk faced on other markets, for example financial markets. Housing risk rises as the share of properties within total wealth increases. Therefore, this ratio was represented as a percentage in the model.
• Entrepreneurial risk: according to a study by Heaton and Lucas (2000), households where entrepreneurial income plays a bigger role within total income are less likely to invest in risky financial assets. To quantify this background risk, the method used by Zhan (2015) was employed: entrepreneurial income was taken as a ratio of total income.
In addition, the effect of households’ demographic, income and wealth position and other characteristics on risky asset holding is also analysed. Among the demographic characteristics, the effect of the size of the household, marital status and the age of the head of household (reference person) was evaluated. Female heads of household are a separate variable, because the data and relevant literature confirm that they are less risk-seeking in terms of financial investments. Nevertheless, higher education and financial education were taken into account, since more educated people are more likely to hold risky assets, and the information transaction costs of those working in the financial sector are lower in the case of money market products. Households’ self-assessed investment attitude, i.e. the extent to which they see themselves as risk-seeking investors, was a separate variable. In addition, the effect of whether households experienced liquidity constraints was also examined. They were considered liquidity-constrained if their available liquid assets did not exceed two months’ gross income.
4.2. Results of the model
Based on the results of the logistic regression, several factors influence households’
risky asset holding, but there are differences across the country groups with different levels of activity on the stock market (Table 3). Based on the analysis, the main difference between the two groups under review is that in the countries with a deeper capital market (II), the effect of demographic factors is significant in several cases, while in the other group (I) the wealth position and education are the major factors. This is consistent with the observation that in the countries with a less active capital market and, with a few exceptions,19 a less advanced economy, risky asset holding is almost exclusively typical of wealthier households.
19 For example, Austria is clearly part of Western Europe as regards is economic development, but based on the extent of its stock market, it belongs to the less active group. This outlier feature can be seen in Figure 1, which shows that based on per capita GDP, Austrian households should hold more risky assets.
Income and the wealth position are major and significant factors in both country groups, but wealth increases risky asset holding more in the countries with a deeper capital market. A 10 per cent rise in households’ income lifts the probability of risky asset holding by 0.31 per cent on average, while in the second group this figure is roughly 0.8 per cent. Wealth exerts a greater impact, and it raises the probability of risky asset holding substantially more in the countries with a deeper capital market, which confirms the widespread nature of these assets. The regression includes the dummy variables of the wealth quintiles for the countries, and the median, i.e. the third, quintile serves as the reference group.
In both country groups, households hold more risky assets in the higher quintiles, although there are also differences:
• In the group that includes Hungary, belonging to the first and second wealth quintile reduces the probability of holding by 6 and 3 per cent, respectively, but the marginal effect of the fourth quintile does not differ significantly from the third. Moreover, belonging to the top wealth group boosts the likelihood of risky asset holding by 5 per cent on average.
• In the other country group, the probability also increases with the wealth quintiles, but overall the marginal effect is greater, in absolute terms, in all quintiles. Belonging to the first quintile means a 12.4 per cent lower probability of holding, the same figure is –6 per cent in the second quintile, while it is 6.3 and 15.5 per cent in the fourth and fifth quintiles, respectively (relative to the third).
Table 3
Results of logistic regression
Average marginal effects (AMEs)
Less active capital market (I) More active capital market (II) Total household income (log) 0.031***
(0.109) 0.078***
(0.146) Gross wealth (third quintile)
First quintile −0.056**
(0.062) −0.124***
(0.044)
Second quintile −0.029***
(0.120) −0.06***
(0.091)
Fourth quintile 0.003
(0.173) 0.063***
(0.207)
Fifth quintile 0.049***
(0.284) 0.155***
(0.367)
Graduate 0.049***
(0.208) 0.056***
(0.128) Working in the financial sector 0.055***
(0.506) 0.096***
(0.403) Risk-taking in investments
(do not take risks)
Average 0.08***
(0.880) 0.137***
(1.250)
Above–average 0.134***
(0.881) 0.238***
(1.030)
Exceptional 0.088**
(0.301) 0.156*
(0.220)
Number of children −0.006
(0.065) −0.017**
(0.037)
Female head of household −0.018**
(0.072) −0.033***
(0.060)
Liquidity constraint −0.021***
(0.069) −0.058***
(0.053)
Age 0.000
(0.004) 0.000
(0.003)
Labour market exposure −0.023*
(0.128) −0.123***
(0.090)
Entrepreneurial income −0.0005***
(0.001) −0.0013***
(0.002) Ownership of residential
property −0.031**
(0.093) −0.047**
(0.092)
Sample size 23,430 21,200
Note: The reference group is the third quintile in the case of the wealth quintiles and “do not take risks”
in the case of risk-taking attitude. The figures in brackets under the average marginal effects denote the robust standard errors. *p<0.05; **p<0.01; ***p<0.001
Two conclusions can be drawn from the above. First, in the countries with a deeper capital market the rise in the share of the holders by quintiles is more gradual, which – together with the relevant descriptive statistics – suggests that in the case of the households with relatively lower wealth, holding equities and mutual funds is more typical than in the other country group. Second, in the countries with a smaller capital market, the top wealth quintile is strikingly distant from the others.
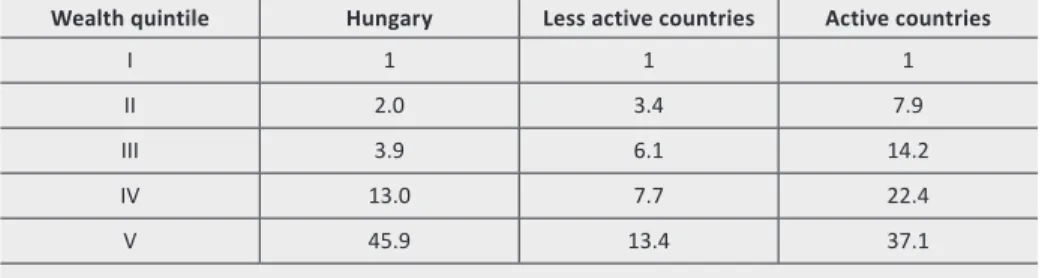
Table 4 shows that in the higher wealth quintiles, the proportion of risky asset holders steadily grows. While in the countries with a deeper capital market this ratio increases gradually, a bigger jump can be seen at the fifth quintile in the other country group. This is especially true in Hungary: while the proportion of holders in the fourth quintile is 13 times that of the first, it is almost 46 times that in the fifth.
And the lack of gradual increases is also evident since there is no major difference between the second and third quintiles in Hungary, and between the third and fourth quintiles in the other countries with a less active capital market, whereas the more active group exhibits such differences. This is consistent with the fact that in the case of the first country group, the effect of the fourth quintile relative to the median is not significant in the regression. This allows us to conclude that in these countries, risky asset holding is more concentrated and is mainly typical of the wealthiest households.
Table 4
Multiple of the proportion of risky asset holders in the wealth quintiles relative to the first wealth quintile
Wealth quintile Hungary Less active countries Active countries
I 1 1 1
II 2.0 3.4 7.9
III 3.9 6.1 14.2
IV 13.0 7.7 22.4
V 45.9 13.4 37.1
Besides wealth and income, another important factor is the existence of liquidity constraints. The model examined the effect of households’ liquid assets, here meaning assets on a bank account, in a demand deposit or fixed-term deposit, which amount to less than two months’ gross income. According to the regression, this situation reduces the probability of risky asset holding by almost 6 per cent in the countries with a more mature stock market, and by 2.1 per cent in the other country group. This suggests that those who cannot save in liquid form, on account of precautionary motives, are less likely to consider equities and investment funds as possible forms of saving.
Education and employment in the financial sector have a highly positive and significant effect on the probability of risky asset holding. Based on the logistic regression, higher education, which, according to empirical evidence and the theories, reduces the transaction costs of obtaining information necessary for financial investments, boosts the likelihood of risky asset holding by 5.6 and 4.9 per cent in the countries with an active capital market and those with a less active one, respectively. Employment in the financial sector, which also facilitates access to the relevant information, raises households’ risky asset holding by a similar extent (by 9.6 and 5.5 per cent).
Among demographic characteristics, the number of children and the gender of the head of household influence risky asset holding the most. Child-rearing ties down a huge amount of financial assets in a household, which presumably reduces the probability of holding equities and mutual funds. This negative effect can be seen in both country groups under review (0.6 per cent and 1.7 per cent drop), but it is not significant in the countries with a less active capital market. By contrast, female heads of household exert a significantly negative impact on the probability of risky asset holding in both groups: the probability of holding falls by 1.8 and 3.3 per cent in the first and second country group, respectively. In addition, the effect of marital status and age was also examined, but no significant correlation was established. While in the countries with a less mature stock market age also did not play a considerable role in descriptive statistics, in the other country group it seemed that risky asset holding increases with age, but this was not confirmed by the model analysing partial effects. All in all, demographic characteristics play a lesser role in the countries with a less active capital market, and based on the model only the gender of the head of household influences holding. This tallies with the earlier finding that in these countries wealth position and education are the dominant factors in risky asset holding.
The model confirms the hypothesis that background risks are partly responsible for households’ risky asset holding falling short of the theoretical optimum. All three background risk indicators under review significantly reduce the probability of holding equities and mutual funds in both country groups, and the only major difference in their impact can be observed in labour market exposure. If a household is completely dependent on earned income, it reduces the probability of risky asset holding by an average of 2.3 and 12.3 per cent in the first and second country group, respectively. This huge difference is probably because risky assets are more widespread in Group II: in the countries with a less active capital market, even those who otherwise have income from other sources do not hold substantially more equities, so the difference is not that marked. By contrast, in the countries with a deeper capital market, which are also more advanced economically, there are probably fewer people who live solely from earned income and mostly belong to the lower income quintiles. The background risk arising from owning residential
households are significantly less likely to hold risky assets (the effect is –3.1 and –4.7 per cent in Group I and II, respectively). Entrepreneurial income, which, according to empirical evidence, is more volatile than other types of income, also has a negative impact on stockholding. If the ratio of entrepreneurial income rises by 1 percentage point within total household income, the probability of risky asset holding drops by 0.05 per cent in the group containing Hungary and by 0.13 per cent in the other one. Nonetheless, it should be noted that the model showed a relatively low marginal effect for all background risk indicators, which is probably attributable to the heterogeneous nature of the group under review, for example those living exclusively from compensation of employees (especially in the countries with lower capital market activity).
Even after controlling for households’ wealth, income and demographic characteristics, the investment attitude of the head of household plays a significant role. Households that consider themselves risk-averse served as the reference group, and respondents could choose from three further options: average, above- average and exceptionally risk-taking. While the extent of the effects in the two country groups under review varies, a similar pattern can be observed: in the first group, the probability of risky asset holding increases by 8 per cent for average risk- takers, and by 13.4 per cent for above-average risk-takers. Interestingly, however, in both groups, belonging to the top category raises the likelihood of stockholding by less than being above-average. This contradiction may be because only a smaller share of households hold equities due to their exceptional riskiness (and the corresponding exceptional expected returns). From this perspective, venture capital investments, for example targeting start-ups, offer a better investment alternative.
5. Conclusions
This study examines households’ risky financial asset holding and the factors determining it. Within households’ wealth, the proportion of riskier assets correlates strongly with economic development. At the same time, several papers have pointed out that even in advanced countries, the share of stockholding households is low, since households do not diversify their portfolios in line with the theory. The analysis of the topic was facilitated by a questionnaire-based survey on wealth, containing households’ unique characteristics, and also involving Hungarian households (Household Finance and Consumption Survey, HFCS).
The paper sought to establish the factors that influence whether households hold risky financial assets (equities or mutual funds). In addition to analysing demand factors, differentiation was performed by capital market depth, separating the countries with an active capital market from those with a less active one. The logistic regression supplementing the descriptive analysis presented in the first half of the study allowed us to determine the partial effect of a given factor on stockholding.
The main messages of the analysis are as follows:
• A strong correlation can be identified between households’ listed stock holding and the equity financing of corporations. In the countries with higher per capita GDP, the corporate sector may have equity funds in excess of total GDP, while in Hungary the corresponding figure is just 20 per cent of GDP.
• Risky asset holding depends strongly on the wealth and income of households. The countries involved in the analysis were classified into several groups based on the role played by the stock market in financing. In the country group with an active stock market, even the households with lower wealth (income) hold significant amounts of risky assets, while in the other group also including Hungary, this is much less typical (which is presumably related to lower average income).
• In the mainly Western European countries with a more active capital market, far more households hold equities directly than indirectly, while in the countries with a less mature capital market, indirect stockholding is more widespread.
• The existence of liquidity constraints is also an important factor: those who cannot save in liquid form, on account of precautionary motives, are less likely to consider equities and mutual funds as possible forms of saving. By contrast, the results suggest that lending does not influence risky asset holding.
• Education and employment in certain sectors of the economy (for example in finance) also have a highly positive effect on the probability of risky asset holding.
Since the results of the model give us partial effects, this finding is independent from income, and thus measures aimed at improving financial literacy are expected to also positively influence households’ risky financial asset holding.
• Demographic characteristics (number of children, marital status, age) play a lesser role in risky asset holding, and this is especially true of the countries with a less active capital market. This tallies with the finding that in these countries wealth position and income are the dominant factors.
• Large labour market and property market exposure and a higher proportion of entrepreneurial income, which is considered more volatile than wages, have a negative effect on risky financial asset holding. According to the literature, these risks are difficult or impossible to quantify, but individuals need to take them into account during their investment decisions, and therefore overall they can reduce the share of households’ risky financial assets.
• Besides the above, households’ risky asset holding may also be strongly influenced by self-assessed investment attitude, how much households consider themselves risk-taking. Risk-averse households are significantly less likely to hold risky assets in both the countries with an active capital market and those with a less active one.
References
Agnew, J. – Balduzzi, P. – Sunden, A. (2003): Portfolio choice and trading in a large 401 (k) plan. The American Economic Review, 93(1): 193–215. https://doi.org/10.1257/
000282803321455223
Alessie, R. – Hochguertel, S.– Soest, A. (2004): Ownership of stocks and mutual funds: a panel data analysis. The Review of Economics and Statistics, 86(3): 783–796. https://doi.org/
10.1162/0034653041811761
Barber, B. – Odean, T. (2001): Boys will be boys: Gender, overconfidence, and common stock investment. Quarterly Journal of Economics, 116(1): 261–292. https://doi.org/10.1162/
003355301556400
Barberis, N. – Huang, M. (2001): Mental accounting, loss aversion, and individual stock returns. The Journal of Finance, 56(4): 1247–1292. https://doi.org/10.1111/0022-1082.
00367
Bawa, V. – Lindenberg, E. (1977): Capital market equilibrium in a mean-lower partial moment framework. Journal of Financial Economics, 5(2): 189–200. https://doi.org/10.1016/0304- 405X(77)90017-4
Benatzi, S. – Thaler, R. (1995): Myopic loss aversion and the equity premium puzzle. The Quarterly Journal of Economics, 110(1): 73–92. https://doi.org/10.2307/2118511 Bertaut, C. (1998): Stockholding behavior of US households: Evidence from the 1983-1989
survey of consumer finances. Review of Economics and Statistics, 80(2): 263–275. https://
doi.org/10.1162/003465398557500
Bertaut, C. – Starr-McCluer, M. (2002): Household portfolios in the United States. In: Guiso, L. – Haliassos, M. – Jappelli, T. (Eds.), Household Portfolios, pp. 181–217. Cambridge, MA:
The MIT Press.
Bodie, Z. – Merton, R. – Samuelson, W. (1992): Labor supply flexibility and portfolio choice in a life cycle model. Journal of Economic Dynamics and Control, 16(3–4): 427–449. https://
doi.org/10.1016/0165-1889(92)90044-F
Boldizsár, A.– Kékesi, Zs. – Kóczián, B. – Sisak, B. (2016): The Wealth Position of Hungarian Households based on HFCS. Financial and Economic Review, 15(4): 115–150. http://english.
hitelintezetiszemle.hu/letoltes/anna-boldizsar-zsuzsa-kekesi-balazs-koczian-balazs-sisak.
Carroll, C.D. (2001): Portfolios of the Rich. In: Guiso, L. – Haliassos, M. – Jappelli, T. (Eds.):
Household Portfolios, Cambridge, MA: MIT Press.
Christelis, D. – Georgarakos, D. – Haliassos, M. (2010): Differences in portfolios across countries: Economic environment versus household characteristics. CEPR Discussion Papers (8017).
Cocco, J. (2004): Portfolio Choice in the Presence of Housing. IFA Working Paper 410, London Business School.
Cocco, J. – Gomes, F. – Maenhout, P. (2005): Consumption and portfolio choice over the life cycle. Review of Financial Studies, 18(2): 491–533. https://doi.org/10.1093/rfs/hhi017 Dong, H. – Jiang, J. (2016): Risky Asset Holding and Labour Income Risk: Evidence from Italian
Households. Lund University School of Economics and Management, May 25th.
ECB (2018): Is the top tail of the wealth distribution the missing link between the Household Finance and Consumption Survey and national accounts? Working Paper Series, European Central Bank. https://www.ecb.europa.eu/pub/pdf/scpwps/ecb.wp2187.en.pdf.
Downloaded: 7 November 2018
ECB (2016a): The Household Finance and Consumption Survey: results from the second wave. Statistics Paper Series, European Central Bank. https://www.ecb.europa.eu/pub/
pdf/scpsps/ecbsp18.en.pdf. Downloaded: 1 June 2018
ECB (2016b): The Household Finance and Consumption Survey: methodological report for the second wave. Statistics Paper Series, European Central Bank. https://www.ecb.europa.
eu/pub/pdf/scpsps/ecbsp17.en.pdf. Downloaded: 1 June 2018
Fratantoni, M.C. (1998): Homeownership and Investment in Risky Assets. Journal of Urban Economics, 44(1): 27–42. https://doi.org/10.1006/juec.1997.2058
Gollier, C. (2001): The Economics of Risk and Time. Cambridge, MA: MIT Press. https://doi.
org/10.7551/mitpress/2622.001.0001
Guiso, L. – Haliassos, M. – Jappelli, T. (2001): Household Portfolios. Cambridge, MA: MIT Press.
Guiso, L. – Haliassos, M. – Jappelli, T. (2003): Stockholding in Europe: Where Do We Stand and Where Do We Go? Economic Policy, 18(36): 117–164.
Guiso, L. – Paiella, M. (2008): Risk aversion, wealth, and background risk. Journal of the European Economic Association, 6(6): 1109–1150. https://doi.org/10.1162/JEEA.2008.
6.6.1109
Haliassos, M. (2005): Household Demographics and the Composition of Savings. In: Heise, M. – Wieland, V. (eds.), Capital Markets in the Long Term: Demography, Economic Development, and Funded Pension Systems, Frankfurt: CFS and Allianz, pp. 83–106.