Grating‑coupled interferometry reveals binding kinetics
and affinities of Ni ions
to genetically engineered protein layers
Hajnalka Jankovics1,3, Boglarka Kovacs2,3, Andras Saftics2, Tamas Gerecsei2, Éva Tóth1, Inna Szekacs2, Ferenc Vonderviszt1,2 & Robert Horvath2*
Reliable measurement of the binding kinetics of low molecular weight analytes to their targets is still a challenging task. Often, the introduction of labels is simply impossible in such measurements, and the application of label‑free methods is the only reliable choice. By measuring the binding kinetics of Ni(II) ions to genetically modified flagellin layers, we demonstrate that: (1) Grating‑Coupled Interferometry (GCI) is well suited to resolve the binding of ions, even at very low protein immobilization levels; (2) it supplies high quality kinetic data from which the number and strength of available binding sites can be determined, and (3) the rate constants of the binding events can also be obtained with high accuracy.
Experiments were performed using a flagellin variant incorporating the C‑terminal domain of the nickel‑responsive transcription factor NikR. GCI results were compared to affinity data from titration calorimetry. We found that besides the low‑affinity binding sites characterized by a micromolar dissociation constant (Kd), tetrameric FliC‑NikRC molecules possess high‑affinity binding sites with Kd
values in the nanomolar range. GCI enabled us to obtain real‑time kinetic data for the specific binding of an analyte with molar mass as low as 59 Da, even at signals lower than 1 pg/mm2.
In the last few decades, label-free optical biosensors have proven their unique capabilities in a wide range of appli- cations from biomolecular interaction analysis (BIA)1–4 to whole-cell monitoring5–9. Screening the interactions of various analyte-ligand pairs has become essential in drug discovery10–13, assay and sensor development14,15 as well as for understanding molecular mechanisms in biochemistry and biophysics16–19. Often, the introduction of labels is simply impossible in such measurements, and the application of label-free methods is the only reliable choice. Unique advantages of label-free techniques are that they provide real-time kinetic information about molecular binding events and make the kinetic analysis possible even for low molar mass analytes. In this regard, the label-free principle has a crucial role in minimizing the interference in the measured tiny interactions. Using labels would strongly interfere with the binding and thus would not be able to provide reliable quantities on the system. Although the analysis of small molecules with 200–1000 Da molar mass is well established20–22, detec- tion of analytes, especially characterizing their binding kinetics, with molar mass below 100 Da is still a great challenge. Importantly, most metal ions with significant biochemical role (e.g., Ca, Mg, Fe, Cu, Zn) or relevance in environmental samples (e.g., Ni, Cd, Hg, Pb) fall into this mass range. While the widely used surface plasmon resonance (SPR) biosensor has been already used for metal ion detection23–27, examples for studies measuring below 100 Da are especially rare and the binding kinetics has not been measured or analyzed in detail.
Recently, novel optical techniques have been developed to achieve sensitivity capable of recording binding kinetics for < 100 Da analytes. In this challenge, interferometry-based detection methods have proven to be par- ticularly promising candidates also showing great potential for applications in point-of-care and integrated lab- on-a-chip devices28–30. Most interferometric techniques employ optical waveguides, above which the adsorption of molecules induces refractive index changes in a surface bound evanescent wave. Silicon technology is used to
OPEN
1Bio-Nanosystems Laboratory, Research Institute of Biomolecular and Chemical Engineering, University of Pannonia, Egyetem u. 10, Veszprém, Hungary. 2Nanobiosensorics Laboratory, Institute of Technical Physics and Materials Science, Centre for Energy Research, Konkoly-Thege Miklós út 29-33, Budapest, Hungary. 3These authors contributed equally: Hajnalka Jankovics and Boglarka Kovacs.*email: r74horvath@gmail.com
fabricate the sensor chips and usually one or multiple Y-shaped waveguides are integrated. The most commonly used measurement geometry is the Mach–Zehnder or Young interferometer configurations31,32. However, these setups suffer from disadvantages like alignment difficulties and high costs of components. The integration of the Young interferometers to parallel readout design is rather complicated. In the case of Mach–Zehnder interfer- ometers the chip fabrication is high-priced and the alignment of the single mode channel with coupling fibers is difficult. Using dual polarization interferometry (DPI), it has been shown that highly sensitive interferometry- based biosensors might be capable of detecting the amount of ions binding to surface immobilized proteins33,34. Differential refractometer and DPI is sensitive to vibrations and not suitable for parallel readout35. The sensitivity of Young interferometers is 10−7 RIU (refractive index unit) in bulk solution and 1000 particles/mL for viruses.
Mach–Zehnder interferometers have a sensitivity of 10−7 RIU in bulk solution and 20 pg/mm2 for proteins36. The recently developed grating-coupled interferometry (GCI) is a hybrid phase-shifting Mach–Zehnder interferometer, which can present several advantages over other optical biosensor techniques. It employs a simple waveguide-grating structure, moving parts are completely eliminated decreasing noise levels, the incorporated coupling gratings possess high alignment tolerance, and the applied Ta2O5 waveguide has high refractive index contrast with a relatively long interaction path with the sample. Moreover, unlike most interferometric setups employing spatial interference patterns, the interference appears in the time-domain for GCI. All of these fea- tures lead to outstanding optical stability, detection sensitivity and overall performances35,37,38, making GCI one of the most sensitive label-free biosensor currently available on the market. The GCI technology is capable of providing reliable kinetics even below signals of 1 pg/mm2 and it can be applied to determine the kinetic rate parameters of binding events with high sensitivity. This performance makes the technology suitable for charac- terizing the dynamic metal binding properties of surface-attached molecules. The structure of a GCI chip and its schematic working principle is shown in Fig. 1. It is important to stress that GCI with integrated precision fluid handling and temperature control is a well-established technique already applied in a number of fields, such as plant biology18,19,39–44, drug discovery45, natural products research17 cancer research46 as well as, most recently, exploring the receptor-binding domain of SARS-CoV247. While GCI has already shown its potential in the bind- ing kinetics measurement of a small polyphenol molecule, the 458 Da epigallocatechin gallate (EGCG)17, too, there are no examples in the scientific literature of exploiting its top-level sensitivity below molar mass of 60 Da.
For demonstrating the performance of the GCI technology to study the binding kinetics of ions, we selected a newly developed genetically modified flagellin variant with Ni-binding ability, which can be potentially applied in further bio- and chemical sensor applications.
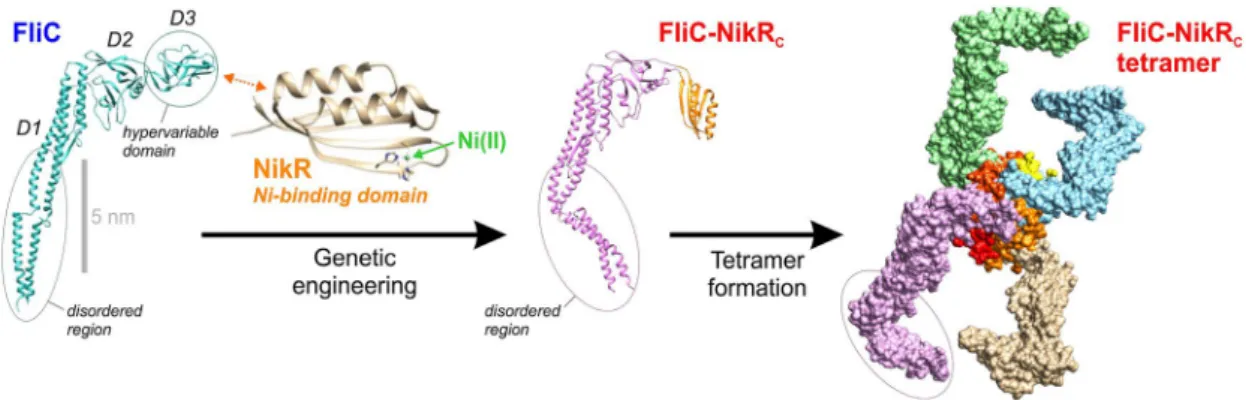
The bacterial flagellar filaments consist of thousands of flagellin subunits. Flagellin is composed of 4 domains:
D0, D1, D2, and D3. The terminal D0 and partly D1 domains are disordered in the monomeric form48. These disordered regions are expected to easily adapt to the local environment. The hypervariable D3 domain is a largely independent part of flagellin, thus it can be removed or replaced by other proteins without disturbing the other domains of the molecule49,50. We have recently shown that flagellin or flagellin-based fusion proteins rapidly form an oriented, dense and stable monolayer on hydrophobic surfaces, where the hypervariable D3 domain is oriented towards the liquid phase51,52.
NikR is a metal-responsive transcription factor that controls Ni(II) uptake in E. coli by negatively regulat- ing expression of a Ni-specific ABC transporter complex encoded by the nikABCDE operon. In the presence of excess intracellular Ni(II), the conformational change of the C-terminal Ni(II)-binding domain of the Ni- dependent repressor protein NikR (residues 49–133) enables the N-terminal domain (residues 1–48) to release Figure 1. Structure of the applied 4-channel WAVEchip. (A) Full image of a PCP-LIP WAVEchip with its fluidic channels enlarged in (B) Two channels, a measurement and reference channel (Ch1 and Ch2) are further detailed. The interference signal (phase-shift) is produced by the combination of the measuring beam and phase modulated reference beam inside the Ta2O5 waveguide film. The two beams are coupled through two optical gratings and the combined beam is coupled out by a 3rd grating. All the gratings and the path of combined beam are covered by a thin SiO2 layer (light blue) in order to avoid sensing of any refractive index change outside the indicated sensing area. The evanescent field generated by the electromagnetic mode propagating in the waveguide film (dark blue) is also indicated. Both channels have the same structure and are coated with an identical PCP-LIP coating. FliC-NikRC protein was immobilized on Ch1 and FliC on Ch2, respectively, and the same Ni(II) solution was simultaneously injected into the flow cell of both channels (C,D).
the operator sequence of nikABCDE, and thus expression of the regulator proteins can begin18. Based on its structure, two of the C-terminal regulatory domains of E. coli NikR form a core dimer, which binds one Ni(II) per monomer with very high affinity53. Coordinating ligands come from both protein chains of a core dimer (H87, H89 and C95 from one, H76 from the other NikR subunit; Carrington et al.54), forming a square planar Ni(II) coordination sphere. Besides the high-affinity (HA) site, Ni(II) may bind to several other low-affinity (LA) binding sites per monomer55. For the HA site, dissociation constants (Kd) in the picomolar/nanomolar range have been reported56,57, while the LA sites exhibit binding affinity in the micromolar range. The NikR C domain (NikRC) was demonstrated to form stable tetramers in solution by assembly of two core dimers. Ni-binding is not required for tetramerization56.
In this work, we have prepared a newly constructed FliC-NikRC flagellin variant with inserting the C-terminal Ni-binding domain of NikR into the variable middle domain of FliC. With the development of this fusion pro- tein, our aim was to produce a HA Ni-binding receptor for demonstrating the performance of the novel GCI technology. This interferometry-based biosensor method allowed for obtaining high-resolution kinetic data on the binding of the 59 Da Ni(II) analyte, whose kinetic detection is highly challenging even for today’s top biosensor technologies. The fully resolved kinetic data enabled us to determine the rate parameters and dissocia- tion constants of the binding events even at very low immobilization levels. Besides the biosensor experiments, complementary isothermal titration calorimetry (ITC) measurements were also performed. Calorimetry is a widely used reference technique of label-free measurements (mainly shown for SPR in previous works58–61).
Materials and methods
Plasmid construction for NikR C‑domain displaying flagellin variant. As a vector DNA, a modified pET19b (Novagen, Madison, Wisconsin, US) based plasmid was used which contains the gene of the D3-domain deficient flagellin protein between the NcoI and BamHI sites, excluding the N-terminal 10His coding sequence.
In this plasmid the coding sequence of the D3 domain was substituted with a multiple cloning site (MCS) includ- ing four sequential restriction cleavage sites (XhoI, AgeI, XmaI and SacI) permitting the optimal incorporation of a peptide or protein coding sequence. Salmonella codon optimized gene of the C-terminal domain of E. coli NikR repressor protein (PDB ID: 3BKU) was synthesized and provided in between the EcoRV sites of a pUC57 vector by GenScript (Piscataway, New Jersey, US). Using the primers (forward) 5′-ACA TAC CGG TAC CCA GGG CTT TGC GGTGC-3′ and (reverse) 5′-ACA TGA GCT CAT CTT CTT TCG GCA GGC ACT GC-3′ nikR was ampli- fied by PCR and placed into the modified pET19b plasmid using the AgeI and SacI sites (fliC-nikR(C)). As a result, the gene of a flagellin variant with the C-domain of NikR in it linked by the N-terminal ‘LETG’ and C-terminal ‘EL’ peptides was obtained. After the appropriate construction was confirmed by DNA sequencing, BL21 (DE3) cells were transformed by the pET19b plasmid containing fliC-nikR(C).
Protein expression and purification. 20 mL LB media (Scharlau, Barcelona, Spain) with 100 µg/L ampi- cillin (PanReac AppliChem, Darmstadt, Germany) (LB/Amp) was inoculated from freshly prepared LB/Amp agar plate of BL21 (DE3) bacteria containing the FliC-NikRC/pET19b vector, grown at 37 °C with 270 rpm shaking until optical density at 600 nm (OD600) was between 0.6 and 1.0 and kept at 4 °C. Next morning 5 mL of the starter media was added to 1 L LB/Amp in a 3 L volume baffled flask and grown at 37 °C with moderate shaking (100 rpm). When OD600 was between 0.4 and 0.6, culture was induced with 0.5 mM isopropyl β-D-1- thiogalactopyranoside (IPTG, Sigma-Aldrich, St. Louis, Missouri, US), and further incubated at 30 °C for 4 h.
After that, cells were harvested by centrifugation (4300×g, 30 min, 10 °C on a Heraeus Multifuge 3 S-R, Her- aeus, Hanau, Germany), washed with 20 mM Na2HPO4, 150 mM NaCl, pH 7.8 buffer, centrifuged and stored at - 80 °C. Applying the above process, typically 4–5 mL cell pellet was given from 1 L LB media. During the whole purification process cells were kept on ice. The cell pellet from 1 L growing was resuspended in 20 mL 20 mM Na2HPO4, 150 mM NaCl, pH 7.8 buffer with 2 Complete Mini EDTA-free protease inhibitor tablets (Hoffmann-La Roche, Basel, Switzerland) and lysed by sonication using 50% intensity, 5 times 1 min, cooling in between on an Omni Sonic Ruptor 400 instrument (Omni Instruments Ltd., Dundee, UK). The lysate was cen- trifuged with 82,000×g for 25 min on an Optima Max-E Ultracentrifuge (Beckman Coulter, Brea, CA) and the supernatant was filtered by a 0.22 µm sterile syringe filter. Imidazole in 10 mM concentration was added to the solution prior to Ni(II)-affinity chromatography to prevent non-specific binding to the column. The FliC-NikRC
containing solution was loaded onto a 5 mL HiTrap Chelating (GE Healthcare, Chicago, Illionis, US) column, previously equilibrated by buffer A (100 mM K-phosphate, 500 mM NaCl, 10 mM imidazole, pH 8.0). After washing the column with buffer A, the bound protein was eluted by buffer B (100 mM potassium phosphate, 10 mM Tris, 250 mM imidazole, pH 7.6) into EDTA solution (pH 8.0, final concentration is 10 mM) to avoid dimer or tetramer formation or aggregation derived by metal ion coordination.
Isothermal titration calorimetry. ITC measurements were performed to characterize the Ni-bind- ing properties of the FliC-NikRC fusion protein, using a VP-ITC instrument (MicroCal, Northampton, MA, USA). For calorimetric measurements buffer in FliC-NikRC protein solution was first exchanged by 20 mM 4-(2-hydroxyethyl)-1-piperazineethanesulfonic acid (HEPES), 150 mM NaCl, pH 7.0 using a 5 mL HiTrap Desalting (GE Healthcare) column, and the collected fraction was further dialyzed overnight against the same buffer. An approximately 30 mM stock solution of NiSO4 was prepared by dissolving the solid salt in the over- night dialysis buffer of the protein, equilibrated at room temperature for an hour to ensure identical buffering conditions for the measurements. The sample cell was loaded with a 90 µM protein solution and it was titrated by a 1.8 mM NiSO4 solution. ITC experiments were performed at 25 °C with 7 µL injection volumes and 240 s equilibration times between injections. As a control experiment, the NiSO4 was also injected into the buffer, and
the measured heats of dilution were subtracted from the main experiment. Calorimetric data were analyzed using MicroCal Origin software fitting them by a sequential binding sites model, assuming 3 binding sites.
Grating‑coupled interferometry. The binding kinetics of Ni(II) on FliC-NikRC was measured by the label-free, high sensitivity GCI WAVE instrument (Creoptix AG, Wädenswil, Switzerland)35,38. In the present study, both the two-channel (WAVE) and the next-generation four-channel (WAVEdelta) instruments were used. For simplicity, we hereafter refer to the technique as WAVE in general. The experiments were conducted employing specific optical sensor chips, the so-called WAVEchips (Creoptix AG) (see Fig. 1). In order to analyze the effect of immobilized flagellin amount on Ni detection, two types of WAVEchips with different functional coatings, PCP-LIP and PCH were applied. PCP-LIP refers to a thin, quasi-planar polycarboxylate polymer (PCP) coating on the waveguide where lipophilic (LIP) groups are pre-immobilized to the PCP chains. This type of sen- sor chip can be used for capturing ligands through hydrophobic interactions (according to our previous results, flagellins can be efficiently captured in this way52,62,63). The PCH chip carries a thick polycarboxylate-based hydrogel coating with free carboxylic functions to which proteins can be covalently coupled through EDC/NHS (1-ethyl-3-(3-dimethylaminopropyl)carbodiimide hydrochloride/N-hydroxysuccinimide) linking chemistry.
Owing to their multiple-channel design, WAVEchips allow for referencing the signal recorded on the target channel with a signal measured on a selected reference channel. In our experimental design, we immobilized Ni-responsive FliC-NikRC to the target channel (Ch1), while Ni-insensitive FliC was captured on the reference channel (Ch2). The handling of all the different solutions including sample pickup, delivery and injection onto the channels was performed fully automatically by a robotic autosampler (WAVEsampler).
Throughout the entire experimental period 10 mM HEPES, 150 mM NaCl, pH 7.4 was used as running buffer (RB). The basic element of a GCI experiment is the cycle, which consists of a baseline (RB injection), a sample (e.g., protein solution) injection as well as a washing section (RB injection). A typical GCI experiment can be separated into a sequence of series, where a series is usually composed of more cycles. As a first experimental step, the polycarboxylate layer of the WAVEchip was conditioned using a solution of 0.1 M sodium tetraborate decahydrate (borate; VWR, Hungary), 1 M NaCl, pH 9.0, which was followed by sequential running buffer injec- tions (so-called startup cycles). In the case of PCP-LIP chips, the flagellin molecules were immobilized to the surface by physisorption on the lipophilic anchoring groups. While 1 mg/mL FliC-NikRC solution (dissolved in the RB) was injected into Ch1, 1 mg/mL FliC solution also prepared in RB was injected into Ch2 (the prepara- tion of monomeric FliC solution from filaments was described elsewhere52). The experimental conditions of the covalent immobilization of FliC and FliC-NikRC on PCH chip can be found in the Supplementary Information:
Note 1. After the immobilized protein layer was stabilized with sequential RB flows (stabilizing startup cycles), dilution series of NiSO4 solutions (prepared in RB) covering the concentration region of 1 nM–10 μM were simultaneously injected both into channels Ch1 and Ch2. For double referencing, we applied Ni(II)-free RB injections (blanks) at every 5th Ni(II) cycle.
The control of the device as well as data adjustment and kinetic analysis were all performed using the WAVE- control software (Creoptix AG). The raw kinetic data were adjusted using X,Y-offset and blank correction and the processed data were fitted using the “heterogeneous ligand” kinetic model of the WAVEcontrol software (for the model equations, see Supplementary Information: Note 2).
Results and discussion
Construction, bacterial production and purification of FliC‑NikRC. In order to replace the D3 domain of flagellin with NikRC, it is essential to use appropriate linker segments which allow proper folding of both fusion partners. Selection of N- and C-terminal linker peptides with appropriate length for the incorpora- tion of the C domain of NikR into flagellin was done by computer modelling based on the structure of E. coli NikR C-domain (PDB ID: 3BKU) and S. typhimurium flagellin (PDB ID: 1UCU). Since the N- and C-terminal ends of NikRC are closely separated by only about 6 Å, we concluded that short linkers at both ends of NikRC would be sufficient. Linker peptides with 2, 4 or 6 amino-acid-length are encoded in our pre-fabricated pBR322 based plasmid DNA (NT045) containing the D3-domain deficient flagellin gene64. We chose peptides LETG and EL as linkers at the N- and C-terminus of NikRC, respectively. To generate these linker peptides, the nikRC gene was incorporated into NT045 by using the AgeI and SacI restriction sites.
Flagellin-based fusion proteins may form flagellar filaments on the cell surface making protein purification simple and cost effective. Expression of FliC-NikRC was first attempted in flagellin deficient SJW2536 S. typh- imurium cells, but secretion of the fusion protein was not observed. Therefore, for efficient protein production the fliC-nikRC gene was introduced into a modified pET19b vector, expressed in E. coli BL21 (DE3) strain, and the FliC-NikRC fusion protein was purified by Ni-affinity chromatography. Our optimized protein expression protocol resulted in about 35 mg soluble protein per 1 L LB medium.
E.coli NikR or its C-terminal domain is known to form tetramers in solution. To characterize the oligomeri- zation state of the purified FliC-NikRC sample dynamic light scattering (DLS) measurements were performed.
These experiments revealed that FliC-NikRC forms tetrameric assemblies similarly to NikRC71 (for DLS results, see Fig. S1 in the SI). The modeled structure of FliC-NikRC is shown in Fig. 2.
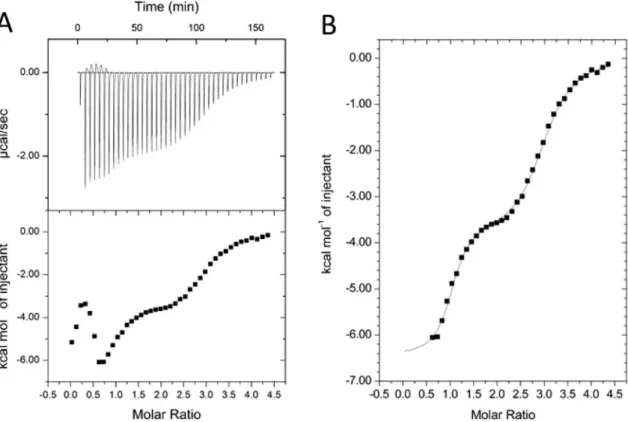
ITC study of Ni‑binding by FliC‑NikRC. Ni-binding properties of the FliC-NikRC construct were char- acterized in solution by ITC. Measurements were done in non-complexing HEPES buffer which is ideal for Ni-binding studies. Previous works suggested that NikRC contains two distinct classes of Ni-binding sites with largely different affinities49. Calorimetric measurements were applied to demonstrate that NikRC preserved its Ni-binding ability upon its internal fusion into flagellin.
The obtained calorimetric profile shows a multistep binding process and a complex behavior at low Ni concen- trations. The ITC data indicate the presence of a tight binding process finished after an equimolar Ni(II) added per FliC-NikRC monomer. This process presumably reflects interaction of Ni ions with the HA sites of NikRC. While the HA site was being filled, a parallel endothermic event followed the fast initial exothermic metal bind- ing step. Spontaneous endothermic processes are driven by the increase of entropy, which may be caused by the release of water molecules from the hydration sphere of the protein, due to either conformational changes and/
or protein oligomerization. The latter possibility was not supported by DLS measurements performed at various Ni(II) concentrations which demonstrated that the oligomeric state of the FliC-NikRC fusion protein was not significantly influenced by the presence of Ni ions (data not shown).
A very similar calorimetric behavior was observed by Zambelli et al.66 upon titration of H. pylori NikRC with Ni(II), who concluded that the endothermic calorimetric component reflects internal conformational rearrange- ments induced by Ni(II) binding to the HA sites. It seems that a similar process occurs in FliC-NikRC, but after addition of half Ni(II) equivalent this process was completed and the endothermic component disappeared.
The very first portion of the calorimetric profile was too complex for evaluation. The first few data points influenced by the endothermic after-peaks were excluded from the analysis, and the remaining portion of the titration curve was attempted to fit by various binding schemes. Good fit was only obtained by a three sequential binding site model. This model is a reasonable approximation also for independent binding sites with largely different affinities. As shown in Fig. 3, the measured data were nicely fitted with the applied model with binding parameters summarized in Table 1. For the HA binding a Kd of ca. 60 nM was obtained, while binding of two additional Ni(II) ions at LA sites occurred with a Kd of 2.1 and 8.9 µM, respectively. The LA sites are character- ized by rather similar thermodynamic parameters. However, the values obtained for ΔH and ΔS are apparent, and include contributions not only from Ni(II) binding, but also from associated events such as deprotonation of the cysteines and consequent change in the buffer ionization state.
In summary, our results suggest that FliC-NikRC binds Ni(II) ion at a HA site with dissociation constant in the 10−8 M range, and contains two additional LA binding sites with a Kd values in the µM region.
Ni binding kinetics revealed by grating‑coupled interferometry. We analyzed the binding kinetics of Ni(II) ions to FliC-NikRC using GCI under various conditions including different types of sensor surfaces for flagellin immobilization as well as low and high coverages of FliC-NikRC.
Figure 4A,B represents the immobilization of FliC-NikRC and FliC to the two separate channels of the lipo- philic PCP-LIP chip, which has a quasi-planar PCP coating with lipid anchoring motifs. The detected much higher amount of deposited mass of FliC-NikRC as compared to FliC (4950 vs. 680 pg/mm2) can be attributed to the higher molecular weight and larger interaction surface of the tetrameric FliC-NikRC. Assuming mon- olayer coverage and considering the molecular weight of flagellins (FliC-NikRC tetramer: 207.556 kDa, FliC:
51.612 kDa), from the measured surface mass one can calculate the effective occupied area of a single protein molecule. These areas were found to be 70 and 126 nm2 for FliC-NikRC tetramer and FliC, respectively. Taking into account that a single FliC-NikRC and FliC molecule attached to the surface through its hydrophobic D0 domain(s) has an average realistic footprint of around 30 and 20 nm2, the average separation distance between the immobilized molecules is 2.9 and 6.8 nm, respectively. However, the different shape and magnitude of the kinetic curves in Fig. 4A,B suggests that the tetrameric FliC-NikRC presumably interacts with the chip surface with multiple bonds, leading to an almost irreversibly adsorbed layer. While in case of FliC, a large amount of the molecules adsorbs reversibly and can be easily washed off, suggesting a reversible and an irreversible adsorption form.
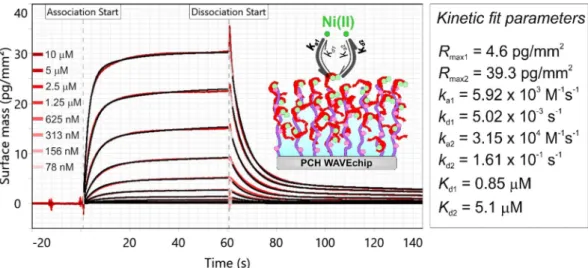
Figure 5 shows the measured kinetic data evaluated by the heterogeneous ligand kinetic model and kinetic parameters resulted from the model fit are also presented next to the graph. While other models (called as “1: 1 Figure 2. The 3D structure of the wild-type flagellin FliC, the genetically engineered FliC-NikRC and the FliC- NikRC tetramer that is spontaneously formed in solution. Each monomer unit of the FliC-NikRC tetramer has one HA Ni-binding site. Note that the D0 and partly the D1 domain forms a disordered region displaying high flexibility. While the structure of FliC (PDB ID: 1UCU) and NikR C-domain (PDB ID: 3BKU) is well established by electron microscopy, the shown structure of monomeric and tetrameric FliC-NikRC is based on modeling using the Chimera Software65. Due to the conformational variability in its disordered arms, only a hypothetical structure could be shown for the FliC-NikRC tetramer.
kinetic” and “bivalent analyte” model in the WAVEcontrol software) were also tested to fit the data, as a confirma- tion of the expectations based on ITC measurements, the best fit quality could be achieved by the heterogeneous ligand model. According to the results, two types of binding sites with different affinities were detected: one with a higher dissociation constant, meaning low (Kd1 = 23.5 µM) and one with a lower dissociation constant, mean- ing high Ni(II)-binding affinity (Kd2 = 59 nM). The fact that the model with two types of Ni-bindings sites on FliC-NikRC provided the best fit and that the determined Kd values of those sites agreed well with calorimetric data, strongly confirms our results and the performance of the GCI method.
Based on the Rmax values obtained for the HA and LA sites (2.5 vs. 28.4 pg/mm2), we found that the proportion of the HA and LA sites on a FliC-NikRC monomer is about 1:11. The finding that there are significantly more LA binding sites is well supported by observations of previous studies. According to the literature, this number can vary in the range of 12–32 per tetramer55,57,67. It is obvious from this large deviation that there is no clear consensus in the number of LA sites, which can be attributed to the difficulty of differentiating between them and determine their exact number. Considering the fact that one FliC-NikRC tetramer has 4 HA sites, our results suggest approximately 44 LA sites on one tetramer.
Besides the physisorption of flagellin onto the PCP-LIP surfaces, we also applied covalent immobilization to the hydrogel-based PCH chip that carries a high-capacity 3D immobilization matrix with carboxyl groups.
The details and results of these experiments on covalent immobilization are detailed in the Supplementary Information: Note 4. Whilst significant difference between the two channel signals could be clearly detected on the PCH surface too, the kinetic analysis reflected that only one type of Ni(II) binding site exists with a Kd of 1–6 µM (Fig. 6). Our result that the HA site disappears can be explained by the applied acidic pH at which the immobilization was performed. This finding is well supported by the observation of Fauquant and co-workers55 that the tetrameric structure of FliC-NikRC breaks up at pH below 5, leading to the loss of HA sites.
To push the limits of the GCI technology, we also measured the Ni(II)-binding kinetics of FliC-NikRC when a much lower amount of protein tetramers was immobilized on the PCP-LIP surface (surface mass 840 pg/mm2, Figure 3. ITC results on the determination of the Kd values of FliC-NikRC binding sites in solution. (A) Raw (top) and integrated (bottom) thermograms. (B) The measured data points were fitted by the “Sequential Binding Sites” model (MicroCal) assuming 3 Ni-binding sites.
Table 1. Thermodynamic parameters for the best fit of ITC binding curve by the “Sequential Binding Sites”
model.
Kd (M) ΔH (cal/mol) ΔS (cal/mol/deg)
HA binding site 62.5 × 10⁻⁹ − 6301 11.8
LA binding site 1 2.13 × 10⁻⁶ − 3897 12.9
LA binding site 2 8.93 × 10⁻⁶ − 3731 10.6
Figure 4. (A,B) FliC-NikRC and FliC immobilization series performed on PCH chip using channel Ch1 and Ch2, respectively. The series included the injection of FliC-NikRC and FliC solution reaching 4950 pg/mm2 and 680 pg/mm2 adsorbed masses, respectively. All cycles involve a baseline (RB injection), a flagellin injection as well as a washing (RB injection) section (cycle sections are not indicated on the graph but can be followed according to the upgoing/dropping curves). The schemes on the bottom of the graphs illustrate the quasi-planar PCP coating with lipophilic functions and immobilized flagellin molecules.
Figure 5. Measured kinetic data of Ni(II) binding obtained at high FliC-NikRC coverage on a PCP-LIP WAVEchip (red curves). The shown measurement curves were adjusted and represent Ch1-Ch2 reference corrected data. The data were fitted using the heterogeneous ligand kinetic model (black curves). The spikes at association start and dissociation start annotations were originated from solution exchange effect. The inset scheme illustrates the binding of Ni to the FliC-NikRC tetramers which were immobilized on the quasi-planar lipophilic coating of the PCP-LIP chip. While the solid circles with dark green color represent Ni(II) ions bound to the HA sites, the light green circles represent Ni(II) ions bound to the LA sites. Kinetic data determined from the model fit are shown in the right table. Here, subscript index 1 and 2 correspond to the HA and LA sites, respectively, Rmax is the maximal response value, ka and kd are the association and dissociation rate constants as well as Kd is the dissociation constant.
separation distance 15 nm). Due to the low atomic weight of the Ni analyte and the low immobilization density, extremely low signals (0.1–1.4 pg/mm2) were obtained, which however, fell into the detectable range and as shown in Fig. 7, the kinetic curves corresponding to the separate concentrations could be efficiently resolved. The obtained Kd values are in reasonable agreement with the results obtained on PCP-LIP chip at high coverage. In addition, compared to the high coverage PCP-LIP measurement, the proportion of the Rmax values corresponding to the HA and LA sites (1:13) could be also well reproduced. The fact that the kinetic curves could be resolved even at the 0.1–1.4 pg/mm2 range clearly demonstrates the unprecedented sensitivity of the GCI technology.
It is important to note that both the kinetic constants and the dissociation constant of the binding for the LA site is approximately the same, irrespective of the layer density of the tetramer molecules. However, interestingly, large deviations are seen for the HA binding sites. We believe that these discrepancies are in close connection with the deposition density of molecules and available space for the disordered terminal regions fixing the tetramers on the surface. It can be reasonably assumed that in case of low coverage, the tetramer is immobilized through 2–3 arms, affecting accessibility of the HA sites. Since the LA sites are not affected by the tetramer formation56, their binding properties remain approximately the same, independent of the immobilization density which is in full Figure 6. Measured kinetic data of Ni(II) binding obtained at high FliC-NikRC coverage on a PCH WAVEchip (red curves). The shown measurement curves were adjusted and represent Ch1-Ch2 reference corrected data.
The data were fitted using the heterogeneous ligand kinetic model (black curves). The inset scheme illustrates the binding of Ni to the FliC-NikRC monomers which were immobilized on the thick hydrogel coating of the PCH chip. The light green circles represent Ni(II) ions bound to LA sites.
Figure 7. Measured kinetic data of Ni(II) binding obtained at low FliC-NikRC coverage on a PCP-LIP WAVEchip (red curves). The shown measurement curves were adjusted and represent Ch1-Ch2 reference corrected data. The data were fitted using the heterogeneous ligand kinetic model (black curves). The inset scheme illustrates the binding of Ni to the FliC-NikRC tetramers which were immobilized on the quasi-planar lipophilic surface of the PCP-LIP chip. While the solid circles with dark green color represent Ni(II) ions bound to the HA sites, the light green circles represent Ni(II) ions bound to the LA sites.
agreement with our observations. This finding shows that performing an affinity measurement at low and high immobilization densities can potentially reveal important properties of the system. This further highlights the need of high detection sensitivity. Of note, similar observations were reported previously. We would like to stress that it is well-demonstrated68–71 that the chip type, the properties of the surface layer and the way of immobiliza- tion generally affect the apparent binding affinity, resulting in a difference in the measured Kd values determined by ITC and label-free methods (like SPR). This effect is not special for GCI, it is true for other methods based on surface sensing layers. This is not surprising, since immobilization can strongly affect the local environment of the molecules and potentially introduces some steric constraints, too.
Conclusions
In this study, we have demonstrated the unprecedented capability of the GCI label-free biosensor technique in detecting the interaction of extremely small < 100 Da analytes with their target ligand and analyzing the kinetics of the binding events.
The interaction examined in this work was the binding of Ni(II) ions (59 Da) to a newly developed FliC- NikRC flagellin variant designed to possess Ni(II)-responsive property in the submicromolar range. For this purpose, part of the transcription factor NikR, which has Ni-binding sites, was incorporated into the wild-type FliC flagellin using genetic engineering.
The binding kinetics of Ni(II) was measured under various conditions including different chip surface chem- istries used for flagellin immobilization (PCP-LIP, PCH) as well as varying the coverage level of immobilized FliC-NikRC (low and high coverages). Summary of the Ni(II) kinetic data obtained by the GCI technique are summarized in Supplementary Information: Note 5. Based on the measurements on PCP-LIP lipid anchoring surfaces at high FliC-NikRC coverage (4950 pg/mm2), we found that FliC-NikRC has two types of Ni-binding sites which present different Ni affinities, involving low-affinity (Kd = 23.5 µM) and high-affinity (Kd = 59 nM) binding sites. This result is supported reasonably well with ITC data obtained in solution at equilibrium. Measurements carried out with covalently immobilized FliC-NikRC on PCH surface confirmed that the HA binding site is sen- sitive to the pH: at acidic pH (around pH 3.5), the tetrameric structure of FliC-NikRC breaks up, losing its HA sites. The application of different surface chemistries revealed that the dynamic behavior of HA binding sites is affected by the FliC-NikRC immobilization density. Note, the immobilization affected the Kd and ka value, but kd was less influenced. Interestingly, we observed similar behavior in case of integrin receptors binding the RGD peptide motif in a locally varied environment due to enzymatic digestion of the glycocalyx around the target integrins (Kanyo et al. under publication). At low immobilization densities the need for high sensitivity is even more pronounced. Exploiting the top-level detection limit of the present method, we could detect the presence of nM binding sites even when the FliC-NikRC was immobilized at low coverage level to the PCP-LIP surface (840 pg/mm2). This result proves that the interferometric detection technique with the applied double referencing method is fully capable of revealing the binding kinetics of a 59 Da metal ion even at low immobilized ligand level. These results could open up new possibilities in biology, especially in the research of metal-binding proteins.
Received: 12 August 2020; Accepted: 3 December 2020
References
1. Nirschl, M., Reuter, F. & Vörös, J. Review of transducer principles for label-free biomolecular interaction analysis. Biosensors 1, 70–92 (2011).
2. Estevez, M. C., Alvarez, M. & Lechuga, L. M. Integrated optical devices for lab-on-a-chip biosensing applications. Laser Photon.
Rev. 6, 463–487 (2012).
3. Soler, M., Huertas, C. S. & Lechuga, L. M. Label-free plasmonic biosensors for point-of-care diagnostics: a review. Expert Rev. Mol.
Diagn. 19, 71–81 (2019).
4. Homola, J. Surface plasmon resonance sensors for detection of chemical and biological species. Chem. Rev. 108, 462–493 (2008).
5. Fang, Y., Ferrie, A. M., Fontaine, N. H., Mauro, J. & Balakrishnan, J. Resonant waveguide grating biosensor for living cell sensing.
Biophys. J. 91, 1925–1940 (2006).
6. Orgovan, N. et al. Dependence of cancer cell adhesion kinetics on integrin ligand surface density measured by a high-throughput label-free resonant waveguide grating biosensor. Sci. Rep. 4, 4034 (2015).
7. Sztilkovics, M. et al. Single-cell adhesion force kinetics of cell populations from combined label-free optical biosensor and robotic fluidic force microscopy. Sci. Rep. 10, 61 (2020).
8. Solis-Tinoco, V. et al. Building of a flexible microfluidic plasmo-nanomechanical biosensor for live cell analysis. Sens. Actuators B Chem. 291, 48–57 (2019).
9. Lirtsman, V., Golosovsky, M. & Davidov, D. Surface plasmon excitation using a Fourier-transform infrared spectrometer: Live cell and bacteria sensing. Rev. Sci. Instrum. 88, 103105 (2017).
10. Cooper, M. A. Optical biosensors in drug discovery. Nat. Rev. Drug Discov. 1, 515–528 (2002).
11. Geschwindner, S., Carlsson, J. F. & Knecht, W. Application of optical biosensors in small-molecule screening activities. Sensors 12, 4311–4323 (2012).
12. Fang, Y. Label-free biosensor methods in drug discovery (Springer, New York, 2015). https ://doi.org/10.1007/978-1-4939-2617-6 13. Orgovan, N. et al. Sample handling in surface sensitive chemical and biological sensing: a practical review of basic fluidics and
analyte transport. Adv. Colloid Interface Sci. 211, 1–16 (2014).
14. Fang, Y. Label-free biosensors for cell biology. Int. J. Electrochem. 2011, 1–16 (2011).
15. Debreczeni, M. L. et al. Human primary endothelial label-free biochip assay reveals unpredicted functions of plasma serine pro- teases. Sci. Rep. 10, 3303 (2020).
16. Peter, B. et al. Green tea polyphenol tailors cell adhesivity of RGD displaying surfaces: multicomponent models monitored opti- cally. Sci. Rep. 7, 42220 (2017).
17. Peter, B., Saftics, A., Kovacs, B., Kurunczi, S. & Horvath, R. Oxidization increases the binding of EGCG to serum albumin revealed by kinetic data from label-free optical biosensor with reference channel. Analyst 145, 588–595 (2020).
18. Doll, N. M. et al. A two-way molecular dialogue between embryo and endosperm is required for seed development. Science (80-) 367, 431–435 (2020).
19. Hohmann, U., Nicolet, J., Moretti, A., Hothorn, L. A. & Hothorn, M. The SERK3 elongated allele defines a role for BIR ectodomains in brassinosteroid signalling. Nat. Plants 4, 345–351 (2018).
20. Yu, Q. et al. Detection of low-molecular-weight domoic acid using surface plasmon resonance sensor. Sens. Actuators B Chem.
107, 193–201 (2005).
21. Neumann, T., Junker, H., Schmidt, K. & Sekul, R. SPR-based fragment screening: advantages and applications. Curr. Top. Med.
Chem. 7, 1630–1642 (2007).
22. Shepherd, C. A., Hopkins, A. L. & Navratilova, I. Fragment screening by SPR and advanced application to GPCRs. Prog. Biophys.
Mol. Biol. 116, 113–123 (2014).
23. Zhang, Y., Xu, M., Wang, Y., Toledo, F. & Zhou, F. Studies of metal ion binding by apo-metallothioneins attached onto preformed self-assembled monolayers using a highly sensitive surface plasmon resonance spectrometer. Sens. Actuators B Chem. 123, 784–792 (2007).
24. Daniyal, W. M. E. M. M. et al. Enhancing the sensitivity of a surface plasmon resonance-based optical sensor for zinc ion detection by the modification of a gold thin film. RSC Adv. 9, 41729–41736 (2019).
25. Forzani, E. S., Zhang, H., Chen, W. & Tao, N. Detection of heavy metal ions in drinking water using a high-resolution differential surface plasmon resonance sensor. Environ. Sci. Technol. 39, 1257–1262 (2005).
26. Gestwicki, J. E., Hsieh, H. V. & Pitner, J. B. Using receptor conformational change to detect low molecular weight analytes by surface plasmon resonance. Anal. Chem. 73, 5732–5737 (2001).
27. Wu, C. M. & Lin, L. Y. Immobilization of metallothionein as a sensitive biosensor chip for the detection of metal ions by surface plasmon resonance. Biosens. Bioelectron. 20, 864–871 (2004).
28. Zinoviev, K. E., Gonzalez-Guerrero, A. B., Dominguez, C. & Lechuga, L. M. Integrated bimodal waveguide interferometric biosen- sor for label-free analysis. J. Light. Technol. 29, 1926–1930 (2011).
29. González-Guerrero, A. B., Maldonado, J., Herranz, S. & Lechuga, L. M. Trends in photonic lab-on-chip interferometric biosensors for point-of-care diagnostics. Anal. Methods 8, 8380–8394 (2016).
30. Maldonado, J. et al. Label-free detection of nosocomial bacteria using a nanophotonic interferometric biosensor. Analyst 145, 497–506 (2020).
31. Schipper, E. F. et al. The realization of an integrated Mach-Zehnder waveguide immunosensor in silicon technology. Sens. Actuators B Chem. 40, 147–153 (1997).
32. Sepúlveda, B. et al. Optical biosensor microsystems based on the integration of highly sensitive Mach-Zehnder interferometer devices. J. Opt. A Pure Appl. Opt. 8, S561–S566 (2006).
33. Karim, K., Taylor, J. D., Cullen, D. C., Swann, M. J. & Freeman, N. J. Measurement of conformational changes in the structure of transglutaminase on binding calcium ions using optical evanescent dual polarisation interferometry. Anal. Chem. 79, 3023–3031 (2007).
34. Coan, K. E. D., Swann, M. J. & Ottl, J. Measurement and differentiation of ligand-induced calmodulin conformations by dual polarization interferometry. Anal. Chem. 84, 1586–1591 (2012).
35. Kozma, P., Hamori, A., Cottier, K., Kurunczi, S. & Horvath, R. Grating coupled interferometry for optical sensing. Appl. Phys. B 97, 5–8 (2009).
36. Fan, X. et al. Sensitive optical biosensors for unlabeled targets: a review. Anal. Chim. Acta 620, 8–26 (2008).
37. Kozma, P., Hámori, A., Kurunczi, S., Cottier, K. & Horvath, R. Grating coupled optical waveguide interferometer for label-free biosensing. Sens. Actuators B Chem. 155, 446–450 (2011).
38. Patko, D., Cottier, K., Hamori, A. & Horvath, R. Single beam grating coupled interferometry: high resolution miniaturized label- free sensor for plate based parallel screening. Opt. Express 20, 23162 (2012).
39. Sandoval, P. J. & Santiago, J. In vitro analytical approaches to study plant ligand-receptor interactions. Plant Physiol. 182, 1697–1712 (2020).
40. Okuda, S. et al. Molecular mechanism for the recognition of sequence-divergent CIF peptides by the plant receptor kinases GSO1/
SGN3 and GSO2. Proc. Natl. Acad. Sci. 117, 2693–2703 (2020).
41. Lorenzo-Orts, L., Hohmann, U., Zhu, J. & Hothorn, M. Molecular characterization of CHAD domains as inorganic polyphosphate- binding modules. Life Sci. Alliance 2, e201900385 (2019).
42. Moussu, S. et al. Structural basis for recognition of RALF peptides by LRX proteins during pollen tube growth. Proc. Natl. Acad.
Sci. https ://doi.org/10.1073/pnas.20001 00117 (2020).
43. Hohmann, U. et al. Mechanistic basis for the activation of plant membrane receptor kinases by SERK-family coreceptors. Proc.
Natl. Acad. Sci. 115, 3488–3493 (2018).
44. Lau, K., Podolec, R., Chappuis, R., Ulm, R. & Hothorn, M. Plant photoreceptors and their signaling components compete for COP1 binding via VP peptide motifs. EMBO J. 38, 1–18 (2019).
45. Pitsawong, W. et al. Dynamics of human protein kinase aurora a linked to drug selectivity. Elife 7, 1–30 (2018).
46. Andres, F. et al. Inhibition of the MET kinase activity and cell growth in MET-addicted cancer cells by bi-paratopic linking. J. Mol.
Biol. 431, 2020–2039 (2019).
47. Walter, J. D. et al. Sybodies targeting the SARS-CoV-2 receptor-binding domain (2020).
48. Yonekura, K., Maki-Yonekura, S. & Namba, K. Complete atomic model of the bacterial flagellar filament by electron cryomicros- copy. Nature 424, 643–650 (2003).
49. Muskotál, A., Seregélyes, C., Sebestyén, A. & Vonderviszt, F. Structural basis for stabilization of the hypervariable D3 domain of salmonella flagellin upon filament formation. J. Mol. Biol. 403, 607–615 (2010).
50. Klein, Á., ToÁth, B., Jankovics, H., MuskotaÁl, A. & Vonderviszt, F. A polymerizable GFP variant. Protein Eng. Des. Sel. 25, 153–157 (2012).
51. Kovacs, N. et al. Optical anisotropy of flagellin layers: in situ and label-free measurement of adsorbed protein orientation using OWLS. Anal. Chem. 85, 5382–5389 (2013).
52. Kovacs, B. et al. Flagellin based biomimetic coatings: from cell-repellent surfaces to highly adhesive coatings. Acta Biomater. 42, 66–76 (2016).
53. Schreiter, E. R. et al. Crystal structure of the nickel-responsive transcription factor NikR. Nat. Struct. Biol. 10, 794–799 (2003).
54. Carrington, P. E., Chivers, P. T., Al-Mjeni, F., Sauer, R. T. & Maroney, M. J. Nickel coordination is regulated by the DNA-bound state of NikR. Nat. Struct. Biol. 10, 126–130 (2003).
55. Fauquant, C. et al. pH dependent Ni(II) binding and aggregation of Escherichia coli and Helicobacter pylori NikR. Biochimie 88, 1693–1705 (2006).
56. Chivers, P. T. & Sauer, R. T. NikR repressor: High-affinity nickel binding to the C-terminal domain regulates binding to operator DNA. Chem. Biol. 9, 1141–1148 (2002).
57. Diederix, R. E. M., Fauquant, C., Rodrigue, A., Mandrand-Berthelot, M. A. & Michaud-Soret, I. Sub-micromolar affinity of Escherichia coli NikR for Ni(II). Chem. Commun. https ://doi.org/10.1039/b7196 76h (2008).
58. Day, Y. S. N., Baird, C. L., Rich, R. L. & Myszka, D. G. Direct comparison of binding equilibrium, thermodynamic, and rate con- stants determined by surface- and solution-based biophysical methods. Protein Sci. 11, 1017–1025 (2002).
59. Rich, R. L., Day, Y. S. N., Morton, T. A. & Myszka, D. G. High-resolution and high-throughput protocols for measuring drug/
human serum albumin interactions using BIACORE. Anal. Biochem. 296, 197–207 (2001).
60. Cuyvers, S. et al. Isothermal titration calorimetry and surface plasmon resonance allow quantifying substrate binding to different binding sites of Bacillus subtilis xylanase. Anal. Biochem. 420, 90–92 (2012).
61. Murthy, B. N., Sinha, S., Surolia, A., Indi, S. S. & Jayaraman, N. SPR and ITC determination of the kinetics and the thermodynamics of bivalent versus monovalent sugar ligand–lectin interactions. Glycoconj. J. 25, 313–321 (2008).
62. Kovacs, B. et al. Bacteria repellent layer made of flagellin. Sens. Actuators B Chem. 257, 839–845 (2018).
63. Kovacs, B. et al. Kinetics and structure of self-assembled flagellin monolayers on hydrophobic surfaces in the presence of hofmeister salts: experimental measurement of the protein interfacial tension at the nanometer scale. J. Phys. Chem. C 122, 21375–21386 (2018).
64. Klein, Á. et al. Nanobody-displaying flagellar nanotubes. Sci. Rep. 8, 3584 (2018).
65. Pettersen, E. F. et al. UCSF Chimera: a visualization system for exploratory research and analysis. J. Comput. Chem. 25, 1605–1612 (2004).
66. Zambelli, B., Bellucci, M., Danielli, A., Scarlato, V. & Ciurli, S. The Ni2+ binding properties of helicobacter pylori NikR. Chem.
Commun. https ://doi.org/10.1039/b7060 25d (2007).
67. Phillips, C. M., Schreiter, E. R., Stultz, C. M. & Drennan, C. L. Structural basis of low-affinity nickel binding to the nickel-responsive transcription factor NikR from Escherichia coli. Biochemistry 49, 7830–7838 (2010).
68. Wolf, L. K., Gao, Y. & Georgiadis, R. M. Kinetic discrimination of sequence-specific DNA–drug binding measured by surface plasmon resonance imaging and comparison to solution-phase measurements. J. Am. Chem. Soc. 129, 10503–10511 (2007).
69. Brown, M. E. et al. Assessing the binding properties of the anti-PD-1 antibody landscape using label-free biosensors. PLoS ONE 15, 1–21 (2020).
70. Zhao, H., Gorshkova, I. I., Fu, G. L. & Schuck, P. A comparison of binding surfaces for SPR biosensing using an antibody–antigen system and affinity distribution analysis. Methods 59, 328–335 (2013).
71. Drake, A. W. et al. Biacore surface matrix effects on the binding kinetics and affinity of an antigen/antibody complex. Anal. Biochem.
429, 58–69 (2012).
Acknowledgements
This study was supported by the Lendület (Momentum) Program of the Hungarian Academy of Sciences as well as the ERC_HU, KH_17, and KKP_19 Programs of the National Research, Development and Innovation Office (NKFIH). This work was also supported by the BIONANO_GINOP-2.3.2-15-2016-00017 project and by the TKP2020-IKA-07 project financed under the 2020-4.1.1-TKP2020 Thematic Excellence Programme by the National Research, Development and Innovation Fund of Hungary. The support of Dr. Fabio M. Spiga and Dr.
Kaspar Cottier (Creoptix AG) is gratefully acknowledged, too.
Author contributions
R.H. established the GCI related research line and supervised the present work. B.K., A.S., T.G., I.S. and R.H.
developed the assay, performed the biosensor experiment and analyzed related data. Flagellin production, ITC and DLS experiments were done by H.J. and E.T. under the supervision of F.V.; A.S. and H.J. made the figures.
A.S., H.J., F.V. and R.H. discussed all results and wrote the paper.
Competing interests
The authors declare no competing interests.
Additional information
Supplementary Information The online version contains supplementary material available at https ://doi.
org/10.1038/s4159 8-020-79226 -w.
Correspondence and requests for materials should be addressed to R.H.
Reprints and permissions information is available at www.nature.com/reprints.
Publisher’s note Springer Nature remains neutral with regard to jurisdictional claims in published maps and institutional affiliations.
Open Access This article is licensed under a Creative Commons Attribution 4.0 International License, which permits use, sharing, adaptation, distribution and reproduction in any medium or format, as long as you give appropriate credit to the original author(s) and the source, provide a link to the Creative Commons licence, and indicate if changes were made. The images or other third party material in this article are included in the article’s Creative Commons licence, unless indicated otherwise in a credit line to the material. If material is not included in the article’s Creative Commons licence and your intended use is not permitted by statutory regulation or exceeds the permitted use, you will need to obtain permission directly from the copyright holder. To view a copy of this licence, visit http://creat iveco mmons .org/licen ses/by/4.0/.
© The Author(s) 2020