Áron Gyimesi, Áron Szennay, Melinda Krankovits, Júlia Nagy-Keglovich, János Rechnitzer
Flood of Resources and a Conceptual Change –
A Decade of Changes in Territorial Development with an Outlook
to the V4 Countries
Summary
Between 2007 and 2013, Hungary received resources from the European Union in the value of around HUF 8,000 billion, while the country is eligible to use funds of an additional 25 billion Euros (approximately equivalent to HUF 8,300 billion) up until 2020. Since the time of joining, Hungary has been one of the net beneficiary mem- ber states, since funds received from the EU budget exceed respective contributions. The positive balance adds up to around HUF 13,500 billion since accession. The draw- down of funds was a priority for the national government coming to power in 2010 and to this end; it initiated major changes in ter-
ritorial development policies. As a prevalent practice, planning was adjusted to the EU’s policies just as much as to the national strate- gic objectives, with the intent of promoting economic growth. Furthermore, the institu- tional background was centralized and ex- pected to operate with improved efficiency.
However, in governmental ex-post analyses, there are occasional sharp criticisms of the effectiveness of major structural changes.
What were the major characteristics of the territorial development systems in the pe- riod between 2007 and 2013? What chang- es occurred in the subsequent 2014–2020 multiannual financial framework? This study analyses the main motifs of system change
Áron Gyimesi PhD student, Széchenyi István University, Doctoral School of Regional- and Business Administration Sciences (SZE RGDI); Áron Szennay PhD student, SZE RGDI, Assistant Lecturer, Budapest Business School1; Melinda Krankovits PhD student, SZE RGDI, Assistant Lecturer, SZE; Júlia Nagy-Keglo- vich PhD student, SZE RGDI; Prof. Dr. János Rechnitzer DSc, university pro- fessor, Head of Doctorate School, SZE RGDI
and modification. The aim of this study is to provide a fair and balanced assessment of the period through examining these key areas.
Journal of Economic Literature (JEL) codes:
O4, R11, O43, O23, R11
Keywords: territorial development, institu- tional framework, resource utilisation, Introduction
This study examines territorial develop- ment policy in Hungary between 2010 and 2013. Although no complex appraisal of the past decade can yet be made, the 2014- 2020 programming period is also reviewed and comparisons are made with respect to the key thematic focal points (Operational Programmes). We strive to establish which tools of territorial development had the most significant impact on the definition and implementation of territorial devel- opment objectives. Macroeconomic pro- cesses, social tendencies and development policy have been simultaneously influenced in the period under examination by a num- ber of factors, which naturally also had an impact on the opportunities and challenges presented by territorial development poli- cies and measures.
This investigation did not extend to producing a general appraisal of territorial development performance during the given period; however, the aim is to pinpoint the focal points that had a significant impact on the result attained. We will focus on funda- mental changes and shifts in emphasis, irre- spective of whether they generate a positive of negative impacts with respect to the over- all system and overall system effectiveness.
The appraisal of the given period, which has been examined in a number of previous studies of scientific rigour, will be
compared to the results and practices of the four countries of the Visegrád Co-op- eration2 (V4), and thus put into an inter- national context. We will take a theoretical journey into the world of cross-border ter- ritorial development projects and interna- tional territorial development co-operation and comparisons.
Problem statement or excerpts from the appraisals of the use of resources during the 2007–2013 programming period
The period under examination, also tak- ing the t+2 rule into consideration, corre- sponds, to a significant degree, to the 2007- 2013 multiannual financial framework of the European Union3, as well as the respec- tive development programmes in Hun- gary: the New Hungary Development Plan (NHDP) and the supplementary New Hun- gary Rural Development Plan (NHRDP), as well as the New Széchenyi Plan (NSP) out- lining the 2010-2013 points of economic growth and economic development guide- lines (Matolcsy, 2010).
During the entire seven-year budgetary cycle, Hungary received resources in a val- ue close to HUF 8,000 billion (SAO, 2016), which had a significant social and economic impact, as pointed out by all appraisals. Any criticism may only be validly made regard- ing the results attained and the efficiency with which the sources were used. With re- spect to the use of funds received from the European Union, member states examine the attainment of objectives undertaken in both an advance (ex-ante) and subsequent (ex-poste) manner. Below, we examine some of the findings of these analyses.
In the course of the system audit con- cluded in February 2015 by the National
Development Agency (NDA) with respect to the 2007-2013 period, the State Audit Office (SAO) outlined the following main conclusions: (1) although funds drawdown efficiency improved, as compared to the 2004-2006 period, “the absence of concen- trated strategic planning was prominent, as was a prolongation of pay-outs”; (2) “the primary objective of the bidders was cen- tred on resources; their activities lacked a project approach; (3) “the operation of the institutional system conveying the EU resources was slow and complicated; it did not promote the quick and efficient con- veying of funds to the beneficiaries” (SAO, 2016).
The ex-post appraisal by the Prime Minister’s Office also makes a reference to conceptual weaknesses in this period: “For example, the fact that the developments fi- nanced using EU resources extended to the entire country was one of the most signifi- cant development results of the 2007-2013 period. The programme targeting the most disadvantaged micro-regions (SDMRs) was successful in significantly increasing the quantity of development resources re- ceived by the most disadvantaged regions.
Amongst conclusions, the most important criticism of the system involved the ab- sence of the overlapping of developments.
A number of appraisals have also pointed out that insufficient attention is paid in the system to the sustainability of project out- comes” (Kele, 2017).
The ex-post analysis ordered by the Eu- ropean Commission with respect to the use of resources from the European Regional Development Fund (ERDF) and the Cohe- sion Fund (CF) also confirms that during the 2007-2013 period there was no reduc- tion in the development gap between the different regions, with special regard to the
that between Budapest and Central Hun- gary and the other, less developed regions.
However, the report also stresses that, as a result of the use of resources (1) in overall terms, more than 100 thousand new jobs were created, of which 40 thousand were created in small and medium enterprises;
(2) close to half a million people were pro- vided the opportunity to connect to new or further developed wastewater treatment facilities; (3) 500 kilometres of new roads were built and an additional 2,521 kilome- tres of existing roads renewed (European Commission, 2016).
In the upcoming chapters we will exam- ine the tools that significantly promoted or, on the contrary, significantly hindered the efficient implementation of territorial de- velopment and the related use of resourc- es during the period under examination.
Based on Rechnitzer and Smahó (2011), these tools include: (1) objectives and na- tional and community plans; (2) organisa- tional frameworks and any potential chang- es therein; (3) the financing environment;
and (4) the management methodologies employed.
Community and national strategies, programmes and resources in
territorial development between 2007 and 2013
In 2004, Hungary and another nine, pre- dominantly former Socialist Bloc countries joined the European Union4. Although certain EU development resources (e.g.
PHARE) were already available previously, the funds available from the proportionate part of the 2000-2006 multiannual finan- cial framework and especially the resources available in the 2007-2013 period presented a significant development potential for the
new member states.
The same way as today, the national plans outlining the use of the EU resources had to strictly comply with EU structural policy in the period under examination.
This implies, with respect to the develop- ment of the New Hungary Development Plan (NHDP) and the operative plans promoting its implementation, that these are not directly based on local needs, but on the EU’s strategic goals (Faragó, 2016;
Buday-Sántha, 2010). The operational pro- grammes may thus be de jure used for as- sisting projects that simultaneously contrib- ute to the attainment of EU objectives and reflect on local needs, which qualifies as centrally initiated, reverse-direction plan- ning. National territorial development pol- icies and territorial development practices fundamentally conform to the directions determined at a higher level of planning.
The policies, priorities, methodologies and control mechanisms outlined by the EU influence the development objectives, processes, decision-making angles and op- portunities of the member states. They the- matise and, in certain instances, distort the above, disrupting local optimum efficiency.
European policies, community funds, domestic priorities, regional operational programmes The European Commission’s Cohesion Pol- icy, as the community development strategy to which all national policies are linked and harmonized, outlined three priority objec- tives for the 2007-2013 period: (1) conver- gence, (2) regional competitiveness and (3) European territorial co-operation (Eu- ropean Commission, 2007). The financial funds allocated to these objectives, from which the development projects could be financed through bidding, were the Eu-
ropean Regional Development Fund, the European Social Fund and the Cohesion Fund (Szabó, 2011).
“The European Regional Development Fund (ERDF) and the European Social Fund (ESF) are often jointly referred to as the Structural Funds, since they were cre- ated to provide resources throughout the EU for economic and social restructuring and to thereby reduce differences between the level of development of EU regions, for example in terms of infrastructure and em- ployment” (European Commission, 2007).5 These two funds, together with the Euro- pean Agricultural Fund for Rural Develop- ment (EAFRD) and the European Maritime and Fisheries Fund (EMFF), make up the European Structural and Investment Funds (ESI Funds) (European Commission, 2014).
In the interest of securing the resources and attaining national development objec- tives, the NHDP was harmonized with these policies and attuned with the dedicated funds (Jobbágy, 2015). The two primary economic development targets of the NHDP were to (1) expand employment and (2) lay down the conditions for long-term econom- ic growth (Lehmann and Nyers, 2009). In the period under examination, the attain- ment of objectives was broken down into 16 operational programmes, which could be allocated to seven priorities, including the priorities involving implementation and communication (Table 1).
In the 2007-2013 period, six out of the seven regions of Hungary were affected by the Convergence target based on average GDP per capita, since the respective indica- tors fell short of 75 per cent of the average GDP within the EU.6 Territorial develop- ment was listed as priority number 5, while the seven interlinked regional operational programmes accounted for close to a quar-
Table 1: Priorities and the operational programmes of the New Hungary Development Plan
Priorities Operational programme (OP)
Resources allocated in the NHDP (in EUR at current
rates) 1. Economic development Economic Development OP – GOP 2,495,769,115 2. Development of transport Transport OP – KÖZOP 6,223,429,149 3. Social renewal Social Renewal OP – TÁMOP 3,482,518,044 Social Infrastructure OP – TIOP 1,948,922,941 4. Development of the
environment and energy Environment and Energy OP – KEOP 4,178,846,341
5. Territorial development
Western Transdanubia OP – NYDOP 463,752,893 Central Transdanubia OP – KDOP 507,919,836 Southern Transdanubia OP – DDOP 705,136,988 Northern Hungary OP – EMOP 903,723,589 Northern Great Plain OP – EAOP 975,070,186 Southern Great Plain OP – DAOP 748,714,608 Central Hungary OP – KMOP 1,467,196,353 European Territorial Co-operation OP *
6. State reform State Reform OP – AROP 146,570,507
Electronic Administration OP – EKOP 358,445,113 Coordination and communi-
cation of the New Hungary
Development Plan Implementation OP – VOP 315,132,937
Source: NHDP, 2007, p. 130; www.palyazat.gov.hu/umft_operativ_programok
ter of the overall resources available with 5.77 billion EUR. Consequently, the territo- rial development priority was the one with the highest amount of allocated resources.
Based on the corresponding statement compiled by the European Commission (2016) (Table 2) with respect to the re- sources available, there is only a -11.2 mil- lion EUR gap between the 2007 budgeted and the April 2016 actual data, i.e. practi- cally the entire 100 per cent of EU resourc- es have been drawn down. At the same time, there was significant regrouping involving close to 2.000 billion EUR, primarily im- pacting R&D&I and environmental and transport infrastructure. These thematic
areas received over a thousand billion less in terms of resources, while the highest net growth in funds was recorded by en- ergy and other enterprise development. It is important to stress that the relatively low weight of the territorial dimension (4%) is caused by the fact that regional operational programmes financed developments be- longing to different themes in a significant degree, for example, local road renewal.
Complex rural development
Assistance from the European Agricultural Rural Development Fund (EARDF), which was newly established on 1 January 2007,
Table 2: Division of financial resources in the 2007–2016 period and respective shifts per category (early 2007 and April 2016)
million EUR Percentage
rate
Category 2007 2016 Increase Decrease Change 2007 2016
1. Innovation and R&D 1,591.2 1,488.4 478.3 –581.0 –102.7 7.5 7.0 2. Enterprise development 298.9 375.9 77.0 0.0 77.0 1.4 1.8 3. Other enterprise
development 1,583.4 2,035.7 452.3 0.0 452.3 7.4 9.6
4. ICT areas 749.5 654.0 0.0 –95.5 –95.5 3.5 3.1
5. Environmental
infrastructure 4,567.6 4,191.8 1.4 –377.3 –375.9 21.5 19.7
6. Energy 359.1 1,042.2 708.1 –25.0 683.2 1.7 4.9
7. Broadband networks 0.0 20.8 20.8 0.0 20.8 – 0.1
8. Road 3,591.8 3,276.7 0.0 –315.2 –315.2 16.9 15.4
9. Rail 1,657.4 1,720.1 62.8 0.0 62.8 7.8 8.1
10. Other transport 1,944.3 1,681.8 0.0 –262.5 –262.5 9.1 7.9 11. Human resources 233.6 190.1 0.0 –43.5 –43.5 1.1 0.9 12. Labour market 82.8 52.6 0.0 –30.2 –30.2 0.4 0.2 13. Cultural and social
infrastructure 2,926.1 2,832.9 4.6 –97.7 –93.2 13.7 13.3
14. Social cohesion 16.6 16.6 0.0 0.0 0.0 0.1 0.1
15. Territorial dimension 847.1 847.1 0.0 0.0 0.0 4.0 4.0
16. Capacity creation 4.3 4.3 0.0 0.0 0.0 0.0 0.0
17. Technical assistance 838.4 849.8 35.9 –24.4 11.5 3.9 4.0 Total 21,292.1 21,280.8 1,841.1 –1,852.3 –11.2 100.0 100.0 Source: European Commission, 2016
was conveyed to the people living in rural areas through the objectives and activities of the New Hungary Development Plan. Ter- ritories (settlements) eligible for assistance from the Rural Development Fund could be found in 165 from amongst the 168 micro- regions of Hungary (Sarudi, 2004).
In the framework of measure group III of the New Hungary Development Programme, more than 200 billion HUF were available between 2007 and 2013 for the practical implementation of complex rural develop-
ment concepts. The authority managing the programme, the Ministry of Agriculture and Rural Development (MARD) set the objec- tives of improving the quality of life of the people living in rural areas and expanding rural income generation opportunities, with emphasis having been placed on this latter goal (Bodnár and Hortobágyi, 2007). In the course of resource utilisation, the rate of implementation was high, typically between 85 and 100 per cent. The al location of re- sources was the most successful for axis I,
Table 3: NHDP group of measures, resource allocation and resource utilisation, 2007-2015 Group of measures
Financial weight (compared to overall public expenditure *)
Financial budget, planned (EUR)
Financial budget, utilized (EUR)
(% used) Measure group I: Developing
the competitiveness of the agri-
cultural and forestry sectors 47% 2,278,420,186 2,252,218,694 (98.9%) Measure group II: Environmen-
tal and rural development 32% 1,768,863,808 1,647,242,218 (93.1%) Measure group III: Rural qual-
ity of life and rural economy
diversification 17% 689,137,572 588,018,329
(85.3%)
Measure group IV: LEADER+
(5.5% = Subtracted from the amounts allocated to measure groups I to III in the ratio of 25-10-65%)
275,672,859 237,422,872 (86.1%)
Technical assistance 4% 205,860,358 201,594,640
(97.9%) Note: *As per Article 12 (2) of Regulation No. 1290/2005 EC
Source: Bálint, 2009; www.palyazat.gov.hu/az-j-magyarorszg-vidkfejlesztsi-program-2007-2013-utlagos- ex-post-rtkelse
where a predominant part of measures re- corded resource use in excess of 90 per cent.
With respect to axes III and IV however, only 85 per cent of the available resources were used.7
Regional development between 2010 and 2014; system restructuring and respective consequences
Following the change of government in 2010, the EU funding system and regional development was fully revised, which im- pacted almost all elements of regional poli- cy. As part of this process the following tasks were implemented:
– development of national economy and other policy strategies and plans;
– restructuring of institutions;
– modification of legal and manage- ment structures.
All elements were intended to speed up the implementation of measures and to im- prove the efficiency of processes, since the absorption rate of the available financial funds was extremely low, while the coun- try’s economic position also became fragile owing to the international financial crisis (Győriné, 2014b).
“The new government set up after the change of government in 2010 faced a sig- nificant dilemma with respect to the use of EU resources: either to fully reorganize the approved content and focuses of the NHDP and its operational programmes … or to use the resources in accordance with the approved plan documentation – if nec- essary, in a manner parallel to the creation and communication of a cover plan docu- ment. The government opted for this lat- ter alternative and prepared the so-called
»New Széchenyi Plan« (NSP), which was
practically nothing more than a »cover story« i.e. the renaming of the operational programmes of the NHDP in line with the focus points announced by the new govern- ment” (Jobbágy, 2015, p. 96). The points of growth outlined in the NHDP were the fol- lowing: (1) Healing Hungary Programme, (2) Green Economy Development Pro- gramme, (3) Home Creation Programme, (4) Enterprise Development Programme, (5) Science Innovation Programme, (6) Employment Programme, (7) Transport Development Programme (NSP, 2014). At the same time, programme implementa- tion continued to be in accordance with the NHDP and the interlinked operational programmes approved by the European Commission.
Strategies and plans impacting regional development between 2010 and 2014
There were many other nationwide plans compiled in the 2010-2014 period, which
impacted regional development policy.
These were primarily plans of a domestic focus that were not compiled with the di- rect intent of drawing down EU resources.
Although domestic plans also calculated with the use of EU funds, their structure and boundary conditions were significantly different to those of the individual opera- tional programmes (Péti et al., 2014).
All of the plans referred to above were aimed at stimulating the economy and, in implicit terms, at territorial development.
Plans were also bundled in a number of in- stances, for example the Wekerle Plan and the Mikó Imre Plan were also made part of the Hungarian Development Plan.8 As op- posed to the previous practice, a number of the plans were named after historical figures, which was new phenomenon.9 The primary details of the plans examined are outlined in Table 4.
Results of the 2010-2014 plan prepara- tion activities are implicitly summarized by the National Development and Regional Table 4: The major figures of non-EU related plans between 2010 and 2014
Name of plan Year of
publication Plan compiled/supervised by Széll Kálmán Plan 2010 Government of the Republic of Hungary Darányi Ignác Plan 2012 Ministry of Rural Development
National Rural Strategy 2012 Ministry of Rural Development Széll Kálmán Plan 2.0 2012 Government of Hungary
Wekerle Plan 2012 Ministry of National Economy
Mikó Imre Plan 2012 Ministry of National Economy
Foreign Trade Strategy 2011 Ministry of National Economy Hungarian Growth Plan 2011 Ministry of National Economy National Tourism Development
Concept 2014 Ministry of National Economy,
Office for National Economic Planning National Development and
Regional Development Concept 2013/2014* n.a.
Note: *NDRDC was prepared in 2013, but only adopted by Parliament in 2014 Source: Compiled by the authors
Development Concept (NDRDC). We wish to highlight three features of the NDRDC10.
(1) As opposed to earlier traditions, instead of separate National Regional De- velopment Concept and National Develop- ment Concept documents, an integrated concept was compiled.
(2) Justification for the different devel- opments was given in the NDRDC, there- fore the concept was developed in a manner integrated with all of the plan documents.
Since the primary source of financing were the 2014-2020 operational programmes, this also implied that everything was ulti- mately centred around the EU2020 strat- egy, the superior plan for the OPs.
(3) Some of the approved plans (e.g.
National Rural Strategy, Wekerle Plan) were subordinated to the NDRDC as specialist and overall policy strategies, while others (e.g. Széll Kálmán Plan11) were not men- tioned in the NDRDC and not updated.
Review of the 2014-2020 programming period from the aspect of territorial development The territorial development concept for the 2014-2020 period was simultaneously im- pacted by external and internal factors. The EU 2020 strategy outlines three fundamen- tal priorities: intelligent, sustainable and in- clusive growth. The primary objective is to formulate a more resource efficient, more environmentally friendly and more com- petitive economy based on knowledge and innovation, in a manner that also enables a high level of employment, as well as social and territorial cohesion (European Com- mission, 2016). Cohesion policy strategy outlines 11 goals of thematic concentration that promote business investments. Instead of a regional approach, a local and settle-
ment level perspective is favoured, for which new tools were also made available by the EU, in the form of integrated regional in- vestments and community-led local develop- ments (CLLD). Additionally, the EU favours the quality use of funds, i.e. solutions that enable the joint measurability of expected/
attained results and expenditures (Győriné, 2014a). In the interest of better and more thorough accountability, one of the primary tasks was the compilation of measurable and clear-cut targets. Additionally, the overcom- plicated and cumbersome administrational burdens characteristic of the previous cycle had been simplified, therefore a uniform regulatory framework was introduced for all 5 funds, with a system of conditions that al- lowed for disbursements to be made subject to special preconditions. Another important condition included in the regulatory frame- work was the provision that the Commis- sion is entitled to decline disbursement, if a member state fails to comply with the rules set by the EU regarding the economy. In addition to all of the above boundary con- ditions, the domestic conditions necessary for implementation also had to be estab- lished. Accordingly, economic development was also made the primary target amongst domestic objectives and additionally, based on experiences from the previous cycle, the efficient and fast drawdown of resources be- came an emphasized objective. Also, fewer operational programmes of more flexible usability were compiled. The institutional framework had already been restructured prior to the commencement of the cycle, with respective roles having been given to the counties and the towns of a county rank, instead of the regions, while the supervising authorities were allocated to three ministries and the Prime Minister’s Office (Tipold et al., 2016). The centralisation intent became
evident with the transformation of the insti- tutional framework. With respect to regional development, the related planning tasks were given to the 8 regional development councils still operating today, while the de- velopment guidelines were determined in 10 operational programmes that were out- lined in the NDRDC and were in accordance with the EU targets. Implementation was concentrated in the hands of the member of government responsible for territorial de- velopment related strategic planning, which is currently the Minister of Finance. In the case of RDOPs, the Hungarian State Treas- ury was also made an implementer. The Cab- inet likewise set up the framework of Széche- nyi Programme Offices, which had the role
of facilitating, in operative terms, the use of resources in the interest of supporting the line of potent beneficiaries (Simó, 2019).
The medium-term priorities of the NDRDC are in accordance with the targets outlined in the Ministry of Finance and are therefore also equivalent to the goals laid down in the Europe 2020 strategy. National regional development targets were com- piled by the different ministries and state secretariats, and they are usually not im- plemented separately, but linked to a num- ber of tasks. The primary territorial policy and territorial development goals of the NDRDC are the following: urban develop- ment, the development of the metropolitan area of Budapest and rural development Table 5: Comparison of the 2007-2013 and 2014–2020 planning periods
Resource 1 OP, 1 Fund 1 OP, resources from both the ERDF and the ESF
Thematic
focus competence of member states
mandatory ERDF thematic focus (energy ef- ficiency, SMEs, R&D&I, ICT)
Support from
specialist fields competence of member states
competence of member states, but ex-ante conditions (strategy formulation) Thematic
focus points 15 OPs
9 OPs, more focussed planning at an EU and domestic level (11 thematic objectives, EU2020 strategy)
Focus Economic development – 16 %, Employment as a social issue
Economic development – 60%,
Employment as part of economic develop- ment
Tools of local co-operation
– LEADER-community initiative for developing local economies, – Integrated Urban Devel-
opment Strategy (IUDS)
– ITP (Integrated Territorial Programmes) – closely interrelated with each other, enable developments of better substantiation with more visible links and synergies
– ITDS (Integrated Territorial Development Strategy)
Territorial levels
Regional OPs (7), Planning level: statistical region
– Territorial and Settlement Development OP – Competitive Central Hungary OP
– Planning level: county, town of county rank Outcome
expectation Inspection of indicators upon conclusion of OP
Liabilities linked also to performance frame- work and partial results
Source: Gere et al., 2014, p. 23
programmes. The most important tasks to be implemented include reducing differ- ences and enhancing convergence among regions and stimulating the economy. The objective of cross-border programmes (ETC, border-region and transnational programmes) is to strengthen the macro- economic role played by the country. In ad- dition to these, it is also important to men- tion the Common Spatial Development Strategy and the Carpathian Basin Spatial Co-operation (Ministry of Finance, 2018).
The following table describes the ma- jor differences between the 2007–2013 and 2014–2020 planning periods.
According to the summary published in 2018 by Századvég Economic Research Zrt, based on 2016 end of year results, Hungary fell short (47-50%) of the economic devel- opment undertaking announced by the EC, which should have at least reached the targeted 60 per cent of the overall resource amount. Since the tender invitations had all been published during the first two years of the EU cycle, these data still qualify as consistent.
The V4 have, together with Bulgaria and Romania (V4+2) developed a Common Re- gional Development Strategy, with the intent of enabling the development of the region based on the priorities outlined in the strat- egy and effectively representing their com- mon interests within the EU. The document emphasizes the necessity of cross-border de- velopment and co-operation (Guti, 2014).
Changing institutional framework The division of EU resources and the re- structuring of the institutional framework managing regional development involved the centralisation of functions and tasks in the 2010-2014 period. As we have al- ready mentioned previously, there were two underlying, partially overlapping problems. On the one hand the draw- down and disbursement of funds was slow (Table 3), which posed a risk to the full absorption of funds, on the other hand the restructured, centralized institutional framework enabled the concentrated, ef- ficient use of resources (Jobbágy, 2015).
Table 6: Progression of the Operational programmes per funding phase based on performance indicators expressed as a percentage of the 7-year appropriation, 2011
OP/Priority Announced/OP (%) Awarded/OP (%) Contracted/OP (%) Paid/OP (%)
ROPs in total 56% 54% 48% 24%
SROP 58% 34% 34% 17%
EPAOP 66% 43% 43% 20%
EDOP 63% 54% 51% 21%
EEOP 42% 35% 31% 5%
TOP 87% 72% 64% 17%
SROP 55% 41% 41% 19%
SIOP 84% 61% 53% 12%
IOP 49% 49% 53% 39%
Total 64% 54% 49% 17%
Source: Jobbágy, 2015, p. 112
From the point of view of territorial development management, by means of the December 2011 amendment of the Act on Spatial Development, the govern- ment made a significant decision impact- ing territorial development planning by allocating territorial development policy issues to the counties, i.e. to county gov- ernments (Gálosi-Kovács and Haffner, 2017). Although in line with the EU’s regional focus, earlier professional pre- paratory activities recommended the fa- vouring of regionalisation and the roles of regions, with this step the regional break- down characteristic prior to EU member- ship was quasi revived.
“The allocation of the tasks of territo- rial development to county governments required the significant restructuring of the institutional framework and the tools of territorial development. The impacted county governments became the legal suc- cessors of the regional and county territo- rial development councils” (Gálosi-Kovács and Haffner, 2016). Their tasks equally extended to concept development, to planning, to the inspection of implemen- tation, to decisions related to the use of resources and to coordination.
The modification of the institution- al framework of EU funds practically brought about the separation, within the state administrational organisation, of the development and the traditional govern- ance functions. The new and uniform de- velopment policy institutional framework operating semi-independently from the traditional administrative structures was primarily in accordance with the logic of receiving and using EU funds. “The creation of an institutional framework for EU funds in a fully separate manner from the institutional framework for ter-
ritorial development had an impact that was contradictory to the decentralisation process announced by government, and it strengthened the central administrational level. While creating parallel structures, it increased uncertainties related to the division of tasks and competences, it in- creased the number of government offi- cials and it created new tasks of coordina- tion and new administrative tensions, not to forget the division of available capaci- ties” (Perger, 2010).
The institutional framework for ROP implementation remained centralized and the only Managing Authority, central- ized in a manner similar to the sectoral managing authorities (MAs), became part of the NDA. At the same time, however, the centralized structure was mitigated by the fact that local stakeholders were given a bigger say with respect to development decisions (effectively regarding operative planning and project selection) through the Regional Development Councils (RDCs) and the more prominent role played by the RDCs in monitoring also had a similar effect.
Institutions and respective tasks
Many organisations were given a role in the implementation of territorial develop- ment tasks. Below we introduce first-level and second-level NUTS organisations.
National level administrational institu- tions (NUTS 1) were the following: Par- liament, Government and the responsi- ble ministries. The central management of territorial development was entrusted to 3 ministries. During the period under examination, the Ministry of National Economy was responsible for develop- ing territorial development concepts.
The Ministry of Interior was responsible for coordinating issues related to territo- rial development with local governments.
The National Development Ministry was responsible for harmonizing Hungarian development policy with EU development policy.
National professional and partner in- stitutions also played an important role in territorial policy during the period under examination. During the 2007-2013 fund- ing period, VÁTI Hungarian Regional Development and Urbanistic Ltd. (which ceased operations on 1 July 2014 with the successor being Széchenyi Programme Of- fice Consultancy and Services Non-Profit Limited Liability Company, which came under the direct supervision of the Prime Minister’s Office) managed the human infrastructure priorities of the 7 regional Operational programmes of the NHDP, the State Reform Operational programme and the Electronic Administration Opera- tional programme. Prior to its cessation, VÁTI became the principal professional background institution of territorial and development policy. Since 2012, the na- tional territorial development and spatial planning information system has been op- erated by Lechner Non-Profit Ltd12.
The National Development Agency (NDA) was established by Government Decree no. 130/2006. (VI. 15.) as a legal succes- sor to the National Development Office.
The Agency’s responsibilities in the 2007- 2013 period included the tasks of devel- opment and planning, the preparation of the plans and operational programmes necessary for the drawdown of EU funds and the formulation of the institutional framework necessary for the funds thus received. Pursuant to Government Decree no. 475/2013. (XII.17.) the NDA ceased,
with the Prime Minister’s Office becoming its general legal successor (SAO, 2015).
The National Spatial Development Coun- cil was created by means of Act XXI of 1996 on Territorial Development and Spatial Planning. The high-level interest reconciliation council participated in the tasks of governance and in the formula- tion of territorial development policy. Its tasks also included ensuring consultation between sectors and regions. The council eventually ceased operations on 31 De- cember 2013 and the National Territorial Development Interest Reconciliation Forum was created, as of 1 January 2014, pursu- ant to the amending decree13.
At the NUTS 2 level Spatial Development Councils and Regional Development Coun- cils were given a role in the hierarchy of territorial development. Spatial Develop- ment Councils14 were set up, if the tasks in question crossed into another county or another region. In the period under examination 8 spatial councils were in op- eration, of which two is mentioned in ex- act terms in the act: the Balaton Develop- ment Council and the Tokay Wine Region Development Council. These Councils directly received funds from the National Development Ministry.
The role of the Regional Development Councils was to compile the given region’s development concept and regional opera- tional programme, as well as all related activities, such as site appraisal, division and allocation of the resources available for spending on the respective measures, coordination, as well as the preparation of financial plans. Pursuant to the December 2011 amendment of the act on territorial development, the councils ceased and, as of 1 January 2012, the respective tasks were taken over by county governments
(Gálosi-Kovács and Haffner, 2017). From 1 January 2012, the regional development agencies were taken into state ownership, and then from 2014 onwards, into the ownership of county governments.
Based on the above, a multi-layered and hierarchic, but, as far as the distribution funds is concerned, a uniform and cen- tralized institutional framework emerges, as a consequences of significant changes compared to the earlier structures: a radi- cal reduction in the number of Intermedi- ate Bodies (IBs), the reorganisation of the division of tasks, the standardisation of the procedural rules and the introduction and application of new procedures (Job- bágy, 2015). These changes diverted a sig- nificant amount of energy away from con- ceptually harmonized development and interest representation focussed on pro- fessional considerations. “A certain part of the substantial modifications impacting the organisational framework was in line with, while others fell short of respective expectations. The radical reduction of the number of IBs and the redistribution of tasks between MAs and IBs significantly improved implementation efficiency. The concentration of IBs under the NDA also had certain advantages, however this did not improve coordination activities or the level of coordination. The IBs acted with extreme autonomy from the very begin- ning, co-operation between the IBs and the OPs was of a very moderate level and the competent organisational units of the NDA (President’s Office, coordination IB) did not adequately fulfil their expect- ed role of coordination. The involvement of the ministries, as the depositaries of the respective policies, in operative plan- ning and implementation was suboptimal, which resulted in the inadequate repre-
sentation of professional considerations in both phases” (Jobbágy, 2015, p. 132).
Tools of the development policy institutional framework
The tools of development policy manage- ment can be broken down into planning and implementation elements. The man- agement tools employed were, in overall terms, characterized in the period under examination by a well-thought-out bal- ance and an intent to look for interven- tion opportunities and achieve standardi- sation (Molnár, 2006). The methodology includes elements like impact studies, the preparation of analyses, the processing of trends and data, the formulation of a tar- get hierarchy, the definition of priorities, the involvement of stakeholders and the preparation of financial tables. Planning was also supported by a line of monitor- ing benchmarks and indicators. The plans ran through all levels of development policy, from political decision-making to actual projects, naturally, with the intent of retaining the consistency and hierar- chic structure of the plans. (Hamarné et al., 2006). Planning methodologies were to a significant extent similar to the com- plex project management methodologies of large corporations (Sági, 2007; 2018).
Their application gave support to the people involved in planning in terms of making prudent and detailed analyses and producing detailed plans.
The tools of implementation were formulated in line with the dimension of control. The system of rules simultane- ously included limits and opportunities.
Monitoring and control were important elements of implementation, in the form of separate (independent) organisations
and public databases, as in line with the respective procedural rules (Monitoring Committees, EMIR, OTMR), with some included within the processes and others being of an ex-post character (Hamarné et al., 2006).
Reference points and comparisons – practices and results in countries of the Visegrád Co-operation in the field of territorial development The V4 countries embarked on the period examined in this study from similar initial positions, but with different specific char- acteristics, and they have likewise followed different trajectories during this period.
The similarities included the heritage of their socialist past with respect to their economic structures, as well as the timing, characteristics, conditions and speed of their rapprochement towards the EU. Dif- ferences, on the other hand, resulted from the varying characteristics and different lev- els of economic development of the differ- ent countries (Losoncz, 2017).
The main motifs of territorial develop- ment are very similar in the case of all 4 countries: from a conceptual aspect they can be regarded as resource-centred. Re- sources became available in the form of EU funds, consequently all V4 countries imple- mented resource-driven (top-down) territo- rial development. The guiding principles, objectives, priorities, as well as planning and tendering methodologies are all in tune with this. However, the results are different, as are the development trajectories: “Po- land and Slovakia achieved better results;
in Hungary and the Czechia there was no real increase in the level of development”
(Bajusz, 2015). Competitiveness however, could not be improved, in material terms,
in any of the V4 countries (Hetényi, 2014).
This is true despite the fact that “according to the model calculations of the European Commission, the investments implemented from EU resources, as part of the 2007-2015 cohesion and rural development policy, in- creased GDP in Hungary by 5 per cent, in Poland and the Czechia by 4 per cent and in Slovakia by 3.5 per cent, as compared to circumstances in which no such resources would have been made available” (Losoncz, 2017). In other words, territorial develop- ment resources significantly contributed to the prosperities of all of the countries dur- ing the financial year of 2008 and the period of the subsequent economic crisis. However, it is important to add that between 1995 and 2017, the basic economic trajectories of the countries and the EU resources, even if tak- en together, failed to result in the real term closing of the GDP gap between the 8 new Central and Eastern European EU member states and the former EU member states (Cieślik and Wciślik, 2020).
The (rule abiding) use of funds from the Structural and Cohesion Funds rep- resented a learning curve for the new EU member states. The rate of utilizing resources was far from consistent in the 2007-2013 period. In the first five years of the budgetary period, not even six mem- ber states reached the average EU absorp- tion rate (35.6%), and even up until 2015, six new member states were still below the average EU rate (90.3%) (Incaltarau et al., 2020). Taking the n+2 rule into account, ac- cording to the data of the European Com- mission the absorption rates of 8 member states, including 4 new member states (Bul- garia, Slovakia, Romania and Croatia), fell below (98.29%) the average for the EU 28 member states. Although there were a number of instances of overspending in
Hungary, i.e. out-payments exceeded the appropriation available (Boldizsár et al., 2016), according to the data of the Europe- an Commission the final absorption rate of the multiannual financial framework even- tually fell below 100 percent (99.64%).15
Incaltarau and co-authors (2020) ana- lysed the factors impacting the absorption rate of EU member states using an econo- metric model. Their findings show that in- creasing government efficiency and cutting back on corruption has a positive effect on the absorption rate. Although this impact is valid for both old and new member states, the impact is more significant for new member states. According to the standpoint of the au- thors, this implies that numerous factors hin- dering the efficient spending of public funds could still be identified in the new member states during the period under examina- tion (e.g. irregularities surrounding public procurement, election campaign spending, exploiting of political advantages, etc.) How- ever, one of the surprising findings of the model was that, in a manner contradictory to the EU’s objectives, political decentralisation is not a significant causal factor, i.e. assuming that all other factors are constant, decentral- ized and centralized countries use EU re- sources with the same level of efficiency.
Nyikos (2012, p. 7) also came to a simi- lar conclusion based on her findings, in that
“there is no practical experience to suggest that there is a direct relationship between the level of decentralisation and the qual- ity of governance. There is no rule, as to whether the governance and administra- tional regimes of decentralized or central- ized states are of a higher quality”. These results are all the more surprising since, ac- cording to a theoretical approach, one of the major features of cohesion policy is a decentralized implementation system, ow- ing to the fact that implementation is car- ried out at territorial and local levels. The effectiveness of regional policy depends, to a significant degree, on the effectiveness of the governing and managing organisations (Sági and Engelberth, 2018).
With respect to the use of cohesion funds, the governments of the V4 Countries laid down the objective of maximizing the absorption rate during the period under ex- amination. This is also made evident by the fact that transport, energy and environment related projects accounted for approxi- mately half of the funds used (Boldizsár et al., 2016). The acquisition costs of these in- vestments (e.g. road and rail development, water treatment equipment, waste related infrastructure, etc.) is typically high, but the investments only contribute to the develop- ment of a country’s innovations environ- ment in a negligible extent.
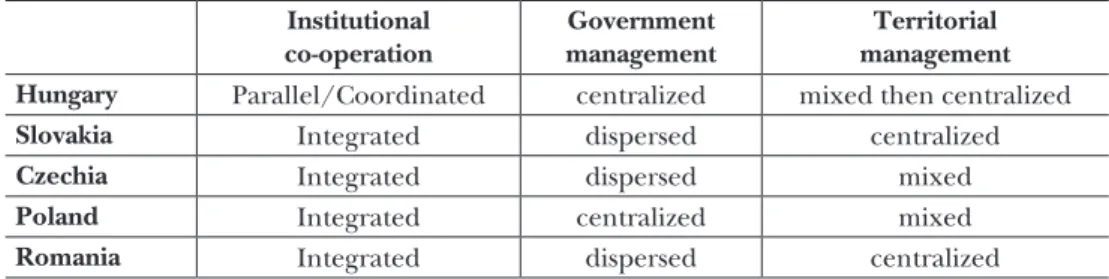
Table 7: Comparison of the V4 countries according to institutional framework, 2007-2013 Institutional
co-operation
Government management
Territorial management Hungary Parallel/Coordinated centralized mixed then centralized
Slovakia Integrated dispersed centralized
Czechia Integrated dispersed mixed
Poland Integrated centralized mixed
Romania Integrated dispersed centralized
Source: Nyikos, 2013, p. 48-49
Regional territorial co-operation between V4 countries and cross-border projects
Strategic territorial development related co-operation between the V4 and also be- tween the V4+2 (including Romania and Bulgaria) intensified during the period un- der examination. The participants of the cooperation agreed to collaborate in the interest of developing the identified short- comings of the ties between the participat- ing countries along a common strategy, which, in the long term, may be the key to the strengthening of the territorial and ge- opolitical weight of the V4. The respective plans are characterised by transport corri- dors and cross-border energy infrastructure investments. The origins of the co-opera- tion date back to 2007, when the V4 made a joint stand, in opposition to the countries of the Mediterranean region, in the inter- est of securing resources promoting the closing of the gap (Bajusz, 2015). The Com- mon Territorial Development Strategy was finalized in 2010, which identified, with the involvement of the V4+2 countries, the axes broken by country borders and the critical paths (Jusztin and Guti, 2014).
It is important to note that the cross-bor- der territorial development projects also funded by the EU by means of independent programmes (INTERREG, ESPON, UR- BACT, INTERACT) constitute a subplot of Hungarian territorial development efforts not without historical roots, which are pri- marily intended to strengthen territorial in- tegration within the EU (Pupek, 2008). Co- operation between nations, the direct and metaphoric dismantling of borders and the strengthening of economic ties with the Carpathian Basin also have a local signifi- cance, as a result of the Government’s mi- nority policy. Observed from a Hungarian
aspect, the pragmatic, idealist EU funds intended to strengthen federalism provide funds for supporting the everyday lives of Hungarian minorities living in the severed territories, for advancing the underdevel- oped infrastructure, for increasing region- al competitiveness and for strengthening the identities of Hungarians living abroad (Hungary–Slovakia Cross-Border Co-opera- tion Operational programme 2007–2013).
Summary and conclusions
Based on the findings of this research it can be concluded that the period between 2010 and 2014 may primarily be consid- ered as a period of change in territorial de- velopment. The period is characterised by a multi-layered structure, a diverse system of objectives, numerous actors (stakehold- ers), the restructuring of the institutional framework, a flood of programmes and na- tional economic plans, as well as the princi- pal guideline typical of the period relating to the intent that available resources must under all conditions be spent (Faragó, 2011).
According to the professional literature relating to the period under examination, it cannot be considered as the most suc- cessful period, despite the fact that it was in this period that Hungary became eligi- ble for the highest amount of EU develop- ment funds. The use of EU resources did not produce the expected improvements, as far as the major goals, such as growth, gap reduction and complex regional de- velopment are concerned (SAO, 2016). At the same time, however, based on medium term appraisal, a positive evaluation may be produced based on the same target func- tions and results and the major objectives and aspects determined:
(1) In the 2007–2013 EU programming cycle impacting the governmental period, as- sistance in the record amount of 8 thousand billion HUF was available to Hungarian for- profit and non-profit actors, primarily from EU and, to a lesser extent, from domestic sources (NHDP 2007). By the end of 2013 re- source drawdown rate reached 115 per cent, which made Hungary the third most success- ful amongst EU nations (KPMG, 2017).
(2) If we expand the focus of investiga- tion to the 2014–2020 period, we can ob- serve a fast rate growth in the economic performance of Hungary. On the one hand, the primary goal of the NHDP relating to
“the expansion of employment and the establishment of conditions for long-term growth” was attained (NHDP, 2007), since the rate of unemployment fell in 2019 to a record low of 3.4 per cent, while employ- ment grew to 70.2 per cent, a level not seen since the systemic change. In the mean- time, real GDP also grew in a continuous manner. This development curve cannot be exclusively accredited to the economic growth following the 2007–2008 global fi- nancial crisis and the Eurozone crisis char- acterising the first years of the 2010s. The more efficient drawdown of EU resources, the significant volume of foreign direct in- vestment (FDI) and the repercussions of these factors also played a significant role.
Naturally, the scope of the study does not allow for the exact econometric meas-
urement of the rate of contribution to growth of the different impacts, however, their analysis produces a clear picture of the optimisation of the use of EU resources.
Criticism may be valid with respect to the fact that although the domestic institutional framework speeded up the use of resources, it downgraded professional considerations.
At the same time, the resource absorption compulsion resulted, in many instances, in a local (sub-) optimum of resource spend- ing, as opposed to a complex territorial/
regional optimum. This is indicated by the circumstances that the funds used did not contribute, in significant terms, to cohe- sion within the country (see Table 8, for example), the that differences between the network of cities and the revenues thereof remained unmodified in the period under examination with only minor reallocations being detectable (Rechnitzer et al., 2014) and that the economic growth of the differ- ent counties was primarily determined by FDI (Lengyel and Varga, 2018).
Differences in revenues are therefore unmodified within the network of settle- ments over the long-run, which is also true for the entire spatial structure, and these may, in turn, augment socio-political ten- sions on a regional level in the future (Sági, 2019). In terms of revenues, differences between the territories have fundamentally returned to the levels characteristic of the pre-crisis period or, as far as the period ex-
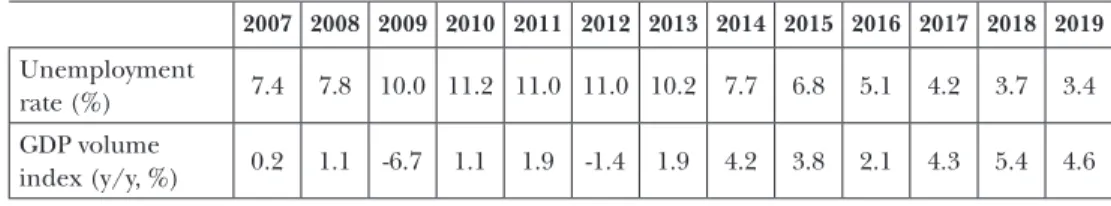
Table 8: The dynamics of unemployment compared to GDP, 2007-2019
2007 2008 2009 2010 2011 2012 2013 2014 2015 2016 2017 2018 2019 Unemployment
rate (%) 7.4 7.8 10.0 11.2 11.0 11.0 10.2 7.7 6.8 5.1 4.2 3.7 3.4 GDP volume
index (y/y, %) 0.2 1.1 -6.7 1.1 1.9 -1.4 1.9 4.2 3.8 2.1 4.3 5.4 4.6 Source: Compiled by the authors based on KSH
Table 9: Spatial differences based on GDP, 2007–2018
(GDP per capita as a percentage of the national average)
Description 2007 2013 2018
Capital City of Bu-
dapest 214.7 210.9 203.6
Richest county Győr-Moson-
Sopron 119.0 Győr-Moson-
Sopron 120.8 Győr-Moson-
Sopron 121.8
Poorest county Nógrád 44.4 Nógrád 43.8 Nógrád 44.5
Average of the three richest counties
1. Győr- Moson- Sopron 2. Komárom-
Esztergom 3. Fejér
107.5
1. Győr-Moson- Sopron 2. Komárom-
Esztergom 3. Vas
106.7
1. Győr-Moson- Sopron 2. Fejér 3. Komárom-
Esztergom
107.8
Average of the three poorest counties
1. Nógrád 2. Szabolcs-
Szatmár- Bereg 3. Békés
52.2
1. Nógrád 2. Szabolcs-
Szatmár- Bereg 3. Békés
53.0
1. Nógrád 2. Szabolcs-
Szatmár- Bereg 3. Békés
53.6
Ratio of the average of the three rich- est counties to the average of the three poorest counties
2.06 2.01 2.0
Ratio of the Capital City of Budapest to the average of the three richest coun- ties
1.80 1.75 1.7
Ratio of the Capital City of Budapest to the average of the three poorest coun- ties
4.84 4.82 4.6
Source: Compiled by the authors based on CSO data
amined in this study is concerned, those characteristic of the starting point of the budgetary cycle planning period.
In terms of the spatial changes in reve- nues therefore, a structure practically iden- tical to that of the past has evolved, i.e. EU funds on the one hand contributed to the correction of negative trend swings, while on the other hand they failed to support
closing the gap between territories or to result in an upswing in revenue conditions.
Notes
1 Aron Szennay has written his contribution to this article with the support from the Office for Research Groups Attached to Universities and Other Institutions of the Eötvös Loránd Research Network, through funding provided
to the MTA-BGE Macroeconomic Sustainability Research Group. The author is a member of the research group.
2 Poland, Czechia, Hungary, Slovakia; hereinafter referred to as V4 or Visegrád Countries
3 Multiannual financial framework (MFF) and EU budget will hereinafter be used in the study as synonym expressions.
4 www.europarl.europa.eu/external/html/euen- largement/default_hu.htm
5 https://eur-lex.europa.eu/summary/glossary/
structural_cohesion_fund.html?locale=hu
6 www.palyazat.gov.hu/kohezios_politika_celkitu- zesei
7 www.palyazat.gov.hu/az-j-magyarorszg-vidkfe- jlesztsi-program-2007-2013-utlagos-ex-post-rt- kelse
8 www.innovacio.hu/download/allasfoglalas/
2011_12_28_mnt_konzultacios_anyag.pdf
9 The plans were predominantly named after prominent figures of the dual Austro-Hungarian Empire. Names of certain prominent figures from the Reform Era, from the period between the 1848-49 freedom struggle and the Austro- Hungarian compromise and from the period between 1920 and 1944 were also used.
10 National Development and Regional Develop- ment Concept 1/2014. (I. 3.). annex to the par- liamentary resolution
11 http://2010-2014.kormany.hu/download/4/
d1/20000/Sz%C3%A9ll%20K%C3%A1lm%
C3%A1n%20Terv.pdf
12 www.terport.hu
13 www.terport.hu
14 Pursuant to Article 15 (1) of Act XXI of 1996 (ATDSP) the 8 spatial development councils are: 1. Danube-Tisza Interfluve Homokhátság Spatial Development Council, 2. Danube Bend SDC, 3. “Highway 8” SDC, 4. “M9” SDC, 5. Lake Velence Region – Vál Valley – Vértes Highlighted SDC, 6. Lake Tisza SDC, 7. Sziget- köz – Upper Danube SDC, 8. Balaton DC, + Tokaj Wine Region DC (created in 2014). All of these development councils are still in op- eration today.
15 https://cohesiondata.ec.europa.eu/2007-2013/
Total-Percentage-of-Available-Funds-Paid-Out- by-th/w8x7-cq jd
References
Bajusz, A. (2015): Az uniós források jelentősége a visegrádi tagállamokban [Importance of EU funds in the Visegrád member states]. Köz-gaz- daság, Vol. 10, No. 4, 91–107.
Bálint, J. (2009): Vidékfejlesztés. Vidékfejlesztési me- nedzs ment és marketing [Rural development.
Rural development management and market- ing]. CopyCAT, Budapest.
Bodnár, D. and Hortobágyi, Á. (2007): Gondolatok az Új Magyarország Vidékfejlesztési Program keretében megvalósuló komplex vidékfejlesz- tési tervezésről [Thoughts on the complex rural development planning implemented within the framework of the New Hungary Rural Develop- ment Program]. A Falu, Vol. 12, No. 1, 5–12.
Boldizsár, A.; Kékesi, Zs.; Koroknai, P. and Sisak, B.
(2016): A magyarországi EU-transzferek áttekin- tése – két költségvetési időszak határán [Over- view of EU transfers in Hungary – on the border of two budget periods]. Hitelintézeti Szemle, Vol.
15, No. 2, 59–87.
Buday-Sántha, A. (2010): Környezetvédelem – kör- nyezetgazdálkodás [Environmental protection – environmental management]. Tér és Társa- da lom, Vol. 24, No. 3, 223–226, https://doi.
org/10.17649/TET.24.3.1833.
Cieślik, A. and Wciślik, D. R. (2020): Convergence among the CEE-8 Economies and Their Catch- Up Towards the EU-15. Structural Change and Economic Dynamics, Vol. 55, 39–48, https://doi.
org/10.1016/j.strueco.2020.07.006.
European Commission (2007): A kohéziós politika 2007–2013. Kommentárok és hivatalos szövegek, ERFA és Kohéziós Alap [Cohesion Policy 2007-2013.
Comments and official texts, ERDF and Cohesion Fund]. Directorate-General for Regional Policy, European Commission, Bruxelles, https://ec.
europa.eu/regional_policy/sources/docoffic/
official/regulation/pdf/2007/publications/
guide2007_hu.pdf (accessed 5 January 2020).
European Commission (2014): Regionális politika, Európai Bizottság Kommunikációs Főigazgatóság Polgárok tájékoztatása [Regional Policy, European Commission Directorate-General for Communi- cation Informing citizens]. Publications Office of the European Union, Bruxelles.
European Commission (2016): Ex Post Evaluation of Cohesion Policy Programmes 2007-2013, Focusing on the European Regional Development Fund (ERDF) and the Cohesion Fund (CF). Country Report Hun- gary. European Commission, https://ec.europa.
eu/regional_policy/sources/docgener/evalu- ation/pdf/expost2013/wp1_hu_report_en.pdf (accessed 12 March 2020).
Faragó, L. (2011): Stratégiai programozás 2014–
2020, magyar teendők [Strategic programming 2014-2020, Hungarian tasks]. Falu Város Régió, Vol. 18, No. 2, 53–57.
Faragó, L. (2016): Az EU területi politikájának vál- tozásai közép-kelet-európai nézőpontból [Spatial policy changes from a Central Eastern European perspective]. Tér és Társadalom, Vol. 30, No. 2, 3–22, https://doi.org/10.17649/TET.30.2.2765.
Gálosi-Kovács, B. and Haffner, T. (2016): A terület- fejlesztés magyarországi intézményesülése [The institutionalisation of regional development in Hungary]. Új Magyar Közigazgatás, Vol. 9, No. 2, 1–8.
Gálosi-Kovács, B. and Haffner, T. (2017): A területfe- jlesztés intézményrendszerének változása Ma gyar- országon [Changes in the institutional system of regional development in Hungary, regional development and innovation]. Területfejlesztés és Innováció, Vol. 11, No. 1, 22-33.
Gere, L.; Pecze, T. Cs. and Soproni, Gy. (2014):
2014–2020 közötti területi szempontú fejlesz- tések háttere, a Terület- és Településfejlesztési Operatív Program főbb üzenetei [Background of territorial developments between 2014-2020.
Main messages of Territorial and Settlement Development Operational Programme (TOP)].
Falu Város Régió, Vol. 20, No. 2, 23–31.
Guti, A. (2014): Elfogadták a miniszterek a visegrádi négyek, valamint Bulgária és Románia (V4+2) közös területfejlesztési stratégiáját [Ministers ap- prove joint Spatial Development Strategy of the Visegrád 4 and Bulgaria and Romania (V4 + 2)].
Falu Város Régió, Vol. 20, No. 2.
Győriné Szabó, G. (2014a): Az Európai Unió kohéziós forrásainak felhasználása – A szabá- lyozás és hatékonyság összefüggései [Using of European Union’s Cohesion Resources – In the Context of Ruling and Efficiency]. E-CONOM on- line, Vol. 3, No. 2, 19–31.
Győriné, Sz. G. (2014b): A kohéziós alapok ha- tékonyabb felhasználása [Conditions and chal- lenges of using the cohesion funds “a la” quality
spending]. Külügyi Szemle, Vol. 13, No. 4, 163–
180, https://doi.org/10.14267/phd.2017005.
Hamarné Szabó, M.; Szegvári, P. and Szűcs, M.
(2006): Közlekedéspolitika – területfejlesztés – ál- lamreform [Transport policy – territorial develop- ment – state reform]. MAÚT, Budapest.
Hetényi, G. (2014): Az EU-tagság 10 évének főbb gazdasági folyamatai a V4-országokban [The main economic processes of decade of EU mem- bership in the V4 countries]. Pro Publico Bono, Vol. 2, No. 2, 120–133.
Incaltarau, C.; Pascariu, G. C. and Surubaru, N.- C. (2020): Evaluating the Determinants of EU Funds Absorption across Old and New Member States – the Role of Administrative Capacity and Political Governance. Journal of Common Market Studies, Vol. 58, No. 4, 941–961, https://doi.
org/10.1111/jcms.12995.
Jobbágy, V. (2015): Az EU kohéziós politikájának meg- valósítása Magyarországon [Implementation of the EU cohesion policy in Hungary]. PhD dis- sertation, University of Pécs.
Jusztin, V. and Guti, A. (2014): A visegrádi országok, valamint Románia és Bulgária (V4+2) együttműködése a területi tervezésben [Co- operation of the Visegrád countries, as well as Romania and Bulgaria (V4 + 2) in spatial plan- ning]. Falu Város Régió, Vol. 20, No. 1, 74–83.
Kele, J. (2017): A 2007–13-as programozási időszak ex-post értékeléseinek megállapításai és hasznosulása [Findings and utilisation of EX-POST evalua- tions for the 2007-13 programming period]. 55.
Közgazdász-vándorgyűlés, Eger.
KPMG (2017): A magyarországi európai uniós for- rások felhasználásának és hatásainak elemzése a 2007–2013-as programozási időszak vonatkozásában [Analysis of the use and effects of EU funds in Hungary for the 2007-2013 programming pe- riod. Summary of macroeconomic analyzes].
KPMG, Budapest, http://adko.hu/01_files/
adotanulmanyok/2017/KPMG-eu-elemzes.pdf.
Lehmann, K. and Nyers, J. (2009): Az Európai Unió fejlesztési forrásainak felhasználása [Use of Eu- ropean Union development funds]. Statisztikai Szemle, Vol. 87, No. 2, 133–155.
Lengyel, I. and Varga, A. (2018): A magyar gaz- dasági növekedés térbeli korlátai – helyzetkép és alapvető dilemmák [Spatial limitations of Hun- garian economic growth – situation and basic di- lemmas]. Közgazdasági Szemle, Vol. 65, No. 5, 499–
524, https://doi.org/10.18414/KSZ.2018.5.499.