edited by L. Viktor Tóth
L. Viktor Tóth Sarolta Zahorecz
Csaba Kiss
Sarolta Zahorecz Csaba Kiss
lector: Attila Moór Póczos Valéria
Copyright © 2013 Eötvös Loránd University
This book is freely available for research and educational purposes. Reproduction in any form is prohibited without written permission of the owner.
Made in the project entitled "E-learning scientific content development in ELTE TTK" with number TÁMOP-4.1.2.A/1-11/1-2011-0073.
Consortium leader: Eötvös Loránd University, Consortium Members: ELTE Faculties of Science Student Foundation, ITStudy Hungary Ltd.
Preface - The Fox's Secret: ... vi
1. Introduction – the discovery and use of infrared ... 1
1.1 Herschel and his discovery of infrared ... 1
1.2 Black body radiation – the first experiments of infrared radiometry ... 2
1.3 The photosphere of the Sun as a black body and the Herschel experiment ... 5
1.4 The infrared radiation of the human body ... 6
1.5 The use of infrared ... 7
1.2.1 Aerial or space infrared photography ... 7
1.2.2 Thermograms of small and large objects ... 9
1.2.3 Medical infrared thermography (MIT) or thermology ... 10
1.2.4 Arts and infrared ... 11
References and further reading to the chapter: ... 13
2. History of infrared astronomy ... 15
2.1 The Two-Micron-Sky Survey (also IRC or Caltech 2.2 micron survey) ... 15
2.2 Other important early discoveries with ground based telescopes ... 16
2.3 Balloon-borne infrared observatories ... 17
2.3.1 Far-Infared Spectrometer (FIS): ... 17
2.3.1 PRONAOS ... 18
2.4 Rocket flights ... 19
2.5 COBE ... 20
2.5.1 FIRAS ... 20
2.5.2 DMR ... 21
2.5.3 DIRBE ... 22
2.6 Development of IR instrumentation ... 23
References and further reading to the chapter: ... 24
3. Definition of infrared and the origin of the infrared radiation ... 26
3.1 The definition of the infrared band ... 26
3.2 The origin of infrared radiation ... 29
3.2.1 Atomic transitions ... 30
3.2.2 Molecular transitions ... 31
3.3 Radiation of molecules ... 33
3.3.1 Molecular hydrogen ... 33
3.3.2 Ices and other molecules ... 33
3.4 Radiation of dust ... 34
3.4.1 Heating and cooling of dust ... 35
3.4.2 Refractory dust ... 36
3.4.3 Silicates ... 36
3.4.4 Large dust grains ... 38
3.4.5 Polycyclic Aromatic Hydrocarbons ... 38
References and further reading to the chapter: ... 39
4. Transmission, background noise ... 41
4.1 Atmospheric transmission ... 41
4.2 Background radiation ... 43
4.2.1 Terrestrial background radiation ... 44
4.2.2 Airglow ... 45
4.2.3 Zodiacal light ... 46
4.2.4 Galactic cirrus emission ... 47
4.3 Subtracting background and foreground emission ... 47
References and further reading to the chapter: ... 48
5. Infrared photometry ... 50
References and further reading to the chapter: ... 55
6. All-sky surveys ... 56
6.1 IRAS ... 56
6.1.1 The most important results of IRAS: ... 56
6.1.2 Instruments and observing strategy of IRAS ... 57
6.2 MSX ... 58
6.2.1 Infrared dark clouds ... 58
6.3 AKARI ... 59
6.4 WISE ... 61
6.5 Planck ... 62
References and further reading to the chapter: ... 64
7. Infrared satellite observatories ... 66
7.1 Infrared Space Observatory (ISO) ... 66
7.1.1 Scientific instruments and observing strategy ... 66
7.1.2 Most important results ... 67
7.2 Spitzer Space Telescope ... 69
7.2.1 Scientific instruments ... 70
7.2.1 Most important scientific results ... 71
7.3 Herschel Space Observatory ... 73
7.3.1 Scientific instruments ... 73
7.3.2 Most important scientific results ... 74
References and further reading to the chapter: ... 77
8. The interstellar medium in infrared ... 79
8.1 The interstellar medium ... 79
8.2 The ISM in infrared ... 81
8.1.1 Hot ISM ... 81
8.1.2 HII regions ... 81
8.1.3 HI clouds ... 82
8.1.4 Molecular clouds ... 82
8.1.4.1 Calculating temperature and column density maps from FIR data ... 85
8.1.5 The structure of cirrus ... 87
References and further reading to the chapter: ... 90
9. Young stellar objects ... 91
9.1 Molecular clouds ... 91
9.1 YSOs on the Hertzsprung-Russel diagram ... 93
9.2 Classification of YSOs ... 95
9.3 Determining physical properties of YSOs ... 97
9.4 Protoplanetary disks ... 97
9.4.1 Growth of dust particles ... 98
9.5 Detailed analysis of YSOs in practice ... 99
References and further reading to the chapter: ... 101
10. Extragalactic infrared astronomy ... 103
10.1 Nearby galaxies ... 103
10.2 Luminous and ultraluminous galaxies ... 106
10.3 Gamma-ray bursters (GRBs) ... 109
10.4 Dust at high redshifts ... 109
10.5 The Cosmic Infrared Background ... 111
References and further reading to the chapter: ... 113
11. The infrared confusion ... 116
11.1 Confusion noise ... 116
11.2 Confusion limit ... 116
11.3 Confusion noise in the observed flux densities ... 118
11.4 The infrared confusion noise ... 118
11.5 Estimating the components of the infrared confusion noise ... 120
11.5.1 Sources of FIR emission in the Solar System ... 120
11.5.2 Interstellar medium ... 123
11.5.3 The cosmic infrared background ... 125
11.6 An example: The Herschel Confusion Noise Estimator ... 126
11.6.1. Importance of a sky confusion noise estimator for the Herschel Space Telescope ... 126
11.6.2 General comments ... 127
11.6.3 Cosmic infrared background: ... 127
11.6.4 Galactic cirrus ... 127
11.6.5 Measurement configuration ... 127
References and further reading to the chapter: ... 128
12. Appendix: Hungarian infrared studies ... 130
12.1 Properties of dust in galactic interstellar clouds ... 130
12.2 Time variable dust emission in young stellar objects ... 130
12.3 Infrared emission and dust properties in eruptive young stellar objects ... 131
12.4 The outburst of V1647 Orionis ... 132
12.5 The outburst of EX Lupi ... 134
12.6 Properties of debris dust ... 137
12.7 Properties of cosmic dust in high-z galaxies ... 138
References and further reading to the chapter: ... 139
13. Animated images ... 140
13.1 Blackbody radiation - interactive ... 140
13.2 Orion Nebula multiwavelength ... 140
13.3 M51 galaxy observed with different telescopes ... 140
13.4 M51 galaxy multiwavelength ... 140
13.5 Anharmonic oscillator ... 140
13.6 Anthracene – interactive ... 140
13.7 Chopping-nodding observation ... 140
13.8 Galactic centre multiwavelength ... 140
13.9 Infrared dark cloud multiwavelength ... 141
13.10 Separation of AKARI point source types ... 141
13.11 Planck Space Observatory’s multiwavelength view of the sky – interactive ... 141
13.12 CMB by COBE, WMAP, and Planck – interactive ... 141
13.13 Barnard 68 dark cloud multiwavelength ... 141
13.14 ISM density and temperature from Herschel measurements ... 141
13.15 Young stellar object classes ... 141
13.16 Planet formation ... 141
13.17 Young stellar object properties – interactive ... 142
In the book of Antoine de Saint-Exupéry theLe Petit Princethe fox tells the little prince:Voici mon secret. Il est très simple: On ne voit bien qu'avec le cœur. L'essentiel est invisible pour les yeux. In English: 'And now here is my secret, a very simple secret: It is only with the heart that one can see rightly; what is essential is invisible to the eye' (translation by Katherine Woods 1943).
Figure 0.1:A fox as seen at night by an infrared camera with an infra-red flash at North Buckhead Atlanta, GA USA (Hinson 2009, http://www.nbca.org/Wildlife/New_Pictures.htm)
Humans at normal body temperature, radiate most strongly in the infrared, which is definitely not seen by human eyes. The scientific discovery that the heat we all feel coming from the Sun is largely a radiation beyond the visible red colour of the solar spectrum was made by William Herschel in 1800. He named the invisible radiation measured by his thermometers (see later the Herschel experiment) asinfrared. Infra- (Latin) is a prefix meaning “below”.
In other words the experiment in which infrared radiation was discovered was in fact an astronomical measurement.
Astronomers were active in the infrared detector developments in the early years as well as they are today.
Infrared astronomy was introduced in Hungary by Lajos G. Balázs in the 1980s when he started to analyze and interpret IRAS data at the Konkoly Observatory Budapest. By the 2010s Hungarian astronomers (including the authors) contributed to the work of the Herschel PACS Consortium and various research projects.
The goals of the authors were to help the reader understanding the basics of infrared radiation and observing techniques, to give a broad view of astronomical objects and processes that are observable in the infrared, and to provide some help in the use of publicly available archives of infrared observatories.
We are thankful for our lectors Péter Ábrahám, Csaba Kiss and Attila Moór for their corrections and suggestions.
Special thanks to Sarolta Zahorecz and Csaba Kiss for their contribution. We also ask all our readers to suggest how to further develop this e-book, and to send their contributions (text, figures, and animations) to be included.
Budapest, October 2013.
L.V. Tóth
Figure 0.2:The structure of cirrus as seen in far-infrared by the Herschel Space Telescope in the Vulpecula (Little Fox) constellation. Three colors composite image from blue=70µm, green=160µm, red=250µm. (ESA/PACS &
SPIRE Consortium, Sergio Molinari, Hi-GAL Project, http://oshi.esa.int/#detail=image.html?id=27)
and use of infrared
In this chapter we give the basic definitions and laws of radiometry and spectroscopy, and mention the milestones of the early history of experimental and observational infrared astronomy. The use of infrared techniques at various non-astronomical applications is also addressed.
1.1 Herschel and his discovery of infrared
"The life of Herschel had the rare advantage of forming an epoch in an extensive branch of as- tronomy."(Arago)
Sir Frederick William Herschel (Friedrich Wilhelm Herschel, 1738-1822) was born in Hanover, Germany, but immigrated to England in 1757 and became a respected musician in the town of Bath also as composer and director of the orchestra. He was the best telescope-maker of his time. With his sister Caroline they surveyed the sky that resulted in several catalogs and a model of our Galaxy or as he called it he mapped "The Construction of the Heavens". Herschel is perhaps most famous for his discovery of the planet Uranus in 1781, the first new planet found since antiquity.
In the year 1800, Herschel made an important experiment. He was curious to know the colour of light carrying the heat of the Sun. To his great surprise, his carefully positioned thermometers detected heat also where light separated into colours by the prism was lost in darkness beyond the red end of the visible spectrum. Initially he wanted to measure how much heat passed through the different colored filters he used observing the Sun. He noticed that filters of different colors pass different levels of heat. Herschel thought that the colors themselves might contain different levels of heat, so he devised an experiment to investigate his hypothesis.
Figure 1.1 The Herschel experiment. (Illustration by Vilmos Thernesz based on the original figure in Herschel, W., 1800: ”Experiments on the refrangibility of the invisible rays of the Sun” Phil. Trans. Roy. Soc. London 90, 284–292)
Herschel directed sunlight through a glass prism to create a spectrum - the ”rainbow” created when light is divided into its colors - and measured the temperature of each color. He used three thermometers with blackened bulbs (to
better absorb the heat) and placed one bulb in each color while the other two were placed beyond the spectrum as control samples. As he measured the temperatures of the violet, blue, green, yellow, orange and red light, he noticed that all of the colors had temperatures higher than the controls and that the temperature of the colors increased from the violet to the red part of the spectrum. Herschel placed a thermometer also beyond the red end of the visible spectrum meant to be a control to measure the ambient air temperature in the room. Surprisingly it showed a higher temperature than the ones at the visible spectrum. Herschel's concluded that there must be an invisible form of light beyond the visible spectrum that he called as "calorific rays" (the Latin wordcalormeans heat). The results were reported to the Royal Society:In this case, radiant heat will at least partly, if not chiefly, consist, if I may be permitted the expression, of invisible light; that is to say, of rays coming from the sun, that have such a momentum as to be unfit for vision(Herschel 1800).
Figure 1.2Spectral energy distribution for the Sun as observed by Herschel. We note that the peak is shifted to the IR because of the prism used (Herschel W., 1800: Experiments on the solar and on the terrestrial rays that occasion heat … (2d part). Philosophical Transactions of the Royal Society, 90, 437-538.)
A comparison of the radiant heat and light through the spectrum was also made by Herschel (1800b), and as shown in Figure 1.2 the calorific rays showed a maximum outside the visible range (G to Q). Herschel also tried to measure the total power received from the Sun. The solar constant (the total power received from the Sun per unit surface perpendicular to its direction at a distance of 1 A.U.) constant was first successfully measured by Claude Pouillet by his ‘pyrrhéliomètre’ instrument (Pouillet 1838).
1.2 Black body radiation – the first experiments of infrared radiometry
Historically the radiation properties of a heated body were known from experiments well before a comprehensive theory was made. Researchers of the late nineteenth century, like Wilhelm Wien (Nobel Prize laureate 1911) punched a small hole in the side of an otherwise completely closed oven, and began to measure the radiation coming out. The temperature of the oven, a platinum cylinder sheet within a ceramic tube, could be varied between -188 C and 1600C. That was their experimental black body.
Figure 1.3:Otto Lummer and Ferdinand Kurlbaum's black-body experiment from 1898: platinum cylinder sheet within a ceramic tube (Hoffmann, 2000, Physikalische Blätter Volume 56, Issue 12, p 43).
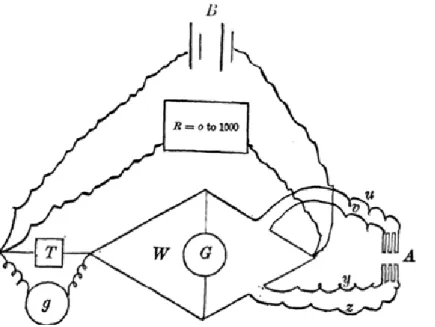
In the beginning the emitted infrared radiation was measured by bolometers. The bolometer used was developed based on a similar device by the American astronomer Samuel Pierpont Langley, consisted of two platinum strips covered with lampblack. One strip was shielded from radiation and one exposed to it. The strips formed two branches of a Wheatstone bridge which was fitted with a sensitive galvanometer and connected to a battery as seen in Langley’s drawing of the circuit diagram in Figure 1.4. Electromagnetic radiation falling on the exposed strip (at “A”) would heat it and change its resistance. The bolometer was enclosed into a cylindrical holder made of non-conducting material. It had the capability to detect radiation from a cow standing 400 meters away, and was sensitive to differences in temperature of 0.001K (Langley 1881). A basic bolometer circuit diagram and explanation can be found also e.g. at http://electriciantraining.tpub.com/14193/css/14193_106.htm
Figure 1.4:Circuit diagram of Langley’s bolometer. The bolometer “A” was connected to the Wheatstone bridge by the insulated copper wires “u, v, y, z”. (Figure 3 in Langley, S.P., 1881, Proceedings of the American Academy of Arts and Sciences, Vol. 16, p. 342 http://www.jstor.org/stable/25138616).
The name bolo-meter is formed from the Greek word “βολή” [bolo] that means shot. This instrument enabled Langley to discover new atomic and molecular absorption lines in the invisible infrared portion of the electromag- netic spectrum. But he also interpreted his measurements as a demonstration that “heat” and “light” from the Sun is just different names of the same physical phenomena.
The Wien’s Displacement Law was observed as theνfrequency at which the emitted radiation was most intense was directly proportional to theTabsolute temperature of the radiating body. The wavelength of the electromag- netic radiation is related to the frequency with the following equation:
(1.1) where c is the speed of the electromagnetic radiation in m/s, ν is the frequency in hertz (Hz) and λ is the wavelength in meter. That means:
(1.2) whereλmaxis the wavelength of the peak of the emission of a black body and the b constant of proportionality is called as Wien's displacement constant, b = 2.8977685(51)×10−3mK. Stefan’s Law or Stefan-Boltzmann law (1879) was also recorded from experiments i.e. that the total power P radiated from one square meter of black surface at temperature T goes as the fourth power of the absolute temperature:
(1.3)
The Stefan’s constant is Js-1m-2K-4where kBis the Boltzmann constant (1.38×10⁻²³ J/K), h is the Planck constant (6.626×10⁻³⁴Js), and c is the speed of light (299,792,458 m/s). The observational evidences provided at the University of Berlin, by Wien and Lummer at the last years of the 19thcentury lead to the theories of the spectral energy distribution functions, one of which was the Planck law of black body radiation.
Black-body radiation (also called as "cavity radiation") is the type of electromagnetic radiation within or surrounding a body in thermodynamic equilibrium with its environment, or emitted by a black body (an opaque and non-reflective body) held at constant, uniform temperature. The radiation has a specific spectrum and intensity that depends only on the temperature of the body. A blackbody is a theoretical perfect absorber and emitter. It absorbs radiation of all wavelengths falling on it and radiates electromagnetic energy at all frequencies. The power emitted by a blackbody from a unit area to a unit solid angle in a spectral interval, i.e. the specific intensity (see also chapter 5) of the blackbody radiation is given by the Planck’s law that can be written in 2 forms:
(1.4) [Wm-2Hz-1sterad-1]
(1.5) [Wm-2µm-1sterad-1]
where T is the temperature of the object, Figure 3.3 shows Planck’s law for different temperatures. Planck used the (1.5) form in his paper (Planck 1900).
Figure 1.5 a: The Planck law by Planck, M., 1900, Zur Theorie der Gesetzes der Energieverteilung im Normal- Spektrum, Verhandlungen der Deutschen Physikalisches Gesellschaft Nr. 17, p. 237).
Figure 1.5: Planck's law for different temperatures: The peak of the spectra shifts to shorter wavelengths for higher temperatures, and the area under the curve grows rapidly with increasing temperature.
(http://upload.wikimedia.org/wikipedia/commons/thumb/a/a2/Wiens_law.svg/300px-Wiens_law.svg.png)
Human eye sees the blackbody colors at temperatures around 5000-7000 K as nearly white. An interactive animation was made by the PhET Development Team at University of Colorado helping us to understand the properties of the Planck function. Try to decrease the temperature below 3000K then further down to 300K while zooming in by the (+) button at the intensity axis, and zooming out using the (-) button below the wavelength axis! The an- imation is available at: http://phet.colorado.edu/sims/blackbody-spectrum/blackbody-spectrum_en.html
1.3 The photosphere of the Sun as a black body and the Herschel experiment
The photosphere of the Sun is not a precise blackbody, but its radiation may be approximated with that of a Teff=5780 K (Teffis the effective surface temperature outside sunspots). In Figure we show a standard called “CIE D65” (see eg. http://cvision.ucsd.edu/cie.htm ,`daylight' normalized to the solar flux at 560 nm) together with the solar spectrum. As it is well seen the spectral energy distribution outside the terrestrial atmosphere peaks are at around 400-500nm, and that we consider blue. Due to atmospheric scatter we see the energy peak of the solar spectrum at around 600nm, but that is definitely not in the infrared. So why did Herschel observe the highest reading in the infrared?
Figure 1.6: The spectrum of the Sun as seen from above the Earth's atmosphere, together with the spectrum of a blackbody at 5780 K with the same total flux as the Sun, and the spectrum of CIE D65 `daylight' normalized to the solar flux at 560 nm. The Sun's spectrum was taken from R. L. Kurucz, I. Furenlid, J. Brault & L. Testerman (1984) Solar Flux Atlas from 296 to 1300 nm. (http://casa.colorado.edu/~ajsh/colour/Tspectrum.html)
In Herschel’s experiment, sunlight was refracted by a glass prism that is now on display at the National Museum
o f S c i e n c e a n d I n d u s t r y i n L o n d o n , E n g l a n d .
(http://www.sciencemuseum.org.uk/on-line/treasure/objects/1876-565.asp). The index of refraction (or refractive index)nof the glass varies non-linearly with wavelength (dispersion, see Figure) and the sunlight is dispersed into its various colors. In fact the dispersed wavelengths were not uniformly spaced along Herschel’s measuring table, there was a concentration toward the infrared, and that made the observed ”temperature” increasing toward longer wavelengths. See also Chester, 1999.
Figure 1.7: Plot of refractive index vs. wavelength of various glasses - dispersion. The wavelengths in the red- shaded portion correspond to the visible spectrum. (By Bob Mellish
http://en.wikipedia.org/wiki/File:Dispersion-curve.png)
1.4 The infrared radiation of the human body
Using late 19 century laboratory physics, and recent biophysics we may find out why the human body radiates most at a wavelength of about 10µm. The specific intensity of the human skin can be approximated with that of a modified black body.
(1.6) The ε(λ) emissivity of human skin in the wavelength range of 1µm< λ <14µm is nearly unity, ε(λ)=0.98±0.01 (Hobbie and Roth 2007). We may actually say it radiates like a black body. The Wien’s displacement law may be used to find out in which wavelength range it radiates most. Assuming a skin temperature of 300 K < T < 310 K we arrive to 9.3µm < λmax(T ) < 9.7µm. The total surface area of the human body can be approximated by the depth-weight formula as
(1.7) where w is the weight in kg and H is the depth in cm (Du Bois and Du Bois 1916). The total surface area for a typical adult male is Area ~ 1.73m2. The total radiated power at a skin temperature of T = 306 K may be calculated from Stefan’s law as:
(1.8) Although only a 5/7 fraction of the total skin surface is considered as effective radiator, the uncovered skin is a bright infrared source. We shine bright in the infrared while the human eye detects only 1% of the light at 0.69 µm, and 0.01% at 0.75 µm, and so we effectively cannot see wavelengths longer than about 0.75 µm.
It is not only the radiation of the human body that we can not see by our eyes. In space, there are many regions which are hidden from optical telescopes because they are embedded in dense regions of gas and dust. However, infrared radiation, having wavelengths which are much longer than visible light, can pass through dusty regions of space without being scattered. This means that we can study objects hidden by gas and dust in the infrared, which we cannot see in visible light, such as the center of our galaxy and regions of newly forming stars.
1.5 The use of infrared
Astronomical measurements require high angular resolution and sensitivity, and a very low noise level. That put constraints on optics, detector techniques and electronics, and triggers continuous advances in the technology. We may see then benefits in a wide range of non-astronomical applications. The first advanced application of IR technology in the civil section may have been a device to detect the presence of icebergs from steamships using a mirror and thermopile, patented in 1913, just after the catastrophe of the Titanic. Today, infrared technology has many exciting and useful applications. While in the field of infrared astronomy, new and fascinating discoveries are being made about the Universe, satellites with infrared imaging capabilities are also used to monitor the Earth’s weather, to study vegetation patterns, and geology and “measure” ocean temperatures. Since the 1960s infrared radiometers are used in meteorology measuring at wavelengths up to 35µm to derive surface and cloud temperatures (see eg. : Combs et al. 1965).
1.2.1 Aerial or space infrared photography
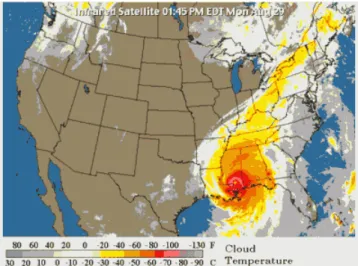
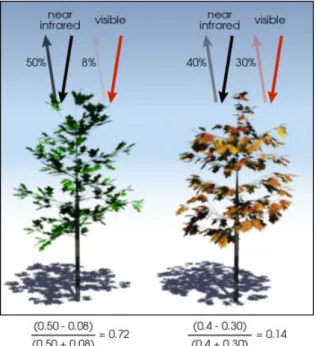
Besides mapping cloud covers and other meteorological applications (see Figure 1.8), aerial or space infrared photography is used in yield predictions in farming as well as detecting diseases, insect infestation and other problems in plants. Plants reflect near-infrared light, however when they are under stress less infrared radiation is reflected, a stressed plant will be much darker in the near-infrared than one that is functioning normally and healthily (see Fig. 1.9). The same technique may reveal algae at shores, and contamination of waters by chemical or biological waste.
Figure 1.8: Temperatures of Hurricane Katrina in 28 August 2005 from GOES infrared satellite data (http://911review.org/Hurricane_Katrina/HURRICANEKATRINA.html)
Figure 1.9:Healthy vegetation (left) absorbs most of the visible light, and reflects about the half of the near-infrared light. Unhealthy vegetation (right) reflects relatively more visible light and less NIR light. Normalized Difference Vegetation Index (NDVI) is calculated from the visible and near-infrared light reflected by vegetation.
Real measured values are given as an example below the picture. (Robert Simmon, http://earthobservatory.nasa.gov/Features/MeasuringVegetation/measuring_vegetation_2.php)
Differences in infrared colors may help to identify wild animals hidden in the vegetation, but as well as military installations camouflaged with dead foliage covers. One of the military’s primary uses of infrared is for target ac- quisition that works both in daylight and in complete darkness, to track jet engines as well as persons in smog or fog, an advantage that helps also rescue activities in fire fighting. Infrared cameras are also installed on cars to an early detection of objects, animals, and people on the road in front of the vehicle (see Figure 1.10).
Figure 1.10: On board infrared camera detects a person on the road and an image processing and evaluation system warns the car driver on a night vision screen, see also a video:
http://m.audi-technology-portal.com/var/site/storage/original/video/d4e5036f1624c6c3f5195fd7bd6b0547.mp4
1.2.2 Thermograms of small and large objects
Infrared imaging is used in testing electronic systems. Infrared thermography allows an evaluation of the level of warming of printed circuit boards as well as high voltage systems. This enables the early identification of defective components (such as loose connections, overloaded or imbalanced circuits, damaged switches, faulty fuses) helping to avoid costly downtimes and eliminates safety hazards (see Figure 1.11).
Figure 1.11: Thermogram of an industrial electrical fuse block with a fault (bright yellow area) http://en.wikipedia.org/wiki/File:Electrical_fault.jpg
Infrared video and still cameras are used to map surface heat variations allowing energy auditors to check the ef- fectiveness of insulation in a building's construction. Thermograms help auditors determine whether a building needs insulation and where in the building it should go. Because wet insulation conducts heat faster than dry insu- lation, thermographic scans of roofs can often detect roof leaks. Three kinds of devices may be used: a spot ra- diometer to measure radiation from one spot at a time, a thermal line scanner shows radiant temperature viewed along a line, or a thermal imaging camera, which produces a 2-dimensional thermal picture. In all cases the inspector notes the differences in temperature to detect heat loss, from which the 2D thermal imaging is the easiest to interpret also by non-experts.
Figure 1.12: Thermography – or infrared scanning – in use to detect thermal defects and air leakage in building envelopes.http://energy.gov/energysaver/articles/thermographic-inspections
Infrared cameras are used in crime prevention and security purposes, these allow a homeowner or police officer to record a crime in progress without the perpetrator ever knowing that the camera existed. Modern CCTV cameras now have a ring of infrared LEDs built in to help illuminate the scene at night, a very useful installation for surveil- lance purposes. Article 8 of the European Convention on Human Rights provides that "everyone has the right to respect for his private and family life, his home and his correspondence". There is a debate if the police may freely use that technology to look also inside homes without being intrusive. Forensics investigators use infrared photo- graphy to see hidden details in a crime scene, and can pick up traces of soil, drops of water or biological waste such as urine, blood and sperm which may be otherwise invisible to the naked eye. Infrared photography can register the difference in temperature between an object and its environment.
1.2.3 Medical infrared thermography (MIT) or thermology
Thermology also called as medical infrared imaging or tele-thermology utilizes high resolution thermographic pictures of the skin surface. It is a non-contact way of examination and there is no energy imparted into the body.
As we discussed in the first chapter, the human body is a strong infrared emitter. MIT provides a visual map of the skin temperature distribution but cannot quantify absolute temperature values. It is used in orthopedics, derma-
tology, breast cancer research, surgery, and other areas. One of the beneficial application of MIT is the screening of sportsmen for overuse injuries (see eg. Hildebrandt et al., 2012).
Figure 1.13: Electromagnetic radiation is used at various areas of human medicine on of which is measuring the skin surface temperature
The medical use of infrared also includes healing by so called medical heat lamps, where a part of the body is heated up using infrared radiation. (Hildebrandt et al. 2012)
1.2.4 Arts and infrared
Famous paintings were often modified before the final version was painted. Under drawings or outlines drawn by the artist may be traced. Art historians and conservators can use infrared photography to see beneath a painting’s surface and view detail that would otherwise remain forever unseen. This non-invasive examination is also helpful validating that works of art are authentic. It also revealed details of the making of a painting of French impressionist artist Pierre-Auguste Renoir.Luncheon of the Boating Partywas several times modified before the final version was painted, and that can be traced by seeing “all brush strokes” by infrared imaging (http://en.wikipedia.org/wiki/Luncheon_of_the_Boating_Party). Paints which are reflective in the visible spectrum are in many cases transparent beyond 1µm (near-infrared, see later). A commercial InGaAs (Indium Gallium Ar- senide) near infrared camera can "see" through the paint, and images the "underdrawing" (see Figure 1.10 and reports on the examination: Greenwood (1998)).
Figure 1.14: Underdrawing image taken with Goodrich ISR-P's SU320M-1.7RT camera.
(http://www.sensorsinc.com/img/overview/renoir_camera.jpg)
Infrared films capture light in the part of the spectrum which we can’t see with the naked eye, these renditions apply when infrared absorption and reflection are involved, photography can capture this invisible light. The first known infrared photographs were produced by Robert Williams Wood using sensitized photographic plates and very long exposures (published in the Royal Photographic Society’s October 1910 Photographic Journal).
Kodak developed emulsions that were sensitive to infrared light, and infrared films became commercially available in the 1930s, also including a 35 mm false-color infrared film from 1960s. Infrared sensitive photographic plates (see Figure 1.15) were also used in astronomy for several decades, but since the demand decreased Kodak discon- tinued the production. When using black and white infrared film the first and most important thing to remember is to use a suitable filter, because the film is highly responsive to light so you need to filter out everything except the red and infrared spectrum (see eg. http://www.coolmint.co.uk/infrared/guide/).
Figure 1.15: The range of sensitisings available in 1937 at Eastman (O to Z on the vertical axis) and their optimal spectral range as the black bars running horizontally. The wavelenth (horizontal axis) is expressed in Angstroms.
The visible part of the spectrum is marked. All the emulsions retain their UV-blue sensitivity, even the ones for the infrared. (Malin 2011).
References and further reading to the chapter:
Brandes, T.,2004:“Quantum Mechanics I” (P303 / M326),UMIST,
http://wwwitp.physik.tu-berlin.de/brandes/public_html/qm/umist_qm/node3.html
Combs, A. C. et al.,1965: “Application of Infrared Radiometers to Meteorology”,J. Appl. Meteor., 4, 253 Chester, T.,1999: “Reconciling the Herschel Experiment“, http://tchester.org/znet/calculations/herschel/index.html Du Bois D., & Du Bois E. F.1916: “A formula to estimate the approximate surface area if depth and weight be known”, Arch. Intern. Medicine, 17, 863-71.
Greenwood, K. F.,1998:“Partnership With Industry - Princeton and photonics firms join forces to create new technologies”, Daily Princetonian, Volume 120, Number 60
Herschel, W.,1800: ”Experiments on the refrangibility of the invisible rays of the Sun”, Phil. Trans. Roy. Soc.
London 90, 284–292
Herschel W.,1800b:“Experiments on the solar and on the terrestrial rays that occasion heat … (2d part)”, Philosophical Transactions of the Royal Society, 90, 437-538.
Hildebrandt, C. et al.2012:The Application of Medical Infrared Thermography in Sports Medicinein the book:
"An International Perspective on Topics in Sports Medicine and Sports Injury", page 14, DOI: 10.5772/28383) http://www.intechopen.com/books/an-international-perspective-on-topics-in-sports-medicine-and-sports-injury/the-application-of-medical-infrared-thermography-in-sports-medicine Hinson, L., 2009:“Recent North Buckhead Wildlife Photos”, http://www.nbca.org/Wildlife/New_Pictures.htm Hobbie, R. K. , Rot, B.J.:2007,Intermediate Physics for Medicine and Biology, Springer
Hoffmann, D.:2000, Physikalische Blätter, Vol 56 Issue 12,100 Jahre Quantenphysik: Schwarze Körper im Labor: Experimentelle Vorleistungen für Plancks Quantenhypothese
http://onlinelibrary.wiley.com/doi/10.1002/phbl.20000561215/abstract
Langley, S.P.,:1881,”The Bolometer and Radiant Energy”, Proceedings of the American Academy of Arts and Sciences, Vol. 16, p. 342
Malin, D. 2011: ”About Astronomical Photography“, Australian Astronomical Observatory, http://www.aao.gov.au/images/general/photography.html
Planck, M.:1900,Zur Theorie der Gesetzes der Energieverteilung im Normal-Spektrum,Verhandlungen der Deutschen Physikalisches Gesellschaft Nr. 17, p. 237
Pouillet, C.,1838:Mémoire sur la chaleur solaire, sur les pouvoirs rayonnants et absorbants de l’air atmo- sphérique, et sur la température de l’espace. Comptes Rendus de l’Académie des Sciences, 7, 24-65.
Stefan, J.:1879,Über die Beziehung zwischen der Wärmestrahlung und der Temperatur, in: Sitzungsberichte der mathematisch-naturwissenschaftlichen Classe der kaiserlichen Akademie der Wissenschaften, Bd. 79, S. 391- 428.
An astronomical IR picture album: http://www.ipac.caltech.edu/Outreach/Gallery/gallery.html Herschel: http://en.wikisource.org/wiki/William_Herschel_and_his_work
Wien: http://www.nobelprize.org/nobel_prizes/physics/laureates/1911/
Planck: http://www.nobelprize.org/nobel_prizes/physics/laureates/1918/planck-facts.html Thermograms of electric circuits: http://www.arl.army.mil/arlreports/2005/ARL-TR-3690.pdf or http://www.datacentir.com/ppm.html
Thermograms of buildings: http://energy.gov/energysaver/articles/thermographic-inspections http://electriciantraining.tpub.com/14193/css/14193_106.htm
http://en.wikipedia.org/wiki/Luncheon_of_the_Boating_Party
http://phet.colorado.edu/sims/blackbody-spectrum/blackbody-spectrum_en.html http://www.coolmint.co.uk/infrared/guide/
http://www.princeton.edu/paw/archive_old/PAW97-98/12-0325/0325feat.html
http://www.sciencemuseum.org.uk/on-line/treasure/objects/1876-565.asphttp://cvision.ucsd.edu/cie.htm
astronomy
As early as in 1842 Luigi Magrini (Magrini, 1843) measured the infrared radiation from the solar corona during an eclipse. The Sun, Moon and bright stars became targets of infrared observations, the “heat of the stars" Sirius, Pollux, and Regulus was detected by William Huggins (Huggins, 1869). Late nineteenth century the solar infrared spectrum was investigated. William de Wiveleslie Abney published his map of the solar infrared lines (see Abney, 1881, 1886). He obtained the spectrum by a grating spectrograph and photographic recording using a special silver salt as he describes the emulsion. The lines were listed in the wavelength range of 715 nm < λ < 1000 nm. Those years even the strongest atmospheric infrared lines were not yet well identified. His report on measurements at sea level (London) and at high altitudes (Zermatt) could be used to discuss the effect of water vapor on the spectrum and the assumed presence of oxygen lines. A few of the detected solar spectral (non-atmospheric) lines were called metallic, but few of them were named as “X” (4 lines) or “Y” (at λ2= 898.65nm and λ1= 899.04nm) without a clue of the radiating particles. The setup of Abney’s spectrograph is shown in Figure , where the sunlight enters the tube in the slit “S” and via the right-angle prism “p” it is reflected to mirror M’ then to the grating “G” another spherical mirror M” then reflects the spectrum to the photographic plate “P”.
Figure 2.1: Abney’s apparatus measuring the solar near-infrared spectrum. (Abney, 1886, Philosophical Transactions of the Royal Society London, Vol. 177, page 460)
Early attempts in the late 1930s at finding infrared stars were hindered by the fact that the work relied on narrow- field optical telescopes and photographic detection; the relatively short wavelengths to which photographic emulsions were sensitive (below one micron) further limited the work. Photon detectors and image converters were developed in the first half of the 20th century. Infrared spectroscopy emerged and became the key analytical techniques available to chemists. The image converter, developed on the eve of World War II, enabled man to see in the dark and was immediately applied by the military. The post WWII developments of the lead salt family semiconductors started actually in the 1930s when Edgar W. Kutzscher (University of Berlin) discovered that lead-sulphide was photoconductive and had response to about 3 μm. The technique was already used in air-borne IR systems from 1943. Photoelectric detectors capable of sensing the infrared were developed during World War II also by R.
Cashman of Northwestern University. Although astronomers acquired a few PbS (lead sulfide) cells and later photomultipliers in the 1940s and 1950s, much of the technology remained classified.
2.1 The Two-Micron-Sky Survey (also IRC or Caltech 2.2 micron survey)
The infrared telescope built by Neugebauer and his associates at Caltech utilized PbS photomultipliers which by the 1960s were generally available. The instrument was designed to gather infrared radiation at 2.2 microns, in the K photometric band, a region of the spectrum which is relatively free from absorption by water vapor in the Earth’s atmosphere. Detection at this wavelength was achieved by using an array of four liquid nitrogen cooled lead sulfide detectors. Radiation was focused onto the detectors by a 64-inch focal length 62-inch diameter parabolic reflector.
The entire telescope as well as the protective shed were constructed by Caltech personnel, graduate and undergraduate students. The Santa Barbara Research Corp built the lead sulfide detectors.
The mirror was of ”spin-cast” design. An aluminum dish was rotated rapidly on a mill as epoxy resin was poured onto its surface. Under rotation, the fluid resin assumed a parabolic shape. The dish was spun until the resin hardened and was then aluminized to provide the reflecting surface. The electromechanical system used to diminish interference from background radiation involved first conversion of the signal from celestial sources to an alternating current by rocking the primary mirror slightly at 20 Hz back and forth relative to the detectors. Since the background signal (sky plus instrument noise) remained in the focal plane, it remained as direct current and it could be filtered out electronically (Neugebauer 1969). After the Caltech team demonstrated the successful operation of the telescope in an alley outside the Ryerson Laboratory on the Caltech campus the telescope was disassembled, moved to Mt.
Wilson and reassembled.
The Caltech infrared telescope was first put into operation in 1963 on Mt. Wilson and then moved to White Mountain, also in California. Operated by several generations of graduate students from Caltech it was used as a survey instrument through the late 1960s. The telescope was programmed to mechanically sweep a 15 degree wide arc in a raster pattern. About 75% of the sky could be surveyed over one year. Data were collected on a strip chart recorder.
Infrared sources were then located by inspection of the charts and keyed manually onto paper tape for subsequent computer processing. The two complete northern sky surveys, one at 0.84µm and one at 2.2µm were completed by 1968. These surveys revealed a surprisingly large number of infrared sources.
The IRC catalogue contains 5562 stars brighter than K=3.0, with positions accurate to ≈ 1 arcminute. Only roughly 30% of these corresponded to visible objects. One of the strong infrared sources that were faint in the visible was the Becklin-Neugebauer object in the Orion nebula (Becklin & Neugebauer, 1967). The Solar System size object hides a luminous, massive young star (8Mʘ<M<15Mʘ), and although the star may have an effective temperature of 30000 K, the “infrared star” i.e. the dusty envelope shows a color temperature of only about 700K.
Another famous IR discovery was IRC+10216, a luminous carbon star with a thick circumstellar disk which obscures its visible light. When the survey was completed, the telescope was used through the mid-1970s to explore many of the infrared sources it had discovered, such as variable infrared stars like IRC+10216, the brightest star in 5 micron (Becklin et al., 1969), and dense clouds that are the sites of star birth. The telescope provided much useful data on the structure of our galaxy because near-infrared radiation from the center of the Milky Way is attenuated by only a factor of 10 by the interstellar medium, whereas visible light is attenuated by a factor of 10 billion.
Data from the telescope revealed features of the Milky Way, such as the distribution of infrared stars along the galactic plane; the telescope also provided data on the location of red giant stars and detected a strong infrared source at the center of the galaxy. This inexpensive and ingenious instrument produced data that led to over 78 scientific publications. It helped to found a new branch of astronomy.
See also references on the IRC or Caltech 2.2 micron survey at the end of the chapter.
2.2 Other important early discoveries with ground based telescopes
One can distinguish inside of OMC-1 two intense infrared sources: the punctual object of Becklin-Neugebauer (BN, see in Chapter 2.1) and, 10” to the south, the Kleinmann-Low Nebula that was found to be an ”extended source of very low temperature” (i.e. 70K) as mapped at 22µm with a 30” beam. ”The discovery of the infrared nebula in Orion means that early stages of star and star-cluster formation can be observed in the far infrared”
(Kleinmann & Low 1967)
Figure 2.2: Infrared K-band image of the Orion Nebula Cloud and the BN/KL region (courtesy M. McCaughrean, University of Exeter). The Trapezium stars (A, B, C, D and E) and the BN object are labeled. The image was taken with the ESO Very Large Telescope. (Menten K.M. et al. 2007 A&A 474, 515,
http://www.aanda.org/articles/aa/full/2007/41/aa8247-07/aa8247-07.html, http://dx.doi.org/10.1051/0004- 6361:20078247)
The infrared point sources (IRS) in the W3 region as many as 9 were found, with low 2 µm and bright 20 µm emission indicating highly obscured bright sources. 4 of them are identified as compact radio HII condensations of 0.1pc diameter, one of which is towards the W3(OH) source. Four others are without radio continuum counterpart but associated with water maser sources. One of these W3IRS5 was thought to be a massive protostar (forming O star).
2.3 Balloon-borne infrared observatories
Balloon-borne observatories were designed to observe the cold radiation of the Universe from a stratospheric balloon- borne platform. At this altitude the atmosphere is almost transparent to the sub-millimeter radiation. However the environment is quite hostile, very close to space conditions: no thermal convection, energetic particles, hard Sun radiation, and extreme temperature excursions.
2.3.1 Far-Infared Spectrometer (FIS):
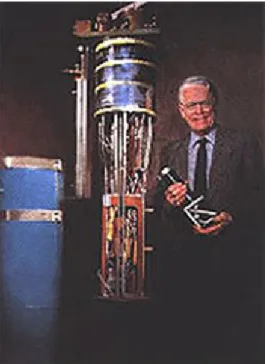
This instrument, also known as the Woody-Richards experiment (see Fig. 2.3), was one of the first designed to test the theory of the Big Bang by analyzing that radiation. The Fourier transform far infrared spectrometer worked on the principle of an interferometer. To achieve maximum sensitivity the assembly was immersed in a cryostat cooled with superfluid helium. Helium 3, used in last flight cooled the bolometer to below one degree above absolute zero, the first time such a low temperature had been used for astronomical observations. The whole package was borne to high altitudes far above most of the earth’s atmosphere by a large helium filled balloon. The spectrometer was used for three flights in the mid-1970s. The results showed a blackbody radiation with a temperature of 2.96K (Woody & Richards 1979) provided the most widely accepted support for the Big Bang theory until the announce- ment of data from the Far Infrared Absolute Spectrometer (FIRAS) flown on the Cosmic Background Explorer (COBE) satellite. The Woody-Richards experiment combined novel technologies that were later used on FIR- AS/COBE. It was donated to NASM in 1997 by Professor Paul Richards of the Department of Physics at the U n i v e r s i t y o f C a l i f o r n i a , B e r k l e y . ( s e e a l s o : http://www.lbl.gov/Science-Articles/Research-Review/Magazine/1997-fall/notes/index.html)
Figure 2.3: Paul Richards stands with elements of the Woody-Richards cosmic microwave background instrument package (http://www.lbl.gov/Science-Articles/Research-Review/Magazine/1997-fall/notes/index.html)
2.3.1 PRONAOS
The balloon-borne experiment (”PROjet NAtional d’Observation Submilletrique”) was a French (state-of-art) successor of the early probes. It consisted of a gondola hosting a 2m segmented sub-millimeter telescope. The first flight of the instrument was performed in September 1994 and gave only limited scientific results (see Ristorcelli et al. 1998) due to pointing problems.
During the second flight from Fort-Sumner (NM, USA) on September 22, 1996 data could be obtained under good conditions for more than 20 hours. The fine pointing of the payload is ensured by a star tracker allowing night and day detection of stars to a relative accuracy of about 5” rms. Details of the gondola stabilisation and pointing are given in Berrivin et al. (1997).
The focal plane instrument, SPM (”Spectro Photometre Submillimetrique”), is a sub-millimeter photometer observing simultaneously in four channels. They measure the sub-millimeter flux in the spectral ranges 180-240, 240-340, 340-540, and 540-1200 µm, band 1-4, with sensitivity to low brightness gradients of about 1 MJysr-1 in band 4.
The effective wavelengths are 200, 260, 360 and 580 µm for an emissivity grey body spectrum at 30 K) in wide bands (60, 100, 200 and 660 µm respectively). A detailed description of the SPM photometer and the PRONAOS gondola and telescope is given in Lamarre et al. (1994). The beam of the instrument is modulated on the sky with an amplitude of 6.0’ at a frequency of 20 Hz using an internal wobbling mirror. Detection is achieved using four bolometers cooled to 0.3 K by two compact, closed cycle fridges. The FWHM beam size, as measured on a map of Saturn during the flight, is 2, 2, 2.5 and 3.5 arcmin respectively. The in-flight response of the SPM instrument is measured using an Internal Calibration System (ICS) which is composed of two blackbodies at 310 and 370 K.
The differential signal of the ICS is injected at the entrance of the instrument between each observation using a movable mirror.
Sensitive measurements toward the high latitude cirrus cloud in the Polaris Flare allowed for the first time to study in details the sub-millimeter dust emission of cirrus at the arc minute scale. The extended cirrus as well as a compact condensation already identified as an NH3core were well detected in the four photometric channels of the instrument.
Bernard et al. (1999) proposed that the optical properties of dust in regions such as the Polaris cirrus, which exhibit large excess over their emission, are modified compared to those prevailing in the general diffuse interstellar medium in the Galaxy. This change in the optical properties of large grains is likely connected to the coagulation of smaller dust particles on large size grains.
The central region of the Orion A cloud complex has been observed in the sub-millimeter range, using the PRONAOS-SPM during its first flight, in 1994 September. An area covering 50’ x 10’ and including the M42 Nebula has been mapped in four sub-millimeter photometric bands: lambda 180-240, 240-340, 340-540, and 540- 1200µm, with high sensitivity (≤ 2MJysr−1) and an angular resolution from 2’ to 3.’5, see Figure 2.4. Four brightness enhancements are visible and have been identified with the following sources: (1) the brightest peak corresponding to the central core of the nebula, in the BN/KL source direction; (2) an extended emission region around 5’ x 8’, to the southeast of BN/KL, correlated with 100 µm IRAS and13CO emission (this has been identified as a gas-density enhancement associated with a shock region); (3) the edge of an ionized part of the cloud, correlated with the 100 µm emission; and (4) a very cold and extended condensation, discovered at 16’ northwest of BN/KL.
The emission spectra obtained for these sources show a variation of the dust emissivity spectral index within a large range, from 1±0.1 to 2.2±0.2. The dust opacity has a frequency dependence κν= κ0(ν/ν0)β, where β is the emissivity spectral index of dust emission. The cold condensation discovered (T = 12.5±3 K) has a very low brightness emission, undetected on the 100 µm IRAS map. It extends over approximately 0.7 pc (FWHM), with a total mass of 11 Mʘand a total luminosity of 2.4 Lʘ(Ristorcelli et al., 1998).
Figure 2.4: PRONAOS-SPM (210 µm) deconvolved signal of the M42. The contours are 100 µm IRAS image (Figure 4 from Ristorcelli et al. 1998)
2.4 Rocket flights
The Aerobee rockets were liquid-propellant sounding rockets procured by the US Air Force’s Geophysics Labor- atory for its infrared astronomy, or Hi Star program. The Hi Star program of the late 1960’s to mid-1970’s used infrared telescopes carried by Aerobee and other rockets to refine its target sighting instrumentation in the devel- opment of anti-satellite weapons systems. The weapons were required to detect infrared targets at the greatest possible range and the sightings had to permit discrimination of the target from the background of the celestial sky as well as celestial and other radiations.
Altogether, the Air Force acquired four Aerobee 350’s but this one was not flown because the simpler and less expensive Aires solid-fuel sounding rocket replaced the Aerobees. This Aerobee, the largest and most sophisticated member of the Aerobee sounding rocket family which lasted from 1947 to 1985, is flyable and though lacks its solid-fuel booster. The Aerobee 350 was an expendable vehicle and the usual scientific payload it carried had a parachute attached for data recovery purposes. Typical payloads were large telescopes and mass spectrometers, and smaller instruments for measuring micrometeorites, airglow spectra, electromagnetic waves, radiation, ion composition, stellar spectra and aurora phenomena (http://www.astronautix.com/lvs/aeree350.htm).
The first IR astronomical flight detected sky noise only at the bands 1-to 3 µm and 3-to 7µm (Harwitt et al. 1966).
AFCRL and AFGL infrared sky surveys were carried out by the US Air Force Cambridge Research Laboratory.
The 16.5cm aperture rocket-borne telescopes surveyed the sky in the 3-to 5µm 8-14µm and 16-24µm bands. It discovered objects like the pre-planetary nebulae RAFGL 2688 ”the EGG nebula” (Ney et al. 1975), and RAFGL 618 (Westbrook et al. 1975) (see also Lo & Bechis, 1976). The surveys also discovered ”possible pre-main-sequence objects” in the densest central portions of large interstellar clouds (Werner, Becklin & Neugebauer 1977), and
”nebulous objects” like CRL2789 or V645 Cygni which was turned out to be a young stellar object associated with a bipolar molecular outflow with a modest degree of collimation. (Cohen, 1977.).
The following catalogs were created:
Walker, R. G.: 1975, ”AFCRL infrared sky survey. Volume 1: Catalog of observations at 4, 11, and 20 microns”
Price, S. D.; Walker, R. G.: 1976, ”The AFGL four color infrared sky survey: Catalog of observations at 4.2, 11.0, 19.8 and 27.4 micrometers”
The latest developments in observational technique allow infrared measurements using large telescopes and inter- ferometry. The collecting area allows us to study faint objects and the resolution increases
http://learn.hamamatsu.com/tutorials/java/airymag/
2.5 COBE
The Cosmic Background Explorer (COBE), launched by NASA in November 1989, to study both infrared and microwave characteristics of the cosmic background radiation (the remains of the extreme heat that was created by the Big Bang). Over a ten month period, COBE mapped the brightness of the entire sky at several infrared wavelengths. COBE carried three instruments, a Far Infrared Absolute Spectrophotometer (FIRAS) to compare the spectrum of the cosmic microwave background radiation with a precise blackbody, a Differential Microwave Radiometer (DMR) to map the cosmic radiation sensitively, and a Diffuse Infrared Background Experiment (DIRBE) to search for the cosmic infrared background radiation. Each COBE instrument yielded a major cosmological dis- covery. The Nobel Prize in Physics 2006 was awarded jointly to John C. Mather and George F. Smoot for their discovery with COBE of the blackbody form and anisotropy of the cosmic microwave background radiation.
2.5.1 FIRAS
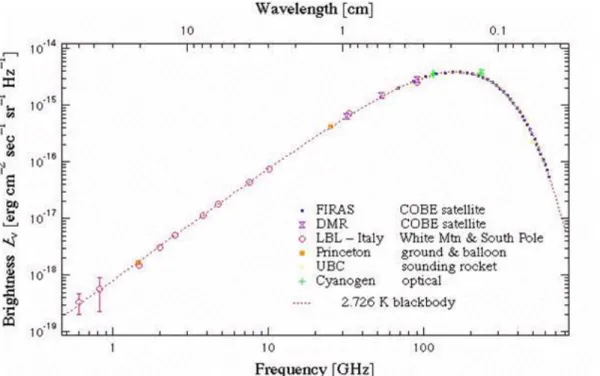
The cosmic microwave background (CMB) spectrum is that of a nearly perfect blackbody with a temperature of 2.725 ± 0.002 K, see Figure 2.5. This observation matches the predictions of the hot Big Bang theory extraordin- arily well, and indicates that nearly all of the radiant energy of the Universe was released within the first year after the Big Bang.
Figure 2.5: CMB intensity plot. Blue points represent the FIRAS measurements. The fitted line is a single temper- ature blackbody with T=2.726 K. (http://aether.lbl.gov/www/projects/cobe/CMB_intensity.gif)
2.5.2 DMR
The CMB was found to have intrinsic ”anisotropy” for the first time, at a level of a part in 100,000. Figure 2.6 shows the reduced DMR map (i.e., both the dipole and Galactic emission subtracted). This map has been smoothed with a 7 degree beam, giving an effective angular resolution of 10 degrees. An all-sky image in Galactic coordinates is plotted using the equal-area Mollweide projection. The plane of the Milky Way Galaxy is horizontal across the middle of the picture. These tiny variations in the intensity of the CMB over the sky show how matter and energy was distributed when the Universe was still very young. Later, through a process still poorly understood, the early structures seen by DMR developed into galaxies, galaxy clusters, and the large scale structure that we see in the Universe today.
Figure 2.6: Reduced map based on two years of DMR observation (http://aether.lbl.gov/www/pro- jects/cobe/COBE_Home/cmb_fluctuations_big.gif)
2.5.3 DIRBE
Infrared absolute sky brightness maps in the wavelength range 1.25 µm to 240 µm were obtained in 10 bands to carry out a search for the cosmic infrared background (CIB). Figure 2.7 and 2.8 show the galactic plane emission in bands 1-5 and 6-10. These data contain the signal from the CIB and the foreground emissions from extragalactic sources, our Galaxy, and dust and other sources in our solar system.
Figure 2.7: Galactic plane emission in bands 1-5 (http://aether.lbl.gov/www/projects/cobe/gal_plane_b1_b5_big.jpg)
Figure 2.8: Galactic plane emission in bands 6-10 (http://aether.lbl.gov/www/pro- jects/cobe/gal_plane_b6_b10_big.jpg)
The CIB was originally detected in the two longest DIRBE wavelength bands, 140 and 240 µm, and in the short wavelength end of the FIRAS spectrum. Subsequent analyses have yielded detections of the CIB in the near-infrared DIRBE sky maps. The CIB represents a ”core sample” of the Universe; it contains the cumulative emissions of stars and galaxies dating back to the epoch when these objects first began to form. The COBE CIB measurements constrain models of the cosmological history of star formation and the buildup over time of dust and elements heavier than hydrogen, including those of which living organisms are composed. Dust has played an important role in star formation throughout much of cosmic history.
We can access DIRBE Data Online at: http://lambda.gsfc.nasa.gov/product/cobe/. See http://astron.berkeley.edu/davis/dust/index.html (Schlegel et al. 1998) for “Maps of Dust IR Emission for Use in Estimation of Reddening and CMBR Foregrounds”.
2.6 Development of IR instrumentation
The development of instrumentation resulted in an increase of sensitivity and angular resolution as an example we show FIR images of the M51 galaxy from the 1980s and at 2009 on Figure 2.9. Science with IRAS, ISO, Spitzer and Herschel Space Telescopes will be discussed in Chapter 6.1, 7.1, 7.2 and 7.3
Figure 2.9: FIR images of M51 observed with IRAS at 60 and 100 µm, ISO at 60, 100 and 160 µm, Spitzer Space Telescope at 70 and 160µm and Herschel Space Observatory at 70, 100 and 160 µm (http://a136.idata.over- blog.com/3/69/76/43/Au-nom-de-la-loi/M51---resolution---diffraction---Herschel.jpg)
References and further reading to the chapter:
Abney, WdW,1881:“Capt. Abney's map of the infra-red end of the solar spectrum”, MNRAS, 41Q, 231 Abney, WdW,1886:“The Solar Spectrum, from λ 7150 to λ 10,000”, Philosophical Transactions of the Royal Society London, Vol. 177, page 457
Becklin, E. E. & Neugebauer, G.1967:„Observations of an Infrared Star in the Orion Nebula“, ApJ. 147. 799 Becklin, E.E. et al.1969:”The Unusual Infrared Object IRC+10216“,ApJ, 158, L133
Bernard, J. P.et al. 1999:“PRONAOS observations of MCLD 123.5 + 24.9: cold dust in the Polaris cirrus cloud”, A&A 347, 640
Berrivin, S. et al.1997:“The PRONAOS Pointing and Stabilisation System”, ESASP, 381, 597 Cohen, M.,1977:“The nature of V645 Cygni = CRL 2789”,ApJ, 215, 533.
Johnson, H., 1966: ”Infrared Stars,” Sky and Telescope, 73-77
Harwitt, M. et al., 1966:“Results of the first infrared astronomical rocket flight”,AJ, 71, 1026
Huggins, W.,1869: ”Note on the Heat of the Stars”, Proceedings of the Royal Society of London, Vol. 17, p.
309
Kleinmann, D. E. & Low, F. J.1967:„Discovery of an Infrared Nebula in Orion“, ApJ, 149, L1.
Lamarre, J. M. et al.,1994:„SPM, a submillimeter photometer for PR0NAOS”,InPhT, 35, 277
Lequeux, J.,2009: “Early Infrared Astronomy”, Journal of Astronomical History and Heritage, 12(2), 125.
http://www.narit.or.th/en/files/2009JAHHvol12/JAHHvol12no2Complete.pdf
Lo, K. Y., Bechis, K. P., 1976:“CRL 2688 and CRL 618 - Proto-planetary nebulae”, ApJ, 205, L21.
Magrini, L.,1843: L'ecclisse solare totale dell'8 Luglio 1842. Relazione
Neugebauer, G.,1969:Infrared Observations in Space Astronomy, Optical Telescope Technology, NASA SP- 233, NTIS, Springfield, VA, 25-32.
Neugebauer, G.,Becklin, E. E. 1971:“Infrared Sources of Radiation“, ARA&A, 9, 67
Neugebauer, G.,Becklin, E. E., 1973: ”The Brightest Infrared Sources,” Scientific American 228:28-40.
Neugebauer, G.,Leighton, R, 1968: ”The Infrared Sky,” Scientific American 218:50-61.
Neugebauer, G.,Leighton, R., 1969:Two-Micron Sky Survey - A Preliminary Catalog. NASA SP-3047, NTIS, Springfield, VA, 25-32.
Neugebauer, G.,Martz, D., Leighton, R. 1965: ”Observations of Extremely Cool Stars,” ApJ, 142, 399 Ney, E. P. et al., 1975:“Studies of the infrared source CRL 2688”, ApJ, 198, L129
Price, S. D., 1988: ”The Infrared Sky: A Survey of Surveys,” Publications of the Astronomical Society of the Pacific, pp. 171-186.
Rieke, G. H.,2009: History of infrated telescopes and astronomy, Exp Astron, 25, 125 DOI 10.1007/s10686- 009-9148-7
Ristorcelli, I. et al.1998:“Discovery of a Cold Extended Condensation in the Orion A Complex”, ApJ, 496, 267.
Schlegel, D. J., Finkbeiner, D. P. & Davis, M.,1998,“Maps of Dust IR Emission for Use in Estimation of Reddening and CMBR Foregrounds“, ApJ, 500, 525
Werner, M. W., Becklin, E. E., Neugebauer, G.,1977:“ Infrared studies of star formation“, Science, vol. 197, p. 723-732.
Westbrook, W. E. et al., 1975:“Observations of an isolated compact infrared source in Perseus”, ApJ, 202, 407
Woody, D. P.; Richards, P. L. 1979:“Spectrum of the cosmic background radiation”, 1979PhRvL..42..925W Report of the Astronomy Survey Committee, Astronomy and Astrophysics for the 1970s, Vol. 1. National Academy of Sciences, Washington, DC 1972, 83-85.
http://www.astronautix.com/lvs/aeree350.htm http://learn.hamamatsu.com/tutorials/java/airymag/
http://www.nasm.edu/nasm/dsh/artifacts/SS-caltech2.htm http://www.nasm.edu/nasm/dsh/artifacts/RM-Aerobee350.htm http://www.nasm.edu/nasm/dsh/artifacts/SS-Far-Infrared.htm
origin of the infrared radiation
In this chapter we describe the technological and observational justification of the infrared band. Atomic and mo- lecular transitions are investigated as the origin of the infrared radiation.
Electromagnetic radiationis classified by wavelength into gamma rays, X-rays, ultraviolet, visible, infrared, microwave and radio, see on Figure 3.1. Infrared radiation lies between the visible and microwave part of the electromagnetic radiation.
3.1 The definition of the infrared band
The quantum efficiency is a measure of a device's electrical sensitivity to light. It is the incident photon to converted electron ratio, i.e. the percentage of photons hitting the device's photoreactive surface that produce charge carriers.
It is measured in electrons per photon or amps per watt. As we see in Figure 3.1 the quantum efficiency of the human eye is around 1% to 10%, over most conditions (see eg. http://psych.nyu.edu/pelli/pubs/pelli1990effi- ciency.pdf). It gets slightly better for red colour at low light levels (photopic vision), but our eyes lose all sensitivity beyond the red end of the visible spectrum (λ > 0.75 µm).
Figure 3.1: Quantum efficiency of human eye and CCD
The infrared quantum efficiency of typical photoemulsions is similar to the human eye, however infrared sensitive astrographic photo plates (Kodak IVN) were sensitive up to λ ≈ 1 µm. We can not use any more most of the visible band technologies such as photography, CCDs and photocathodes for λ >1.1 µm, and that wavelength limit can be considered as a technical border of infrared at the short wavelength side. Referring to Figure 3.1 we note that the CCD surface has channels used for charge transfer that are shielded by polysilicon gate electrodes which absorb light (mostly blue). Such losses are eliminated in the back-illuminated CCD, where the light falls onto the back of the CCD in a region that has been thinned so it is transparent. The wavelength dependent specific detectivity D* is defined as reciprocal of noise-equivalent power (NEP), normalized per unit area:
(3.1) ,
where Area is the photosensitive region of the detector. The unit of D*is: cmHz½W-1.
Figure 3.1 shows the specific detectivity D of the most common compounds used as detectors which include:
Gallium Arsenide – GaAs, Lead Sulfide – PbS, Indium Antimonide – InSb, Germanium doped with Copper - Ge:Cu, Germanium doped with Zinc - Ge:Zn, Germanium doped with Gold - Ge:Au, Germanium doped with Gallium - Ge:Ga, Lead Telluride – PbTe, phosphorus-doped silicon – Si:P.
Figure 3.2:Spectral response characteristics of various infrared detectors. (Ueda T, Komiyama S, 2010, http://openi.nlm.nih.gov/detailedresult.php?img=3231243_sensors-10-08411f7&req=4 )
The highest available frequency band of terrestrial sub-mm observatories is at 810GHz (0.37mm). The ”end” of the infrared region is again technologically defined: it is the wavelength (≈ 350µm) where radio techniques such as superheterodyne receivers tend to be used in preference to the ”optical style” infrared approach and the incoming radiation tends to be thought of as waves rather than individual photons. The region from 0.35mm to 1mm is referred to as the sub-millimeter region. It may be regarded as a subdivision of radio astronomy.
Astronomical justification for the definitionis that already at 2.2µm the sky has a significantly different appearance from the visible one. The cooler end of the stellar population becomes predominant and some objects turn out to have infrared fluxes much higher than predicted from their visible spectra.
These infrared excesses can be due to cool dust shells surrounding them or to circumstellar free-free emission for example. The most important sources of the infrared photons are Solar system objects, stars and extended galactic objects, extragalaxies. The cosmic microwave background (CMB) is the relic of the Big Bang. It is characterized by a blackbody spectrum of temperature 2.73K. The rise of its spectrum marks the end of the infrared.
The vibrational transitions of molecules results infrared photons, whereas we observe their rotational transitions spectra in the sub-mm and radio region.
Infrared is divided into three parts: near, mid and far-infrared. Near-infrared refers to the part of the infrared spectrum that is closest to visible light and far-infrared refers to the part that is closer to the microwave region.
Mid-infrared is the region between these two. The boundaries between these regions are not exact and can vary.
(Table 3.1. shows the general properties of the infrared ranges.)
Astronomical objects Wavelength range [μm]
Infrared radiation
Red giants 1-5
Near
Cooler red stars
Planets, comets and asteroids 5-30
Mid
Protoplanetary disks Central regions of galaxies 30-400
Far
Astronomical objects Wavelength range [μm]
Infrared radiation
Emission from cold dust Table 3.1: Properties of the infrared ranges
A justification based on the observational conditionscan be made as well. Beyond 2.3µm blackbody radiation from the telescope and the atmosphere itself begins to dominate other sources of background. Measurements of faint astronomical objects have to be made by alternatively observing the field containing the source and a nearby
”empty” one. This process is known as chopping. The signals are subtracted to eliminate the strong background.
Alternatively the measurement is taken outside the atmosphere with a cooled observing system.
In the NIR, MIR and FIR the main sources of the background are terrestrial, Zodiacal light and galactic ISM radi- ation. From about 300µm CMB starts to dominate the background. Except bands in the NIR, the infrared sky is to be observed by air-borne or space-borne instruments.
The sub-millimeter region however can be accessed again in selected atmospheric windows by terrestrial telescopes located at high altitude, low precipitable water vapor (pwv) sites like Mauna Kea or South Pole. Precipitable water is the measure of the depth of liquid water at the surface that would result after precipitating all of the water vapor in a vertical column over a given location, usually extending from the surface to 300 mb (http://forecast.weather.gov/glossary.php?word=precipitable%20water).
Figure 3.3:Electromagnetic spectrum (http://en.wikipedia.org/wiki/File:EM_spectrum.svg) from 10-16to 108m.
The visible spectrum located in the middle, it covers only a small part of the spectrum.
Observations at different wavelengths reveal various pictures from astronomical objects. Figure 3.4 shows the M51 Spiral Galaxy at different wavelengths: from visible to far infrared. Observations of visible light show the stars that make up the galaxy. Infrared observations reveal the mixture of gas and dust from which new stars can be born.