JES FOCUSISSUE ONSEMICONDUCTORELECTROCHEMISTRY ANDPHOTOELECTROCHEMISTRY INHONOR OFKRISHNANRAJESHWAR
Composition-Dependent Optical and Photoelectrochemical Behavior of Antimony Oxide Iodides
Altantuya Ochirkhuyag,1Ildik´o Y. T´oth,1Attila Korm´anyos,2,3Csaba Jan´aky, 2,3,∗ and Zolt´an K´onya 1,4,z
1Department of Applied and Environmental Chemistry, University of Szeged, H-6720 Szeged, Hungary
2Department of Physical Chemistry and Materials Science, University of Szeged, H-6720 Szeged, Hungary
3MTA-SZTE “Lend¨ulet” Photoelectrochemistry Research Group, University of Szeged, H-6720 Szeged, Hungary
4MTA-SZTE Reaction Kinetics and Surface Chemistry Research Group, H-6720 Szeged, Hungary
The ongoing search for new photoelectrode materials generated interest toward semiconductors containing multiple anions. In this work, three different antimony oxide iodides (Sb3O4I, Sb8O11I2, and Sb5O7I) were synthesized by anhydrous synthesis. Scanning electron microscopy revealed mainly needle-shaped particles for Sb3O4I, elongated plate-shaped ones for Sb8O11I2 and well- crystallized hexagonal particles for Sb5O7I. The isoelectric point of the antimony oxide iodides (pH∼3) was independent of the chemical composition. With increasing pH particles became negatively charged to different extents, depending on the relative amount of oxygen in the samples, through the presence of≡Sb−O−surface functional groups. The optical properties were heavily affected by the composition as well: bandgap energies related to the direct transitions in Sb3O4I, Sb8O11I2, and Sb5O7I were 2.16 and 2.74 eV, 2.85 eV, and 3.25 eV, respectively. Photoelectrochemical analysis proved that all samples behave as n-type semiconductors, but the performance in water oxidation showed large variation for the different compositions. The band energy diagram was constructed for all compounds and the composition dependent optoelectronic properties were rationalized on this basis.
© The Author(s) 2019. Published by ECS. This is an open access article distributed under the terms of the Creative Commons Attribution Non-Commercial No Derivatives 4.0 License (CC BY-NC-ND, http://creativecommons.org/licenses/by-nc-nd/4.0/), which permits non-commercial reuse, distribution, and reproduction in any medium, provided the original work is not changed in any way and is properly cited. For permission for commercial reuse, please email:oa@electrochem.org. [DOI:10.1149/2.0311905jes]
Manuscript submitted November 27, 2018; revised manuscript received January 22, 2019. Published February 2, 2019.This paper is part of the JES Focus Issue on Semiconductor Electrochemistry and Photoelectrochemistry in Honor of Krishnan Rajeshwar.
Energy is one of the fundamental pillars of our modern civiliza- tion. Nowadays, the most dominant sources for energy production are the non-renewable hydrocarbon fuels. Burning these fuels raised the anthropogenic carbon dioxide emission, increasing the concentration of greenhouse gases. In this way, the overuse of fossil fuels has led to global climate change. Consequently, both economic energy produc- tion and its environmental aspects are urgent and serious topics in the field of chemistry. The combination of reducing carbon dioxide con- centration in the atmosphere with the application of renewable energy sources, has gained increasing interest. One possible solution is the sunlight-assisted CO2reduction to different chemical fuels, which can be carried out for example by i) photochemical reduction on photocat- alysts or ii) photoelectrochemical (PEC) reduction on semiconducting photoelectrodes.1–7 All these processes shall be accompanied by so- lar driven water oxidation, as the other (anodic) half reaction. The essential component of these processes is a semiconductor photoelec- trode. Over the last decades, a large variety of semiconductors have been synthetized and characterized; for example, simple and complex oxides,8–12oxynitrides,13–15and oxysulfides.13,16The vast majority of research interest, however was focused on the oxide family.17–19
One of the most studied semiconductors is titanium dioxide,20 which has a large bandgap and is thus active in the UV range. There- fore, this material alone cannot be efficiently used for solar energy conversion. It needs modifications, for example, by using a dopant21 or construct heterojunction with another material such as g-C3N4.22 More recently, the group 15 elements (e.g., Bi, Sb, Se, N, P) seem to be favorable candidates as photoactive materials. Among them, bismuth- based materials are promising photocatalysts for the degradation of organic pollutants,23–25 HCHO removal, photocatalytic O2 and H2
evolution, and CO2 conversion.26Antimony is another semimetal of the nitrogen group that forms rather rare minerals including stibnite (Sb2S3), valentinite (Sb2O3), and kermesite (Sb2S2O). These are usu- ally present at trace levels in minerals such as ilmenite, Mg olivine, galena, sphalerite, and pyrite in the Earth’s crust.27
∗Electrochemical Society Member.
zE-mail:konya@chem.u-szeged.hu
Antimony oxide based materials – such as antimony organic halide complexes28– open new possibilities in hybrid solar cells and photo- catalysts. There are a few studies on these materials, such as on the synthesis of antimony oxide halides (SbOCI, Sb8O11CI2),29on the hy- drothermal synthesis of antimony oxyfluorides,30the photosensitive ferroelasticity ofα-Sb5O7I crystals,31 and the photocatalytic perfor- mance of Sb4O5CI2hollow microspheres.32At the same time, a coher- ent study on the role of chemical composition on the PEC properties is still missing. The bandgap of bismuth oxide halogenides decreases in the periodic table from top to bottom: bismuth oxyfluoride>bismuth oxychloride>bismuth oxybromide>bismuth oxyiodide: 3.5−3.6 eV
>2.9−3.4 eV>2.3−2.9 eV>1.8−2.1 eV, respectively.33Antimony sulfoiodide showed good visible light photocatalytic activity,34and the sonochemical growth antimony selenoiodide in multiwalled car- bon nanotube had promising optical properties and narrow bandgap, as well.35
According to the literature, the antimony/bismuth oxide io- dide materials have sufficiently narrow bandgap compared to other oxyhalides.23,33,36Yet, there are certain difficulties regarding their syn- thesis, namely the poor solubility of antimony oxide and the instability of iodine. Therefore, common solvents such as water or alcohols can- not be used, and even hydrochloric acid is unsuitable, because of the competition between iodine and chlorine during the compound for- mation. Consequently, studies about the synthesis and the photocat- alytic/photoelectrochemical characterization of SbxOyIz compounds are insufficiently detailed in the literature.
In this study, three different antimony oxide iodides were synthe- sized under anhydrous conditions.37Oxygen content of the samples was changed simply with the synthesis temperature and the molar ratio of precursors. Our main aim was to reveal the effect of the com- position (namely the oxygen content in the crystal structure) on the optical and PEC properties.
Materials and Methods
Chemicals.—Antimony(III) iodide (SbI3), antimony(II) oxide (Sb2O3), sodium hydroxide (NaOH), and sulfuric acid (H2SO4) were
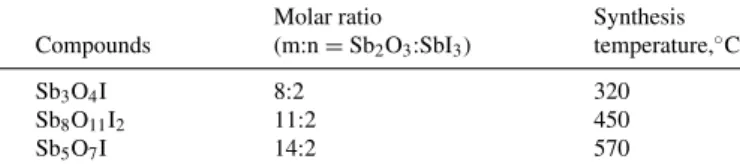
Table I. The molar ratio of precursors and temperature of the synthesis.
Molar ratio Synthesis
Compounds (m:n=Sb2O3:SbI3) temperature,◦C
Sb3O4I 8:2 320
Sb8O11I2 11:2 450
Sb5O7I 14:2 570
purchased from Sigma Aldrich. Isopropanol (C3H8O) and sodium sul- fate (Na2SO4) were bought from WVR and Ar (99.999% purity) was purchased from Messer. All chemicals used in this study were at least in analytical grade, and used without further purification. Ultrapure water (MilliQ) was used for sample processing.
Synthesis of antimony oxide iodides.—Samples were prepared following a method adapted from the literature, according to the equa- tion below.37
m Sb2O3+n SbI3=Sb2m+nO3mI3n(where m and n are integers). The compounds (TableI) were sealed individually into borosilicate glass ampoules under 0.1–0.2 mBar vacuum. The ampoules were heated by 5◦C/min rate in a transparent furnace until the onset of the reaction was noted and then annealed for 48 hours and cooled down with the same rate.
Characterization of antimony oxide iodides.—Powder X-ray diffraction.—All samples were characterized with a Rigaku Mini- flex II powder X-ray diffractometer (XRD) using a Cu Kαradiation source (λ=0.15418 nm) operating at 30 kV and 15 mA at room temperature. A scanning rate of 4 degrees min−1was used in the 2θ
=10–60◦range.
Scanning electron microscopy.—Morphology and composition of the synthesized materials were studied by scanning electron mi- croscopy (SEM). The samples were mounted on a sample holder with carbon conductive adhesive tape. Energy dispersive X-ray spec- troscopy (EDX) and high-resolution secondary electron images were taken by a Hitachi S-4700 Type II instrument (30 kV accelerating voltage). EDX quantitative analysis was repeated three times on dif- ferent areas of the sample and the average was calculated from the repetitions.
Thermogravimetry.—The thermal behavior of antimony oxide io- dide samples was investigated using thermogravimetry (TA Instru- ments Q500 TGA). The instrument worked under a constant flow of air, and the heating rate was 5◦C/min up to 700◦C. The samples, between 20–60 mg, were placed into high-purity alpha platinum cru- cibles.
Diffuse reflectance UV–vis spectroscopy.—Diffuse reflectance spectra in the ultraviolet-visible region (DRS-UV–vis) were recorded at room temperature in the 200–800 nm range using an Ocean optic bench model USB4000 in the diffuse reflectance mode using spectral- grade BaSO4as the reference material.
Raman spectroscopy.—Raman spectra were collected using a SEN- TERRA Raman microscope (Bruker Optics, Inc.) at 532 nm with a 1s integration (with three repetitions) at a resolution of 4 cm−1 and interferometer resolution of 0.5 cm−1.
Zeta potential measurement.—Electrophoretic mobilities of the antimony oxide iodide particles in water-based dispersions were mea- sured at 25±0.1◦C in Nano ZS (Malvern) apparatus with a 4 mW He−Ne laser source (λ=633 nm) operating in backscattering mode at an angle of 173◦using disposable zeta cells (DTS 1060). The Smolu- chowski equation was applied to convert electrophoretic mobilities to zeta potential values. The accuracy of the measurements was±5 mV.
The effect of pH (3.1, 4.7, 6.5 and 9.6, adjusted by H2SO4and NaOH solutions) was studied at 10 mM Na2SO4and at 25◦C. The prepared samples were left at rest for two hours, and the zeta potential mea- surements were started after 1 minute ultrasonication.
Current–Voltage characteristic.—Antimony oxide iodide suspen- sions were drop-casted on a glass substrate with gold interdigitated electrodes (Micrux technologies, Spain). The drop-casted samples were placed in a temperature-controlled stage (Linkam, HFS600E).
The current-voltage (I–V) characteristics were recorded in the sensor stage in argon atmosphere (20 ml/min) using a Keithley 2401 Source meter in a four-probe configuration.
Kelvin probe measurements coupled with ambient pressure UV photoelectron spectroscopy.—Kelvin probe measurements were per- formed using the KP Technology APS04 instrument.38 As the first step, the Fermi level of the 2 mm in diameter gold alloy-coated tip was determined by measuring the Fermi level of a silver reference target (EFermi, Au tip= −4.72 eV). The oxyhalide samples were drop- casted on an aluminum sample mount from a dispersion (c=5 mg cm−3in isopropanol). The tip was vibrated over the sample surface at a fixed height (∼1 mm) and amplitude (0.2 mm), with a constant frequency (70 Hz). Contact potential difference (CPD) was measured between the sample and the Kelvin probe tip after electric equilibrium was reached.
Ambient pressure UV photoelectron spectroscopy (APS) measure- ments were performed with a stationary Kelvin-probe tip. The sample surface was illuminated with a 4–5 mm spot-size, variable energy UV light source (λ=180 nm–340 nm). The UV light generates an electron cloud from the semiconductor if the energy of illumination is higher than the valence band energy (EVB). Under atmospheric conditions secondary ions form (such as N2−, O2−). These ions are collected by the Kelvin-probe tip, thus a current is measured. In the case of semi- conductors, there is a cube-root dependence between this current and the excitation energy.38TheEVBwas determined as the intersection of the baseline and the rise in the cube root of the photoemission.
Electrode preparation for PEC measurements.—All samples were dispersed in isopropanol (c=5 mg cm−3) by ultrasonic treatment for 30 min before spray-coating. The samples were spray-coated on a preheated (140◦C) glassy carbon electrode surface, using an Alder AD320 type airbrush and a homemade spray-coater robot, operated with 1 bar compressed air. The loading of the materials on the electrode surface was around 120μg cm−2. After the spray-coating step, the resulted thin layers were heat treated in an oven at 200◦C for 120 min.
This annealing had a dual purpose: to remove any residual traces of the solvent, and to enhance the adhesion of the spray-coated layers to the underlying electrode surface.
PEC measurements.—All PEC measurements were performed us- ing a Metrohm Autolab PGSTAT302 type potentiostat/galvanostat in a sealed, custom designed one-compartment, three electrodes quartz cell. Glassy carbon electrodes, modified with the various antimony oxide iodide samples were used as working electrode, while a Pt sheet and Ag/AgCl/3 M NaCl were employed as counter, and reference electrodes, respectively. The irradiation source was a 300 W Hg–Xe arc discharge lamp (Hamamatsu L10852). The radiation source was placed 5 cm away from the illuminated working electrode surface and shone through the quartz window of the cell. The output power, reaching the working electrode surface was 180 mW cm−2. The fre- quency of the chopped illumination was 0.1 Hz, while the applied sweep rate was 2 mV s−1. 0.1 M Na2SO4 was used as an electrolyte solution, saturated by Ar for 30 minutes before each measurement.
The gas flow was continuous over the saturated electrolyte during the measurements. Incident photon-to-charge conversion efficiency (IPCE) measurements were performed on a Newport Quantum Effi- ciency Measurement System (QEPVSI-B) in a single compartment, three-electrode quartz electrochemical cell. The wavelength range was 280−500 nm (λ=10 nm resolution). Measurements were per- formed in 0.1 M Na2SO4solution saturated with Ar. Electrodes were held at 1.1 V constant potential during the measurements.
Results and Discussion
Physical and chemical characterization.—Three different anti- mony oxide iodides formed at 320, 450, and 570◦C. Due to increasing oxygen content with the increasing temperature, the color first changed
Figure 1. Raman spectra of the samples: Sb3O4I: red, Sb8O11I2: blue, Sb5O7I: black.
from yellowish to greenish and finally to white in the series of sam- ples (Fig. S1). All antimony oxide iodides have similar Raman bands, which also match literature data (Fig.1and Table S1).39Raman shifts of Sb2O3 (precursor 1) corresponds to the orthorhombic structure,40 while SbI3(precursor 2) has trigonal one (Fig. S2). The Raman shift of Sb3O4I at 65 cm−1 agrees with the antimony iodine vibration, while the shifts at 103 and 298 cm−1belong to the orthorhombic an- timony oxide structure.41In the case of Sb8O11I2, there were similar bands to Sb3O4I, although their intensity increased due to the crystal- lization at a higher temperature. Additionally, new shifts emerged at 218, 270, and 329 cm−1corresponding to the monoclinic structure of oxide iodide. For Sb5O7I, the shift at 148 cm−1belongs to the anti- mony iodine vibration. New shifts also occurred at 456, 482, 601, and 750 cm−1 because of the enhanced crystallinity and the increased oxygen content in the structure.
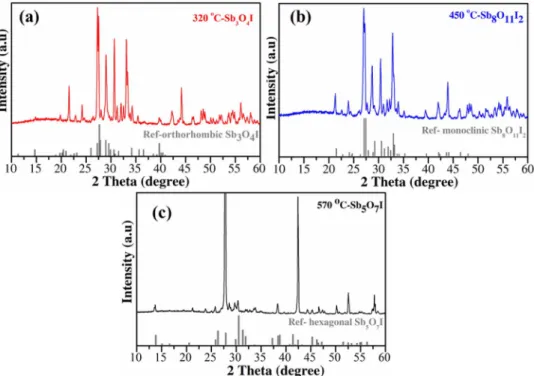
The structure and phase purity of the antimony oxide iodide sam- ples were studied by XRD. The diffraction patterns of Sb3O4I are in-
dexed to the structure of orthorhombic Sb3O4I and monoclinic phase (Fig.2a).42The diffraction of Sb8O11I2 matched with the reference monoclinic phase pure Sb8O11I2 (Fig.2b). Due to the similar ratio of oxide and iodine content of Sb3O4I and (Sb4O5I)×2 (empirical formula: Sb8O11I2), the unit cell of the crystal structure is similar and therefore XRD patterns were analogous, too. Diffraction peaks of Sb5O7I matched with the structure of the well-crystallized hexagonal Sb5O7I (Fig.2c).43,31EDX results confirmed the chemical purity of the antimony oxide iodides (Fig. S3a), since there were only antimony, iodine, and oxygen in the samples. Based on quantitative analysis (Fig. S3b), the chemical composition of the samples was Sb2.89O4I, then Sb3.45O5.5I (x 2), and finally Sb4.55O7I, which are very similar to the theoretical values (Sb3O4I, Sb8O11I2, and Sb5O7I, respectively).
The thermal stability of the compounds was assessed with thermo- gravimetric analysis (Fig. S4). The decomposition reactions follow the mechanisms listed in TableII. Sb3O4I decomposes in three steps.
The first weight change (about 4%) at 150◦C indicates the sublimation of I2. Then, the second weight loss (about 7%) that occurs at 480◦C demonstrates the sublimation of SbI3.37The third, and largest weight change (75%) represents the sublimation of Sb2O3. The material left (14% of the initial weight) corresponds to antimony (IV) oxide and the supposed mechanism for the whole process is described as Equa- tion 1. The phase-pure Sb8O11I2 decomposed in two steps (4% and 81% weight changes) and at the end, the residual weights around 15%
(Equation 2). The Sb5O7I decomposed in one step (91%) that is de- scribed with Equation 3.44Overall, the main weight losses shifted to slightly higher temperatures with the increasing oxygen content of the samples.
The SEM image in Fig.3adisplays the powder sample of Sb3O4I that consists of micrometer-sized needle-shaped particles.42The in- creased synthesis temperature (450◦C) and the m:n=11:2 molar ratio led to the morphological transformation from needle-shaped to small plate-shaped monoclinic particles of Sb8O11I2(Fig.3b). Finally, the Sb5O7I sample presents larger particles with the hexagonal crystal structure (Fig.3c).43
Surface protonation/deprotonation events are important for elec- trode materials to be studied in proton-coupled electron transfer re- actions. The zeta potential of the antimony oxide iodide particles declines with increasing pH (Fig. 4). Furthermore, the increasing
Figure 2. XRD patterns of antimony oxide iodide references and samples synthesized at 320◦C (a), 450◦C (b) and 570◦C (c) with ratio of m(Sb2O3): n(SbI3)= 8:2, 11:2 and 14:2, respectively.
Table II. The proposed mechanism of the thermal decomposition of the synthesized antimony oxide iodide samples based on the TGA.
Supposing mechanism of the thermal decomposition Eq.
Sb3O4I 2Sb3O4I(s)+0.375 O2→0.25 I2(g)↑ +0.5 SbI3(g)↑ +2.25 Sb2O3(g)↑ +1 SbO2(s) [1]
Sb8O11I2 Sb8O11I2(s)+0.330 O2→0.66 SbI3(g)↑ +3Sb2O3(g)↑+1.33 SbO2(s) [2]
Sb5O7I 2Sb5O7I(s)+0.330 O2→0.66 SbI3(g)↑ +4.25 Sb2O3(g)↑+0.85 SbO2(s) [3]
Figure 3. SEM images of the as-synthesized antimony oxide iodide powder sample a) Sb3O4I, c) Sb8O11I2and c) Sb5O7I.
relative amounts of oxygen in the antimony oxide iodide particles shift the zeta potential gradually to the more negative range, which shows the larger amount of negative charges on the surface. In aqueous media, surface hydroxyl groups can form on the dispersed particles, in this case Sb−OH groups. Depending on the pH of the dispersions, these surface functional groups can be protonated (Sb−OH2+) or de- protonated (Sb−O−), therefore the surface of the particles becomes charged. The negative charge on the surface of the antimony oxide iodide particles is caused by the presence of the≡Sb−O− groups, and its amount is increasing with the pH and the relative amount of the oxygen in the bulk materials, too. The isoelectric point (IEP) was at pH∼3 independently from the relative amount of oxygen in the samples. This piece of data agrees well with the IEP values of dif- ferent antimony oxides (IEP=2.9 for senarmontite (Sb2O3) and IEP
= 3.2 for valentinite (Sb2O3)).45 Finally, the increasing amount of the≡Sb−O−groups as a function of pH and chemical composition results in a higher colloidal stability of the water-based dispersions (see the inserted images in Fig.4).
The above-discussed phenomena can influence the activity of these materials in proton-coupled electron transfer reactions. Among them, hydrogen evolution (2H+ + 2e− = H2), carbon dioxide reduction (CO2+2e−+2H+=CO+H2O), and water oxidation (2H2O→ O2+4e−+4H+) are of particular relevance for solar fuel generation.
These reactions need the presence of either a proton donor or acceptor
Figure 4. The zeta potential measurement result of antimony oxide iodides (at 10 mM Na2SO4and at 25◦C). The inserted photos represent the increasing colloidal stability of the antimony oxide iodides particles depending on their relative amount of oxygen.
component. There are many opportunities to ensure the proton donor component, for instance, with the surface metal−hydrogen (M−H) groups or the carboxyl/carboxylate groups of the cobalt porphyrin complex (CoP−COOH/CoP−COO−).46–48Based on the results of the zeta potential measurements, the antimony oxide iodide particles can behave as proton donors at higher pH values (≡Sb−OH→ ≡Sb−O− + H+), and proton acceptors at lower pH. Thus the PEC behavior of the SbxOyIzlikely depends on the amount of Sb−O−/Sb−OH2+
surface groups, and so on their oxygen content.
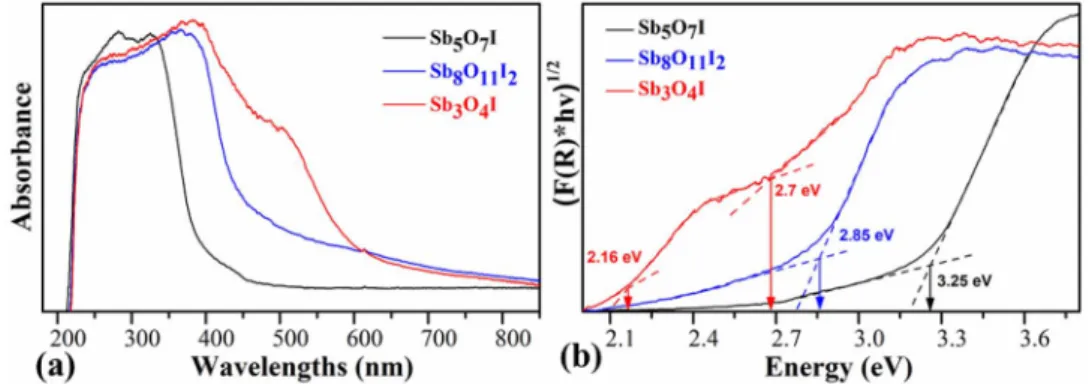
Optical and photoelectrochemical properties.—Diffuse re- flectance UV-Vis spectroscopy was employed to estimate the bandgap values of antimony oxide iodides (Fig.5a). The edge of adsorption has shifted toward the shorter wavelengths by the increasing synthe- sis temperature. Bandgaps of the materials were determined by using the Tauc analysis.49,50The direct bandgap of Sb3O4I, Sb8O11I2 and Sb5O7I are estimated to be 2.16 eV and 2.74 eV, 2.85 eV and 3.25 eV, respectively (Fig.5b). The I–V polarization curves of antimony oxide iodides (Fig.6) show the relationship between the current flow- ing through the compound and the applied voltage. The I–V curve of Sb3O4I is almost linear, indicating a higher conductivity. The resistiv- ity of both the Sb8O11I2and Sb5O7I samples is larger, and they both showed nonlinear I–V characteristics, typical for semiconductors.
Optoelectronic properties of the antimony oxyhalides were further studied by Kelvin probe and APS measurements.38EVBof the three systems were calculated from APS measurements (Fig. S5a–c). The EVBvalues (−5.80 eV for Sb3O4I,−5.63 eV for Sb8O11I2, and−5.11 eV for Sb5O7I) systematically shifted toward more positive energies with the increasing oxygen content in the crystal structure. The density of states plots were also recorded (except for the Sb5O7I sample due to the noise, arising from the small photoemission signal). To determine Fermi levels, CPD measurements were performed (Fig. S6).EFvalues are closer toECB(−4.47 eV for Sb3O4I and−3.89 eV for Sb8O11I2), which suggests n-type semiconducting behavior. Contrastingly, EF
of the Sb5O7I sample is located right in the middle of the bandgap.
Similarly, to theEVBenergies,EFvalues also shifted to more positive energies by the increasing oxygen content. Finally, band diagrams were constructed (Fig.7) from theEVB,EFvalues and the bandgaps, to visualize the effect of the composition on the energetics.
The PEC behavior of the spray-coated samples was investigated by linear sweep photovoltammetry. Bandgap data, determined from the Tauc plots (Fig.5b) suggest that both Sb3O4I and Sb8O11I2can be excited by visible light. Therefore, the first experiments were car- ried out using a solar simulator as a light source (Fig. S7). Only marginal photocurrents were seen in the case of the Sb5O7I sample (EBG=3.25 eV). For the other two materials, however, the photocur- rents were slightly higher. Much better results were achieved using a
Figure 5. Diffuse reflectance UV-Vis spectra of the synthesized antimony oxide iodides (a) and Tauc plots, constructed from the spectra presented in Figure 5a (b).
Figure 6. The characteristic I–V curves of the antimony oxyhalides recorded at 25◦C in argon atmosphere.
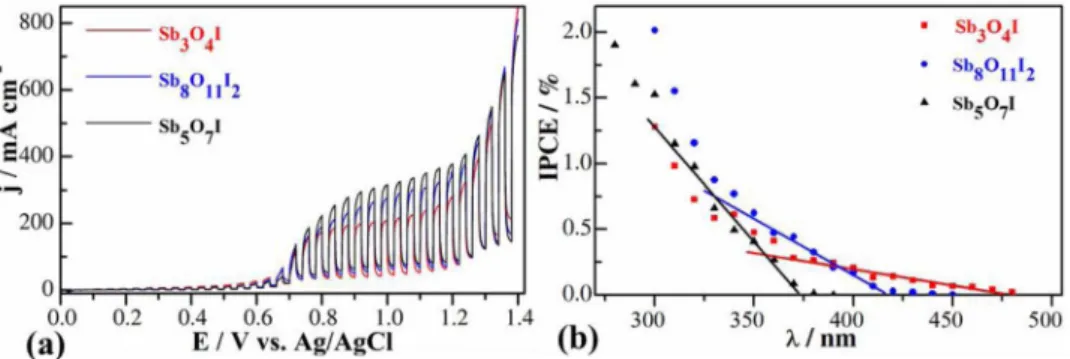
Hg–Xe arc lamp as the light source (Fig.8a). Anodic photocurrents were recorded suggesting an n-type behavior, which is in line with the PEC data of other oxyhalides in the literature.32,51,52The major difference from other oxyhalides reported in the literature is in the magnitude of photocurrents. Considerably higher photocurrents were harvested in this study than in those studies reported in the literature (several hundredμA vs.μA).32,51,52Maximum values were recorded at+1.0 V, at which it reached its stationary value. Importantly, the dark current remained negligible even at this potential. The shape of
the photovoltammograms is similar for all three materials. The pho- tocurrent values, however, gradually increased in the series of samples, reaching the highest value (250μA cm−2) in the case of the Sb5O7I.
Importantly, these photocurrents were obtained without any sacrifi- cial electron donor (hole-scavenger), therefore it describes the water oxidation activity. Fig.8b shows the photoaction spectra, recorded for the various antimony oxide iodides. The characteristics of the three curves are similar, showing relatively low quantum efficiency values (up to 2% in the UV-range). Bandgap values were estimated by fitting a linear to the cutoff region of each curve and extrapolat- ing to the wavelength axis. Bandgap energies of 3.31 eV (Sb5O7I), 2.95 eV (Sb8O11I2) and 2.65 eV (Sb3O4I) were calculated, which all fall close to the ones, obtained from the diffuse reflectance UV-Vis spectra.
Conclusions
This work presented an anhydrous synthesis method for three dif- ferent antimony oxide iodides (Sb3O4I, Sb8O11I2, and Sb5O7I) and studied their PEC properties in a systematic manner for the first time.
The employed synthesis allowed to control the composition of the samples, tailoring the iodide/oxygen ratio in the structure. This rela- tive oxygen content dictated the surface charge of the particles, due to the presence of Sb−O− surface functional groups. The bandgap energy of the materials varied in the range of 2.16 and 3.25 eV, also depending on the oxygen content. PEC measurements illustrated all samples are n-type semiconductors with notable photocurrent values in the water oxidation reaction. Overall, we have shown that these mixed antimony oxide iodides are possible candidates to be employed
Figure 7. Band diagrams, constructed from the contact potential difference and ambient pressure UV photoelectron spectroscopy measurements along with the density of states plots for Sb3O4I (the sub-bandgap is marked with light pink) (a), Sb8O11I2(b) and for Sb5O7I (c).
Figure 8. (a) Linear sweep photovoltammograms recorded for the various antimony oxide iodide samples. A Hg–Xe lamp was used as a light source with a chopping frequency of 0.1 Hz. Measurements were performed in 0.1 M Na2SO4solution applying 2 mV s−1sweep rate. (b) IPCE curves, recorded for the various antimony oxide iodide samples in 0.1 M Na2SO4solution applying E=1.1 V potential.
in solar energy conversion, and their optoelectronic properties can be tailored by controlling the composition.
Acknowledgments
This work was financially supported by the GINOP 2.3.2/2015- 13 project. The authors are thankful to Dr. B´ıborka Jan´aky-Bohner (University of Szeged, Hungary) for her support during the manuscript preparation.
ORCID
Csaba Jan´aky https://orcid.org/0000-0001-5965-5173 Zolt´an K´onya https://orcid.org/0000-0002-9406-8596
References
1. E. Kalamaras, M. M. Maroto-Valer, M. Shao, J. Xuan, and H. Wang,Catal. Today, 317, 56 (2018).
2. L. Wang, J. Zhao, H. Liu, and J. Huang,J. Taiwan Inst. Chem. Eng.,93, 590 (2018).
3. A. F. Lee, J. A. Bennett, J. C. Manayil, and K. Wilson,Chem. Soc. Rev.,43, 7887 (2014).
4. J. Ran, J. Zhang, J. Yu, M. Jaroniec, and S. Z. Qiao,Chem. Soc. Rev.,43, 7787 (2014).
5. M. N. Kaydouh, N. El Hassan, A. Davidson, S. Casale, H. El Zakhem, and P. Massiani,Comptes Rendus Chim.,18, 293 (2015).
6. O. D. Ozinger and N. O. Deutschmann, inUllmann’s Encyclopedia of Industrial Chemistry, (2009).
7. S. Pavasupree, S. Ngamsinlapasathian, M. Nakajima, Y. Suzuki, and S. Yoshikawa, J. Photochem. Photobiol. A Chem.,184, 163 (2006).
8. K. Rajeshwar, M. K. Hossain, R. T. Macaluso, C. Jan´aky, A. Varga, and P. J. Kulesza, J. Electrochem. Soc.,165, H3192 (2018).
9. Z. Wu, Z. Zhao, G. Cheung, R. M. Doughty, A. R. Ballestas-Barrientos, B. Hirmez, R. Han, T. Maschmeyer, and F. E. Osterloh,J. Electrochem. Soc.,166, H3014 (2019).
10. K. Sivula and R. van de Krol,Nat. Rev. Mater., 15010 (2016).
11. A. Thomas, C. Jan´aky, G. F. Samu, M. N. Huda, P. Sarker, J. P. Liu, V. van Nguyen, E. H. Wang, K. A. Schug, and K. Rajeshwar,ChemSusChem,8, 1652 (2015).
12. N. Myung, S. Ham, S. Choi, Y. Chae, W.-G. Kim, Y. J. Jeon, K.-J. Paeng, W. Chanmanee, N. R. de Tacconi, and K. Rajeshwar,J. Phys. Chem. C,115, 7793 (2011).
13. M. Kodera, J. Wang, B. A. Nail, J. Liu, H. Urabe, T. Hisatomi, M. Katayama, T. Minegishi, F. E. Osterloh, and K. Domen,Chem. Phys. Lett.,683, 140 (2017).
14. N. K. Allam, B. S. Shaheen, and A. M. Hafez,ACS Appl. Mater. Interfaces,6, 4609 (2014).
15. T. Varga, H. Haspel, A. Korm´anyos, C. Jan´aky, ´A. Kukovecz, and Z. K´onya,Elec- trochim. Acta,256, 299 (2017).
16. E. A. Bondarenko, E. A. Streltsov, M. V. Malashchonak, A. V. Mazanik, A. I. Kulak, and E. V. Skorb,Adv. Mater.,29, 1702387 (2017).
17. G. Wittstock, S. Rastgar, and S. Scarabino,Curr. Opin. Electrochem.,13, 25 (2019).
18. K. Honda,J. Photochem. Photobiol. A Chem.,166, 63 (2004).
19. K. Rajeshwar,J. Phys. Chem. Lett.,2, 1301 (2011).
20. K. Hashimoto, H. Irie, and A. Fujishima,44, 8269 (2006).
21. B. Buchholcz, H. Haspel, ´A. Kukovecz, and Z. K´onya,CrystEngComm,16, 7486 (2014).
22. L. Shen, Z. Xing, J. Zou, Z. Li, X. Wu, Y. Zhang, Q. Zhu, S. Yang, and W. Zhou,Sci.
Rep.,7, 1 (2017).
23. W. W. Lee, C.-S. Lu, C.-W. Chuang, Y.-J. Chen, J.-Y. Fu, C.-W. Siao, and C.-C. Chen, RSC Adv.,5, 23450 (2015).
24. S. Meng, Y. Bi, T. Yan, Y. Zhang, T. Wu, Y. Shao, D. Wei, and B. Du,J. Hazard.
Mater.,358, 20 (2018).
25. H. K. Timmaji, W. Chanmanee, N. R. de Tacconi, and K. Rajeshwar,J. Adv. Oxid.
Technol.,14, 93 (2011).
26. R. He, D. Xu, B. Cheng, J. Yu, and W. Ho,Nanoscale Horizons,3, 464 (2018).
27. I. Herath, M. Vithanage, and J. Bundschuh,Env. Pollution,223545 (2017).
28. S. A. Adonin, L. A. Frolova, M. N. Sokolov, G. V. Shilov, D. V. Korchagin, V. P. Fedin, S. M. Aldoshin, K. J. Stevenson, and P. A. Troshin,Adv. Energy Mater., 8, 1701140 (2017).
29. X. Y. Chen, H. S. Huh, and S. W. Lee,J. Solid State Chem.,181, 2127 (2008).
30. S. I. Ali and M. Johnsson,Dalt. Trans.,45, 12167 (2016).
31. V. Kr¨amer,Acta Crystallogr. Sect. B Struct. Crystallogr. Cryst. Chem.,31, 234 (1975).
32. L. Yang, J. Huang, L. Cao, L. Shi, Q. Yu, X. Kong, and Y. Jie,Sci. Rep.,6, 27765 (2016).
33. S. Lian Wang, L. Li Wang, W. Hong Ma, D. M. Johnson, Y. Fen Fang, M. Ke Jia, and Y. Ping Huang,Chem. Eng. J.,259, 410 (2015).
34. M. Tamilselvan and A. J. Bhattacharyya,RSC Adv.,6, 105980 (2016).
35. M. Nowak, M. Jesionek, P. Szperlich, J. Szala, T. Rzycho´n, and D. Str´oz,Ultrason.
Sonochem.,16, 800 (2009).
36. A. Han, S. F. Chian, X. Y. Toy, J. Sun, S. Jaenicke, and G. K. Chuah,Res. Chem.
Intermed.,41, 9509 (2015).
37. V. Kr¨amer, M. Schuhmacher, and R. Nitsche,Mater. Res. Bull.,8, 65 (1973).
38. I. D. Baikie, A. C. Grain, J. Sutherland, and J. Law,Appl. Surf. Sci.,323, 45 (2014).
39. M. Y. Valakh, Y. Veshka, G. S. Svechnikov, and Y. P. Kutsenko,Phys. Stat. Sol. B99, 145 (1980).
40. A. Geng, L. Cao, C. Wan, and Y. Ma,Phys. Status Solidi C.,8, 1708 (2011).
41. C. A. Cody, L. Dlcarlo, and R. K. Darlington,Inorg. Chem.,18, 1572 (1979).
42. Z. Hugonin, M. Johnsson, and S. Lidin,Solid State Sci.,11, 24 (2009).
43. I. R. Jahn, W. Altenburger, W. Prandl, and V. Kr¨amer,Acta Crystallogr. Sect. A Found.
Crystallogr.,44, 1028 (1988).
44. S. E. Golunski, T. G. Nevell, and M. I. Pope,Thermochim. Acta,51, 153 (1981).
45. M. Biver and W. Shotyk,Geochim. Cosmochim. Acta,109, 268 (2013).
46. A. J. G¨ottle and M. T. M. Koper,Chem. Sci.,8, 458 (2017).
47. M. N. Jackson and Y. Surendranath,J. Am. Chem. Soc.,138, 3228 (2016).
48. I. Siewert,Chem. - A Eur. J.,21, 15078 (2015).
49. B. Samanta, D. Dutta, and S. Ghosh,Phys. B Phys. Condens. Matter,515, 82 (2017).
50. J. Tauc,Mater. Res. Bull.,3, 37 (1968).
51. X. Liu, Y. Su, Q. Zhao, C. Du, and Z. Liu,Sci. Rep.,6, 28689 (2016).
52. Y. Bai, L. Ye, T. Chen, P. Wang, L. Wang, X. Shi, and P. K. Wong,Appl. Catal. B Environ.,203, 633 (2017).