MTA Közgazdaság- és Regionális Tudományi Kutatóközpont Világgazdasági Intézet
Working paper 240.
February 2018
Éva Ozsvald – S. Shobha Kiran
INDO-JAPANESE RELATIONS ON AN UPWARD TREND
Working Paper Nr. 240 (2018) 1–40. February 2018
Indo-Japanese Relations on an Upward Trend
Authors:
Éva Ozsvald
senior researcher Institute of Economics
Centre for Economic and Regional Studies Hungarian Academy of Sciences email: ozsvald.eva@krtk.mta.hu
S. Shobha Kiran
external researcher Institute of Economics
Centre for Economic and Regional Studies Hungarian Academy of Sciences email: ksubhansp@gmail.com
The contents of this paper are the sole responsibility of the authors and do not necessarily reflect the views of other members of the research staff of the Institute of World Economics, or, of the Institute of Economics,
Centre for Economic and Regional Studies HAS
ISSN 1215-5241 ISBN 978-963-301-660-2
Working Paper 240 (2018) 1–40. February 2018
Indo-Japanese Relations on an Upward Trend
Éva Ozsvald
1- S. Shobha Kiran
2Abstract
The outstandigly positive relationship between India and Japan is a product of the new millennium and a bright spot in the Asia-Pacific, the geopolitics of which region has become increasingly uncertain. A primary reason behind the regional tensions is China’s growing economic and military power combined with her aspiration for dominance over the Indo-Pacific arena. India and Japan both have stakes in maintaining regional stability and creating a truly multi-polar Asia. The booming relationship between the two is thus fuelled by the converging strategic interest to contain China’s assertive behaviour. The security and diplomatic aspects of the Indo-Japanese ties, however, are only one side of the coin. The other is the economic relations which starting from a very low base are now on an upward trajectory as well. This paper analyses several fields of economic interactions. Official development aid (ODA) provided by Japan has been the most successful area of cooperation and was beneficial not only for India’s infrastructure development but also for Japanese companies seeking new opportunities. Foreign direct investments from Japan to India has been growing also steadily but they keep lagging behind those to China and Southeast Asian countries. There are still numerous issues that hold back the dynamics of Indo-Japanese economic relations. Once the ongoing reforms succeed in diminishing the hindering factors, the potential becomes huge given the complementary nature of the two economies. In the medium run, however, the economic relations with China remain more important for both India and Japan.
JEL: India, Japan, ODA, FDI Keywords: F 35, F 50, O 53
1. Introduction
The last decade saw growing geopolitical uncertainties, tensions and mistrust among a number of countries on the Indo-Pacific stage. An ongoing shift in power balances has been taking place in the region, the crucial aspect of which is China’s seeking regional
1 Senior researcher, Centre for Economic and Regional Studies of the Hungarian Academy of Sciences, Institute of Economics, Tóth Kálmán utca 4, H-1097 Budapest, Hungary Email: ozsvald.eva@krtk.mta.hu
2 External researcher, Centre for Economic and Regional Studies of the Hungarian Academy of Sciences, Institute of Economics, Tóth Kálmán utca 4, H-1097 Budapest, Hungary Email: ksubhansp@gmail.com
domination and the recalculation of the Asian strategy on the part of the United States.
Within this context we focus on India and Japan – two major states that have just recently discovered each other. The new-found relationship between India and Japan stands out from among other contemporary bilateral relations by their high-powered diplomacy, multifaceted dynamism and visions for ever-growing cooperation. In India’s Prime Minister Narendra Modi’s words this relationship is characterized by “only good will and mutual admiration”. Both countries recognized that they strategic interest overlap in numerous areas and that the entente in a growing range of political, defence and economic matters could yield substantial benefits for both parties.
What is the chief reason for the remarqueable speed with which the relationship between India and Japan has been developing? Obviously, several factors have contributed but it is an unanimously held view that the main motivation for this rapproachment was the deterioration of the Sino–Japanese relationship3 and the anxity of both India and Japan about China’s economic and military rise and her aspiration to achieve a hegemonic power status in Asia. Although China keeps declaring that her fast growing military capabilities serve only defensive purposes and that strong China is and will be a benign power, many of her neighbours doubt this. Throughout the decades, China, with 14 land and six sea neighbours, has been enmeshed in 23 border disputes.
Many have been resolved, but those with India and Japan have aggravated in recent years.4 Both India and Japan are involved in disputes of maritime rights and interests, issues of territorial sovereignity and other security challenges in the Indian and Pacific Ocean.5 Both states have large stakes in the evolution of a new Asian sekcurity architecture and are commited to playing active role in shaping a more peaceful and stable continent. Japan is being prepared to play a larger role in Asia’s regional matters, and her ambition is encoureged by both the United States (a necessary endorsement) and India. Parallel to this both Japan and the United States support India in becoming a powerful player on the Asian continent.
3 Since 2012 the dispute over the Senkaku/Diaoyu islands is the main issue which triggers hostility between the two nations
4 http://cnninews.com/2017/08/22/india-vs-china-clash-titans/
5 In his excellent book, Jeff Smith summerized the conflict of interests between India and China as follows:
India’s threat perceptions: 1st tier: border dispute, Sino-Pakistan relationship 2nd tier: China’s „String of Pearls”, trade, cyber, water. China’s threat perception: 1st tier: Tibet, Indo-U. S. relationship 2nd tier:
India’s „Look East”policy, Indian military modernization
Thus, it comes as not a surprise that the first line of the cooperation between India and Japan are in the field of defense. The initiatives for security collaboration have been formalized in numerous documents including the 2008 India–Japan Joint Security Declaration and the further elevated India-Japan ‘Special Strategic and Global Partnership’ of 2014. The two countries have been holding regular naval exercises both bilaterally and trilaterally with the USA (e.g. the Malabar drill in the Bay of Bengal in 2016). India imports high-end defence technology, patrol vessels and other weapons from sophisticated manufacturers in Japan. In the whole post-war and post-cold war period it is the first time that Japan lifted the self-imposed restriction on arms sale and supplies miliary equipment to any country. Establishments of Japanese-Indian joint ventures in the defense industry are also underway.6
As summarized above the main driver behind the closer ties between India and Japan is to be found in the realm of security and defense. However, there are other factors at play as well and it is worthwhile to examine them in detail. The unfolding economic engagement between the two countries is particularly noteworthy. This paper is devoted to this very topic and we endeavour to show how the economic relations between India and Japan co-evolved with the other domains of partnership. We shall cover three areas: the issues of the massive development aid coming from Japan to India, the much less impressive and highly unbalanced exchange of goods and the promising upward trend of Japanese FDI inflows in India.
The paper is structured as follows. The next section will describe India’s reforms and economic policy turnaround 25 years ago as a prerequisite for Japanese businesses getting incentivized to seek markets and invest in India. In the third part the geo- strategic considerations of Japanese ODA policies will be discussed and it will be shown how the hundreds of million dollars worth aid loans contributed to the modernization of infrastructure, previously the gravest bottleneck in Indian growth and connectivity.
Next, the reasons for the disappointingly slow development of Indo-Japanese merchandise trade will be explained. The fifth part of the paper deals with the dynamics and the sectoral composition of Japanese foreign direct investments and its beneficial role for both the Indian economy and the Japanese counterpart. The roadblocks which
6https://defence.pk/pdf/threads/to-keep-china-at-arms-length-japan-to-export-arms-to-india.209316/
hinder the expansion of business relations will be also pointed out. The last section elaborates on the complementarities between the two economies and the untapped potentialities they offer.
2. The opening-up of the Indian economy
For more than three decades the economic relations between India and Japan were more or less limited to official development assistance (ODA). Japan had become an aid donor of primary importance for India, while trade and investment relations remained stagnant on a rather low level for a long period. A main reason for this was India’s isolationalist strategy - the inward-looking course of development on which the country had embarked after having gained independence in 1947. Thus, the precondition for the Indo-Japanese economic relations to unfold was that India opened up to the world economy which finally and belatedly started in the early 1990s.
Historically, the statist and autarchic economic policy which the Indian policy makers followed had its own political and economic raison d’etre at the time (Sardana-Zhu, 2017). The Indian government assumed a decisive role by controlling the development of the economy. Centrally planned industrialisation under the leadership of bureaucrats, the expansion of state-owned enterprises, state intervention in labour and capital markets and the tight regulation of businesses were established as the main features of the Indian economy. By the 1970s, the public sector had become the dominant field of the economy and it succeeded integrating private enterprises in pursuing national goals until the end of the Seventh Five-Year plan. “Export pessimism” mentality and the fear from the exploitation by foreign capital prevailed and policymakers were convinced that industrialization based on import substitution policies was what served the Indian national interest the best. To achieve this goal protectionist measures were applied extensively.
The development path of India’s industrialization was in sharp contrast with the policies chosen by Japan in the 1960s and other East Asian countries in the following decades. East Asia, joined by China from the 1980s, emerged as growth engines of the world thanks to their export-oriented growth and opening up to the global investment flows. By the late eighties the development gap between the two parts of Asia had grown
wide. According to evaluations the Indian economy was more closed in 1990 than it was in 1950 (Joshi, 2017) and she continued to be at the bottom of the global investment destinations. As for the Japanese investments, India accounted for less than 1% of Japanese FDI in Asia.
The “Hindu rate of growth” (an expression used for the decades-long 2-3 per cent GDP growth), poverty, technological backwardness, etc. were the price that India had to pay for the wrong belief in the self-reliant, protectionist development.
The recognition of the need for change had come already in the mid eighties.
Followed by action, certain policy reforms were introduced to improve the efficiency of the economy and to attract foreign capital. During the so-called ‘targeted’ deregulation phase, a number of restrictions were partially lifted (e.g., with respect to foreign ownership rules, to bureaucratic procedures, such as production licences, etc.) with the objective of encouraging inward FDI. There were even some export incentive measures applied as IMF also advised India to follow export-promotion strategy for improving the country’s balance of payments position. The partial liberalisation and deregulation policies, however did not change the basic policy stance. The Indian government remained the most important actor in the restructuring of manufacturing industries by identifying ‘national champions’ that would help the expansion and modernisation of key industries (Balasubramanyam and Mahambare, 2003; Mukherji, 2009).
The true reform era started in the early 1990s. The main trigger for the turnaround was the deep crisis of 1991, when the major macroeconomic balances of the country had become unsustainable. Inflation accelerated, fiscal deficit was huge and the current account deficit reached a record level of 10 billion dollars. Foreign currency reserves were depleted and the danger of defaulting on loans was imminent. A fact to illustrate the gravity of the situation: the Indian central bank was forced to physically transport 47 tonnes of of gold to the Bank of England as collateral for a loan.
Like in many other similar cases of crisis stricken emerging economies the International Monetary Fund came to rescue. India concluded a structural loan adjustment agreement with the Fund, one of the main conditions of which was India’s commitment to undertaking profound market oriented reforms. Thus, the Government of India, under the leadership of talented economists and the-then Finance Minister Mr.
Manmohan Singh, launched a package of economic reforms in 1991, popularly referred to as the Liberalization, Privatization and Globalization (LPG) model. In order to decrease the government intervention into the daily life of businesses the dismantling of the “licence-permit raj” was among the firts major steps towards a well-functioning market economy. The private sector was given a larger space to operate which included many fields earlier reserved exclusively for the public sector, such as energy, steel, oil refining and exploration, road building, air transportation, and telecommunications.
With the limitations of the public sector monopoly competion was encouraged across the economy. Deregulation was wide-reaching, including that of the interest rates.
The Indian authorities sought to alter the industrial structure of the country by creating a balance between export-orientation and import-substituting investment through a series of foreign trade and investment liberalization measures such as the abolishing of quantitative restrictions, tariff cuts, lifting of licensing regimes and the raising of investment ceilings.
We can illustrate the volte-face in thinking on India’s exposure to the global economy by quoting from a 1991 speech of Finance Minister Manmohan Singh:”After four decades of planning for industrialization, we have now reached a stage where we should welcome, rather fear, foreign investment. Direct foreign investment would provide access to capital, technology and market”.
The selective investment regime was abandoned in favour of a nationwide implementation of a more open and non-preferential policy framework for FDI. Foreign investment up to 51 per cent was allowed in 34 high priority industries and the concept of phased manufacturing was removed. The exchange rate system was also liberalized.
As outlined above, the LPG reform package's objectives were quite ambitious. In the course of implementation, however, the new rules of the game of the economy have often faced resistance of political and economic interest groups, especially in the early stages of the reforms. Liberalization on many fronts, however, produced remarquable results in relatively short time, which convinced even the skeptics about the positive effects of the transition to a market-oriented and more open economy. Since the late 1990s, India has become one of the the fastest-growing countries across the globe.
Productivity has risen steadily and the world has discovered the large potential offered
by the Indian economy. India is now the number one destination of foreign direct investment, leaving China and the United States behind.
From the point of view of the opportunities offered by the Indian economy, Japan's perceptions have changed similarly to other developed countries seeking new markets for capital investments and exports. However, the typically cautious approach of the Japanese foreign policy and of corporate decision-making also characterized the speed of the development of business relations with India. Throughout the 1990s, Japanese businesses remained focused mainly on China and South-East Asian countries in the region. The upswing in economic relations started since around the mid -2000s. This turn is explained by the implications of shared vision of India and Japan on geo-political and security policy issues in Asia (as explained in the previous section of this paper.)
3. Japanese aid to India
The official development aid (ODA) disbursement from Japan to India began 60 years ago and up till today it has remained the backbone of the economic relationship of the two countries. The Japanese aid –which is dominated by long-term loans on very favourable terms – has significantly contributed to the infrastructural development of India and more recently has also gained importance in the geo-political considerations and moves of both countries.
Since the-mid 2000s India has been receiving the largest or the second largest share from Japan’s overall ODA and for India, Japan has been the most important source of aid for among all donor nations. Before going into the details of the Indo-Japanese bilateral aid flows, first we shall briefly tackle Japan’s aid policies in general.
3.1 The Japanese ODA
In 2016 Japan allocated from the state budget more than $10 billion for overseas aid purposes. Nowdays this sum ranks her among the world’s five largest aid donors. During the 1980s and 1990s Japan was the global number one in this field (the peak year was in
1997), although she remained below the DAG7 average if we compare aid ratios to the GNIs of the respective countries. As for the categories of the aid instruments, they were mostly (over 90 per cent of all external assistance) long-term yen loans.
ODA constitutes an important part of Japan’s foreign policy. Due to historical reasons the military component of Japan’s foreign policy was blocked up to very recently.
Adjusting to this, during the post-war decades Japan’s aspiration was to become a
“civilian power” with strong economic presence in the world (mainly Asian) arena.
Official development aid thus had become a major tool of the Japanese diplomacy in exercising influence on ODA-eligible countries. In fact, since the late 1960s, ODA has become the single most effective foreign policy instrument Japan habitually used in relation with the strategically selected developing countries.
Geographically Japan’s development aid has been heavily concentrated. Almost two- thirds of Japanese ODA went to the Southeast Asian countries and from the 1990s increasingly to China. The foreign policy goal to establish Japan as a major player in Southeast Asia was fittingly supported by her ODA policies. During the longer course of interactions between the donor and the recepient Asian countries strong synergies emerged between aid, trade and foreign direct investment of Japanese private companies. This closely woven network of economic ties produced impressive results contributing to high growth rates and rapid modernization throughout East and Southeast Asia. Concurrently, Japan’s aid policies were beneficial for Japan itself. Japan’s commercial and also her reputational interest were well served by her aid engagement in Asia.
The sectoral analysis of the Japanese ODA loan flows shows that „economic infrastructure” development has been the most preferred target (with transport being the largest subcategory). Regularly, more than 40 per cent of Japanese ODA has been spent on infrastructure-building projects in the receiving Asian countries. We should note here that this pattern significantly deviates from the DAG’s average.
Expert literature on ODA draws attention to the concept of „self-help” to which Japan attaches particular importance. The praise for self-reliant development originates from
7 Development Assistance Group: A forum of OECD countries for consultations among aid donors on assistance to less-developed countries. DAG was established in 1960 and Japan has been a member since then.
Japan’s own success story of catching-up and this is what Japan encourages in the relation with her aid receiving partners. Another characteristic feature is the regular involvement of the Japanese private sector and a close public-private cooperation in various ODA projects.
Throughout the last two decades of the 20th century Japan was counted as an aid superpower. It was during this period that China emerged as Japan’s top recepient of aid and a main commercial partner. Development assistance transactions from Japan to China started in December 1979. Soon Japanese aid had grown to a massive scale and become a pivotal contribution to China’s spectacular growth and modernization. In the 1980’s the yen loans were mostly directed to infrastructure construction projects, such as the building of railways, ports, roads, power stations, etc. In the 1990s the scope was widened to include urbanization related projects (e.g. metro lines in Beijing, water and gas supply, environmental protection etc.) Improved infrastructure was an important factor in enhancing China’s attractiveness as a destination for global FDI, including the investments of Japanese multinational companies. Huge inflows of FDI, in turn significantly contributed to the export success of emerging China.
For two decades the Japanese aid was well appraciated by both parties. The new millennium, however, brought about a downturn in Sino-Japanese political relations and the bilateral aid nexus was also negatively affected. After reaching its peak in 2001 Japanese ODA disbursements to China started to decrease. Finally, in 2007, fast-growing China graduated from ODA eligibility. Since then in place of China India stepped in as the main ODA partner for Japan.
The 21st century brought significant changes in many aspects of Japanese ODA, including its volume, geographical distribution and the underlying norms. After the burst of the bubble economy in the early 1990s Japan has been going through long periods of recession and stagnation with serious imbalances in the economy. Worsening economic conditions and stagnating living standards led to a declining popular support for overseas aid programs perceived by the public as too generous. Queries of domestic pressure groups concerning the effectiveness of the pattern of ODA disbursments have also become more frequent. Reacting to the discontent the Japanese government reduced the outlay on official aid in the budget. It was also in the political interest of the government to make it more explicit that it is not only the receiving partners who gain
from development aid but ODA programs provide ample benefits for Japanese businesses and thus, indirectly for the Japanese people as well.
It was in this spirit that the ODA charter (the main guiding document that outlines the basic priorities for overseas development aid) was revised in 2003. This revision of the 1992 charter was prompted, however, not only by the worsening conditions on the home economy front but also by the shifting and increasingly uncertain international situation.
The most consequential message of the new ODA charter was the even closer than before coordination of Japan’s „security and prosperity” goals (the latter translates into assuring profitable businesses for Japanese firms) with foreign policy. To be sure, the alignment of ODA with commercial interest, national security and other foreign policy issues is not a unique Japanese feature – largely this is the common practice of all donor countries. In the post-2000 era in the case of Japan what could be regarded as a shift in approach was that the previously tacit practice of connecting the business interests of Japanese private firms to foreign aid programs was made clear-cut. The growing self- interest in Japan’s foreign aid policy however, did not mean the abandoning of the conventional aid philosophy, including the contribution to global poverty-fighting and humanitarian aid to the neediest.
In 2015 a new chapter in Japan’s ODA policies was opened. An up-dated charter came into effect under the new title „Development Cooperation Charter” to indicate the new approach of the policy makers. The main goal was to establish procedures which make the disbursement of aid money more efficient by integrating the ODA schemes with both the country’s security strategy and the plans for domestic economic revitalization.
Let us take a quick look at the security and defense aspects of Japan’s foreign policy.
Japan’s first-ever National Security Strategy (NSS) was approved at the end of 2013.
The reason for the increased focus on security issues becomes understandable in the light of the post-2010 events of growing regional tensions (it is suffice to mention here North Korea’s nuclear and missile threat or China’s military build-up and increasingly menacing conduct). Guided by the rather hawkish attitude of prime minister Shinzo Abe and the ruling conservative party, a comprehensive reformulation of defense policy has been taking place. The new defense strategy is proclaimed as a plan for ‘proactive
contribution to peace’. After many decades of post-war low-profile diplomacy and military taboos it has become a priority goal for Japan to take a more active role in ensuring a more secure international environment, especially in the Asian-Pacific region.
The government’s defense strategy explicitly calls for a better and targeted coordination between foreign policy and ODA schemes. As one commentator put it: the goal is to bring together „the “three Ds” of development, diplomacy and defence”. The strategic use of Japanese aid money thus indicates the process of the „securitization of development aid”. Previous ODA guidelines strictly prohibited the use of aid money for militarty purposes. As opposed to those, the 2015 Charter opens the possibilty for using aid for noncombat operations of recepient countries’ armed forces (for such purposes as disaster relief, conflict prevention, coast guard support etc.)
The next sections deal with the short history and the contemporary state of Japan- India ODA relations. Many features of the Japanese development aid to India serve as a supportive example of how the above described changes in the paradigm of Japanese aid-giving policy has been put into practice.
For more for than a decade India has emerged as a major recepient of Japanese development aid. The funds thus received contributed to the higher growth rates of the economy (mainly through infrastructure development), to allievation of poverty (very important in a country where the 30 percent of world’s poor people live) and to the protection of environment. Also, ODA represents the strongest link in the economic cooperation between the two countries and is a vital part of "Japan-India Strategic and Global Partnership" agreement. The security aspects of the relationship between the two countries are gaining more and more importance and numerous ODA financed pojects are devised to support the security element of the cooperation.
3.2 A short history of relations
It has been already for 60 years that India has been a beneficiary of Japanese aid. Back in 1958 India was the first country to receive loan aid from Japan. Throughout the cold war years aid kept flowing (albeit at a relatively low level) even though the diplomatic and economic relation between the two countries were kept low-key and low-priority.
Japan’s main interest in development cooperation was almost exclusively focused on the Eastern and South-Eastern part of Asia.
After 1990 a new era began. The cold war was over and the worldwide transformation of both political and economic relations started deeply affecting both India and Japan. As discussed in the previous chapter, from the viewpoint of the activation of Indo-Japanese relations it was indispensable that the Indian government launched a series of liberalization reforms. Throughout the 1990s, however, cautiousness in the bilateral relations prevailed, which came to be justified by the Indian nuclear test episode. In May 1998 India carried out a nuclear bomb test which aroused a stern condemnation from the side of the international community. Japan was among the strongest critics and put his disapproval into action by imposing economic sanction including freezing her ODA commitments.
It did not take long, however, to switch to an upward trajectory in Indo-Japanese relations. By the end of 2001 economic sanctions were removed and the flow of development aid speeded up. The main reason for this dynamism was the recognition on the part of Japan the increased significance of India as a large emerging actor in the shift of the balance of power in the Asian strategic arena.
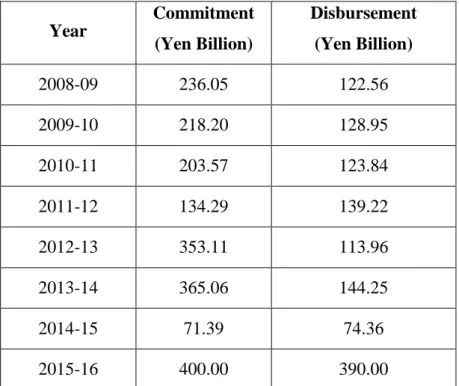
This was also the decade when aid has been gradually reduced to zero for the former largest beneficiary, China. In his thorough analysis Jain (2017) presents the arguments why the „China factor” is the main reason behind India’s becoming the chief destination for Japanese aid. As for the magnitude of the funds, repayments from previous ODA loans served as an additional source for new development expenditures. Jain (2017) also draws attention to the fact that it was India’s policy to be selective regarding the donor countries and loans from Japan were evaluated as the most welcome ones. The value of the Japanese ODA loans which stood at 65 billion yens in 2003 increased by sixfolds in 2016. We should note that almost in each year under consideration there was a difference between the aid commitment and the actual disbursements. The discrepancies nontheless, there continues to be a positive increase in the ODA disbursement levels. (Table 1.)
Table 1. Commitments & disbursements of ODA loans from Japan to India Year
Commitment (Yen Billion)
Disbursement (Yen Billion)
2008-09 236.05 122.56
2009-10 218.20 128.95
2010-11 203.57 123.84
2011-12 134.29 139.22
2012-13 353.11 113.96
2013-14 365.06 144.25
2014-15 71.39 74.36
2015-16 400.00 390.00
Source: Sahoo, P. (2016) and Indian Embassy (Tokyo) websites
3.3 The development of Indian infrastructure
Most of Japanese development aid comes in the form of long term yen loans with very low interest rates and a repayment period of 30 or more years. These typ of aid funds have been earmarked for a wide range of projects. The largest share, however, has been directed to the infrastructure sector in full accordance with the demand of the recepient.
Expanding investment in infrastructure has had a high priority in India’s economic policy. The chronic bottlenecks caused by the inadequacies of transport and power generation impede growth and reduce the attractiveness for FDI. In addition, the
„infrastructure deficit”, i.e. the underdeveloped road and railway networks are regarded as a hindrance to India’s regional integration. Japanese ODA projects have been in line with India’s priority development of infrastructure. There has been a very good correspondence between India’s most urgent development needs on the one hand and the preferences, technological prowess and quality of the Japanese supply.
The number of projects which have been launched in cooperation with the Japanese aid agency and companies are well over hundred. For the last one and a half decade the
Indian transportation sector received the lion’s share of Japanese ODA loans. The funds were used for building subway lines, railways, roads, ports, etc. A most impressive flagship program was the construction of the Delhi metro which has become one of the largest subway networks in the world. The Delhi–Mumbai Industrial Corridor (DMIC), the Bangalore Metro Rail Project, the Western Dedicated Freight Corridor, Mumbai Trans-Harbour Link project, Bihar National Highway Construction etc. are the other important mega-projects on the list. Next on the anvil is a $ 17 billion mega-project, the construction of the 506-kilometer Mumbai-Ahmedabad high speed rail. Japan has agreed to finance the endeavor and to provide her world famous shinkansen technology. The public-private synergies of the ODA programs applies here, too, since numerous big Japanese enterprises, e.g. Kawasaki Heavy Industries Ltd., Hitachi Ltd. and East Japan Railway Co. are business partners in the implementation of the project. Indian manufacturing companies are also involved and are counting on winning conctracts as suppliers. Applauding the shinkansen mega-project the Indian PM. Modi envisages a concomitant economic boom, including the creation of tens of thousands construction and operation jobs8.
4. Bilateral trade relations
In contrast to warm diplomatic relations and generous ODA loans the trade ties between Japan and India have been bordering on insignificant in the whole post-war period. Last year the value of trade between India and Japan was around 14.5 billion USD. This is more than the double of the value that was registered a decade ago but still translates into just a little over 1 percent of India’s share in Japan’s total trade, and just somewhat more on the other side: Japan’s weight in India’s overall exports is 1.77 and in imports 2.58 percent. The exchange of goods and services between the two countries has been much less than one would estimate from the two countries respective shares in global trade. Trade intensity calculations show that the indicators of both India’s exports and imports with Japan are well below 100. The value of India’s export intensity index is significantly lower than India’s import intensity index in Japan’s relation. (Khatoon-
8https://skift.com/2017/09/14/high-speed-rail-in-india-finds-momentum-as-japan-sells-it-shinkansen-tech/
Sharma, 2015). The figures of these very modest trade flows are especially striking when compared to those in relation with China. The volume of Japan-China trade is 13 times bigger than that of between Japan and India, and the Sino-Indian trade is three times more compared to Japan-India trade. The relatively small trade volumes together with the shallow export basket and low competitiveness of India’s exports is especially disappointing in the light of efforts - such as the Comprehensive Economic Partnership Agreement (CEPA) of 2011 - to improve the situation.
The industrial, technological capability and development gap between the two countries is huge and this serves partly as an explanation for the unsatisfactory trade relations. Japan is the world's fourth largest importer and exporter of goods, a veteran trading nation (although with a history of heavy protectionism). India, on the other hand, in spite of her remarkable post-1991 achievements is still in the league of weak players of international trade. A good measure for comparing countries in terms of openness and the degree of trade facilitation is the World Economic Forum’s enabling trade index. According to the ranking based on this index Japan is on the 16th place, while India’s position is No. 102 from among 136 countries. China (India’s frequent comparator) also fares much better than India in all aspects of merchandise exports and integration into the world economy. China has built her success on the development of export-oriented manufacturing industries and openness to foreign direct investment.
This pattern (combined with low wages and supportive exchange rate policies) has led to the increase of the competitiveness of Chinese exports and even more importantly, made China a crucial member in regional and global production networks. During the 1980-1990s China progressed fast on this type of development path, while India had just missed the train of globalization. India’s recognition of the benefits of trade liberalization came late with the big wave of reforms starting in the 1990s (as discussed in the second chapter of this paper) and still continuing today.
India’s relatively poor export performance and the lack of integration into Asian production networks is interlinked with the modest role the manufacturing sector plays in the Indian economy. (Hoda-Rai, 2014). The share of manufacturing9 in India’s GDP has
9 A recent positive change is that the development of manufacturing has become a top priority in India’s economic policy. A „National Manufacturing Policy” plan has been promoted with a target of increasing the share of manufacturing in GDP to 25 per cent by 2025.
been staying around 15 percent, while the service sectors’ output was much more dynamic, accounting for more than the half of GDP growth for the last decades.
The fact that the weight of Indo-Japanese trade lags behind its potential, induced policy makers in both India and Japan to improve the dynamics of bilateral trade by easing tariff restrictions and many of non-tariff barriers as well. The rationale behind striving for a free trade agreement (FTA) was not only the hoping for direct economic benefits from trade creation or reducing the contrast between „hot politics and cold economics”10 but it was also imagined that a faster growing and more balanced Indo- Japanese trade would lead to the reduction of India’s and Japan’s excessive reliance on commerce with China.
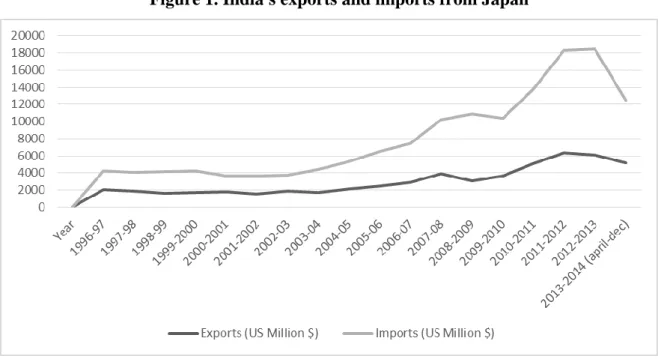
Figure 1. India's exports and imports from Japan
Source: Varma (2016)
In early 2007 a lengthy negotiation process started finally leading to the conclusion of the „Comprehensive Economic Partnership Agreement” (CEPA) which came into effect in August 2011. (From among the OECD countries India has concluded a free tarde agreement only with South Korea and Japan so far, and for Japan it was a first partnership agreement with a BRIC country). The label „economic partnership”
10 A paraphrase of the catchword „cold politics, hot economics” which pertinently describes the present Sino-Japanese relations.
indicated that the agreement aspired for more than just a free trade arrangement. The CEPA directives aimed at not only reducing barriers in merchandise and services trade, but also in investment, in the movement of professionals, and in addition, the document envisaged cooperation in intellectual property rights, procurements and custom procedures, etc.
The core part of the CEPA dealt with the elimination of tariffs on more than 8000 products. This covered 97 per cent of Indian exports to Japan (which included agricultural products, except rice) and 90 per cent of Japanese exports to India and had to be gradually implemented until 2021. According to the calculations at the time of the implementation of CEPA, the Indo-Japanese trade could almost double to $25 billion in three years partially as a result of the trade relaxation measures.
Six years have passed since the implementation of CEPA. The literature on the evaluation of results varies: some empirical works (e.g.Varma 2016) emphasise the trade creation and welfare effects of tariff reductions, while other publications are more negative in their assessment. The majority view is that the extended free trade agreement between India and Japan has not proved to be a game-changer. In the first years of post-CEPA there was a surge in commerce led by India’s imports (Figure 1.), then the yearly bilateral trade fluctuated11 and reached $14.5 billion in 2016, much less than forecasted. The trade intensity indicators have not become stronger and the commodity structure of the bilateral trade has not been significantly affected either.
The composition of Indian exports to Japan (and also to other destinations) has not changed much over the years. India basically exports primary commodities and low value added products whose demands are inelastic. The major export items from India to Japan have been refined petroleum products, chemicals, iron ores, various marine products and jewelries. The products shipped from Japan to India on the other hand, come from completely different categories. Japan has specialised on higher-end manufacturing goods and its exports to India are dominated by capital-intensive intermediate and capital goods, such as machinery, transport equipment, electronic products, steel etc.
11 The bilateral trade fell by 16 per cent between 2013-4 and 2016-17 but to large extent this is explained by the price decreases of petroleum products which are India’s top export items.
The export and import commodity structure of India’s trade with Japan provides a clear indication why it is difficult to induce dynamism in Indo-Japanese commerce. But there are also other reasons why the tariff reductions could not accelerate substantially the exchange of goods between India and Japan. The non-tariff barriers (NTBs) on the Japanese side are one of the culprits. It is not an easy task to estimate the degree of the lingering protectionism in Japan’s trade policies. Japan does not differ much from leading economies on many trade openness measures such as the average tariff rate or the range of import quotas. But while many formal free trade formulas have been properly met, the plethora of non-tariff barriers still impedes or makes the market access difficult. Some hindrances - like high quality controls (among the strickest in the world), often unique technical standards, cumbersome regulations resulting in high transaction costs - are easy to isolate, while other barriers - such as the power of business association, non-transparent cartels, close knit business relations which disadvantage outside suppliers – are inseparably embedded into the insider-oriented Japanese business culture.
There are several documented instances when Indian exporters faced NTBs on the Japanese market. The examples of the pharmaceutical products and the IT services are all the more worth mentioning since they belong to the most competitive branches of Indian exports globally. Yet, the Japanese market seems to be hard to crack: India's share is still a tiny one per cent of total Japanese pharmaceutical market.12 A considerable part of Japan’s high import demand for generic medicines could be potentially met by Indian producers, as it was revealed during the CEPA-negotiations. The realization, however, has not come about yet due to the discrimination among producers, tedious registration process and other regulatory issues and communication problems. (The Economic Times, 2012)
Like the pharma industry, a few branches of services also play a strong role in the overall exports of India. E.g. in IT services India has trade surplus with many developed countries but not so with Japan, indicating the existence of unresolved barriers to trade in this case, too. In an easier trade environment there could be a bigger scope for competitive Indian exporters since India’s exports of IT and IT enabled services to Japan
12 http://www.pharmatimes.com/news/india_presses_japan_over_pharma_trade_barriers_977410
account for only about 1 per cent of Japan’s US$125 billion IT services market (India- Japan CEPA, 2016).
The less than desired performance of the Indian exports is reflected in the balance of trade figures which are showing a growing deficit for India. It has increased from $3.6 in 2010-11 to $5.9 billion in 2016-17. Theoretically, India’s running a trade deficit with developed countries, including Japan, should not be regarded as a problem, given the take-off phase of her industrial development. What is cause for concern is the slowly changing composition of the Indian export basket and the inadequate adjustment to the demand on the Japanese market. Also, there are additional factors which are certain (at least in the medium run) to further widen the trade gap: both the ambitious official development aid projects and the welcome inflows of FDI will accelerate imports from Japan.
The free trade agreement was an undoubtly positive step towards the economic rapproachment between India and Japan. But it was only a small step. The real breakthrough in the Indo-Japanese trade will only come if India’s export structure undergoes profound change in the direction of diversifying commodities and of becoming competitive in higher-end value-added manufacturing exports, new services, all better suited to the Japanese import demand. A significant up-grading of the Indian exports, in turn, requires further accumulation of FDI through which India’s manufacturing becomes integrated into international supply chains. Many more items could be added to the list of requirement to achieve a better export performance of India, including appropriate exchange rate policies, overcoming deficiencies in trade infrastructure and logistics, better marketing strategies for services etc.
The hedging strategy against the economic overdependence on China has not worked out so far. China continues to be a principal trading partner for both Japan and India.
This is more a problem for India because of the rivalry between the two Asian giants and the chronic surplus of Chinese exports in the Sino-Indian trade. Despite policy reforms in India and measures from time to time to discourage Chinese exports (e.g.by imposing anti-dumping duties) the balance of trade is tilted heavily in favour of China.
5. Japanese FDI into India
5.1 Gradual but progressive trends in FDI inflows
Foreign direct investments – initially snail-like in the 1990s but picking up noticeably since the mid-2000s – is a promising chapter in Indo-Japanese economic relations.
Thanks to the liberalization reforms a quarter century ago India adopted an overall welcoming stance toward FDI.13 Also, a new doctrine, the ‘Look East’ (which recently has become “Act East”) strategy was implemented which has been actively promoting greater economic cooperation with East and Southeast Asian countries. As a consequence of these measures, a few Japanese firms which had had already a foothold in India started to extend their corporate engagement either by establishing new production facilities, accompanied by an influx of keiretsu affiliated suppliers (documented for the automobile industry by Horn, Forsans, & Cross, 2010), or by increasing their equity share (Sharma, 1999). By 1998 there were almost 100 new Japanese investment projects. We must emphasise here, however, that during the 1990s the Japanese FDI in Asia was concentrated on China and also, on Southeast Asian countries. Japan saw much more business opportunities in fast-growing China than in India not only for of economic reasons but also because of the “psychological distance”
which included a rather negative view of business conditions there. In those time the role of India as a strategic partner in hedging against China and as a worthwhile destination for FDI that could be one day on a par with China was not even considered.
In 1998 even the modest Indo-Japan economic engagement was endangered for a short time by the Pokhran 2 incident which was a series nuclear bomb test explosions carried out by India. As a response Japan suspended its development aid flows to India and private investments started to decrease as well. Parallel to this, however, numerous incentives and exemptions in the areas of infrastructure, tax and labour laws were given to those Japanese firms who invested in the Special Economic Zones14 (SEZ) of India. As a result, 87 additional investment projects were launched by the end of 2001.
13 India’s cumulative stock of inward FDI increased from only 0.5 per cent of GDP in 1990 to 10.4 per cent today.
14 SEZ are regions/estates that have more relaxed regulations compared to the rest of the country. SEZ is a development tool in the hands of the government to promote rapid growth by using tax and business incentives and providing good infrastructure to attract foreign investment.
The new millennium saw a paradigm shift in Indo-Japanese business relations, including the re-eavaluation of the prospects for Japanese investments in India. The then Japanese PM Yoshiro Mori’s official visit to India in 2000 is often interpreted as a milestone in Indo-Japanese relations. In the rapidly changing security environment the Japanese and Indian governments recognised the strategic significance of the bilateral relationship and started to see their economic ties in a different light accordingly.
Numerous initiatives were launched by both governments to make India a more attractive place for Japanese companies who generally saw India as a high-risk destination for their investments. Several organizations were assigned with the task to promote the willingness of Japanese multinationals to establish subsidiaries in India.
The establishment of the special economic zone Neemrana in Rajasthan is one of the examples. The Neemrana industrial park was created by two government related organizations, the Rajasthan State Industrial Development & Investment Corporation Ltd. (RIICO), and Japan External Trade Organization (JETRO) in 2006.15 This industrial park caters exclusively for Japanese companies who have benefitted from the much better (compared to the outside of the zone) business conditions including uninterrupted power supplies, fast approval processes without paying bribes etc. and the advantages of working together in a cluster. By 2012 14 companies have set up plants in Neemrana, including such global household names as Toyota Motor Corp., Daikin Industries Ltd. and Hitachi Ltd. The plants in Neemrana provide factory jobs for about ten thousand persons.
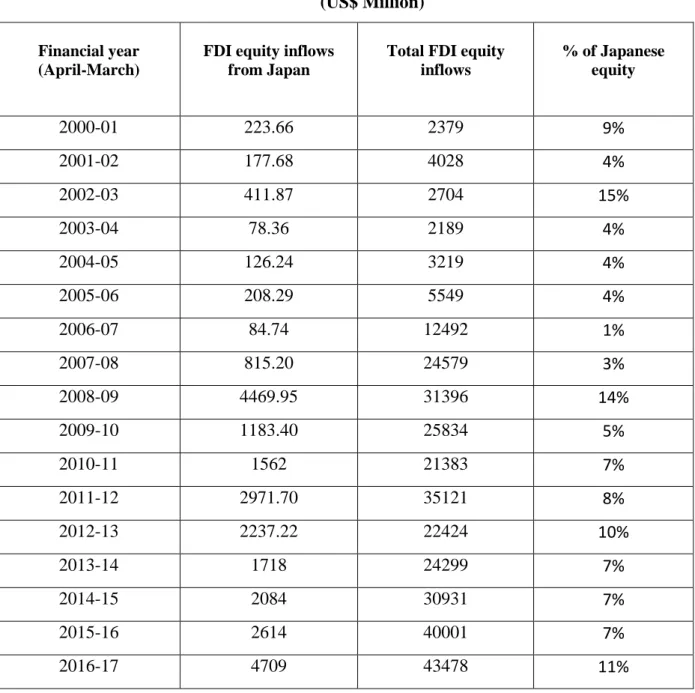
The establishment of further industrial parks and the synergies between ODA projects and private companies’ investments resulted in a surge of Japanese FDI since the second half of the 2000s reaching $4.7 billion last year (Table 2.) In 2014 there were 1209 Japanese firms in India (more than 70 per cent of them joined after 2006) with 3961 business bases and Japan has emerged as the second largest foreign job creator.
15 https://link.springer.com/content/pdf/10.1007%2F978-4-431-55468-4_6.pdf
Table 2. FDI inflows from Japan (financial year-wise) (US$ Million)
Financial year (April-March)
FDI equity inflows from Japan
Total FDI equity inflows
% of Japanese equity
2000-01 223.66 2379 9%
2001-02 177.68 4028 4%
2002-03 411.87 2704 15%
2003-04 78.36 2189 4%
2004-05 126.24 3219 4%
2005-06 208.29 5549 4%
2006-07 84.74 12492 1%
2007-08 815.20 24579 3%
2008-09 4469.95 31396 14%
2009-10 1183.40 25834 5%
2010-11 1562 21383 7%
2011-12 2971.70 35121 8%
2012-13 2237.22 22424 10%
2013-14 1718 24299 7%
2014-15 2084 30931 7%
2015-16 2614 40001 7%
2016-17 4709 43478 11%
Source: Department of Industrial Policy and Promotion -FDI statistics www.dipp.nic.in
5.2 Sectoral and regional distribution of Japanese FDI in India
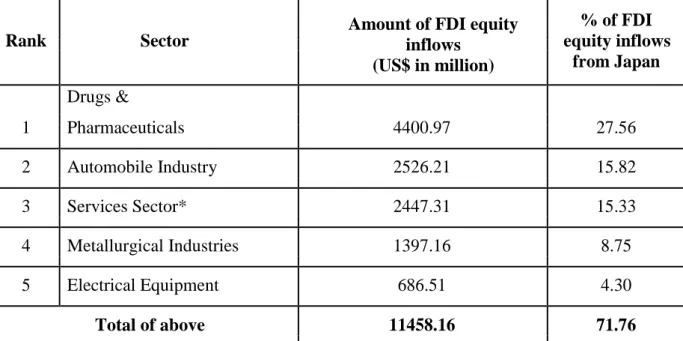
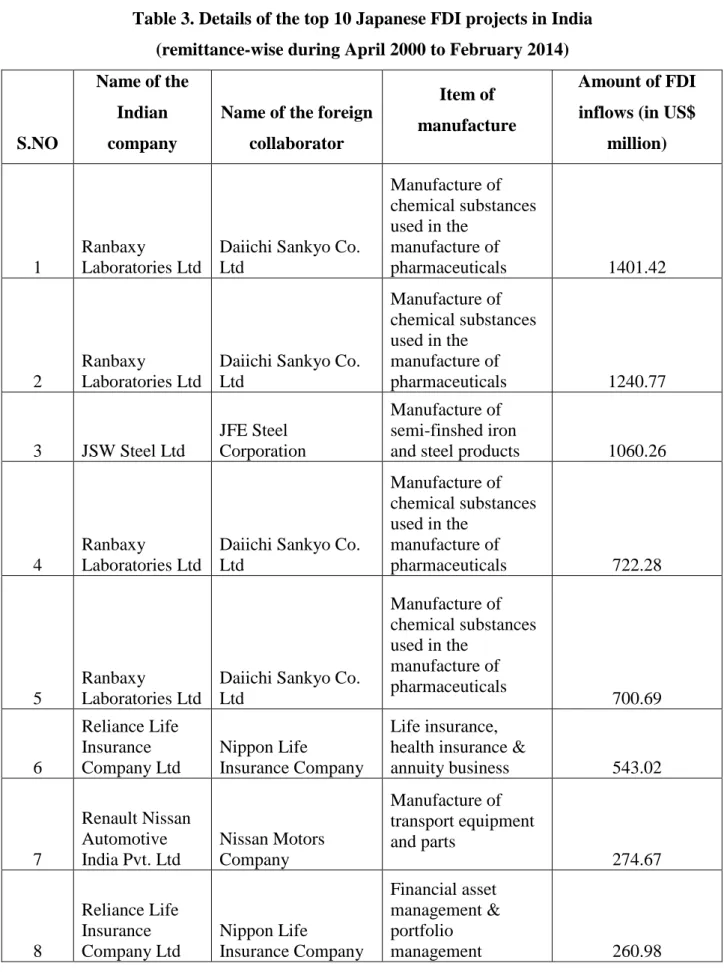
An analysis of sector-wise FDI equity inflows from Japan (Table 3) reveals that from April 2000 to February 2014 the highest FDI equity inflows were in the drugs and pharmaceuticals sectors which accounted for about 28% of total FDI inflows from Japan.
Automobile industry, with almost 16 per cent was in the second place, followed by the service sector with about the same share.
The pharmaceutical industry is a renowned field of the Indian economy. This industry is representing around 10 per cent (in volume terms) or 3.5 per cent (in value terms) of the global pharma industry. India is the largest provider of generic drugs globally and has a considerable potential in research. The Indian pharmaceutical industry has been experiencing a vast inflow of FDI. In 2008 the jump in the Japanese investments in pharmaceuticals was largely due to the sale of stakes of Ranbaxy Laboratories to Daiichi Sankyo, one of the largest Japanese firm in the industry.
Table 3. The share of top sectors attracting FDI equity inflows from Japan (April 2000-Feb 2014)
Amount of FDI equity inflows
(US$ in million)
% of FDI
Rank Sector equity inflows
from Japan
1
Drugs &
Pharmaceuticals 4400.97 27.56
2 Automobile Industry 2526.21 15.82
3 Services Sector* 2447.31 15.33
4 Metallurgical Industries 1397.16 8.75
5 Electrical Equipment 686.51 4.30
Total of above 11458.16 71.76
*Services sector Includes Financial, Banking, Insurance, Non-Financial/Business, Outsourcing, R& D, Courier, Tech. Testing and Analysis.
Source: Department of Industrial Policy and Promotion - www.dipp.ni.in
The automobile sector is among the biggest beneficiaries of Japanese private investments over the past decades. Ever since the Indian government roped in Suzuki Motor Corp. to establish a joint venture automobile firm (Maruti Suzuki) in India in the early 1980s, several other Japanese firms had set up factories there. Honda, Mitsubishi, Toyota and Nissan followed in the footsteps of Suzuki by forming joint ventures with local firms. The boom in the demand for cars and other vehicles was powered by the increase in the levels of disposable income in India and also with easier financial schemes for prospective buyers. Regional wise, the biggest chunks of investment were received by Mumbai (37 per cent) and New Delhi (27 perc cent).
The services sector has a special place in the Indian growth strategy. It is a major contributor to the GDP (55 per cent), and the second largest employer after agriculture.
Services also make up for the largest share of both FDI inflows and outflows (Mukherjee, 2013). Similarly to the car industry related foreign investments, the FDI into services is geographically concentrated around Mumbai and New Delhi. FDI in services sector amounts to 15% of the total Japanese FDI into India. The financial institutions involved are Nippon Life Insurance, Sumito Mitsui Banking Corporation (which was the first Japanese bank to invest by buying a 4.5 per cent stake in Indjhia’s Kotak Mahindra Bank), Mitsui Sumitomo Insurance Ltd., etc. A recent example of booming financial businesses is the activities of the Nomura’s India Equity Fund. Even in IT services, Japanese made investments in network solutions and software development by moving from being hardware suppliers initially. NTT Data Corporation, EXA Corporation, Turbolinux, and Hitachi Data Systems are the major investors in Tier I cities of India.
Table 3. Details of the top 10 Japanese FDI projects in India (remittance-wise during April 2000 to February 2014)
S.NO
Name of the Indian company
Name of the foreign collaborator
Item of manufacture
Amount of FDI inflows (in US$
million)
1
Ranbaxy
Laboratories Ltd
Daiichi Sankyo Co.
Ltd
Manufacture of chemical substances used in the
manufacture of
pharmaceuticals 1401.42
2
Ranbaxy
Laboratories Ltd
Daiichi Sankyo Co.
Ltd
Manufacture of chemical substances used in the
manufacture of
pharmaceuticals 1240.77
3 JSW Steel Ltd
JFE Steel Corporation
Manufacture of semi-finshed iron
and steel products 1060.26
4
Ranbaxy
Laboratories Ltd
Daiichi Sankyo Co.
Ltd
Manufacture of chemical substances used in the
manufacture of
pharmaceuticals 722.28
5
Ranbaxy
Laboratories Ltd
Daiichi Sankyo Co.
Ltd
Manufacture of chemical substances used in the
manufacture of pharmaceuticals
700.69
6
Reliance Life Insurance Company Ltd
Nippon Life
Insurance Company
Life insurance, health insurance &
annuity business 543.02
7
Renault Nissan Automotive India Pvt. Ltd
Nissan Motors Company
Manufacture of transport equipment and parts
274.67
8
Reliance Life Insurance Company Ltd
Nippon Life
Insurance Company
Financial asset management &
portfolio
management 260.98
9
Anchor
Electricals Pvt.
Ltd.
Matsuhita Electric
Works Ltd Electrical products 341.85
10
Kotak Mahindra Bank Ltd
Sumito Mitsui Banking Solutions
Banking activities including financial
services 303.47
Source: www.dipp.nic.in
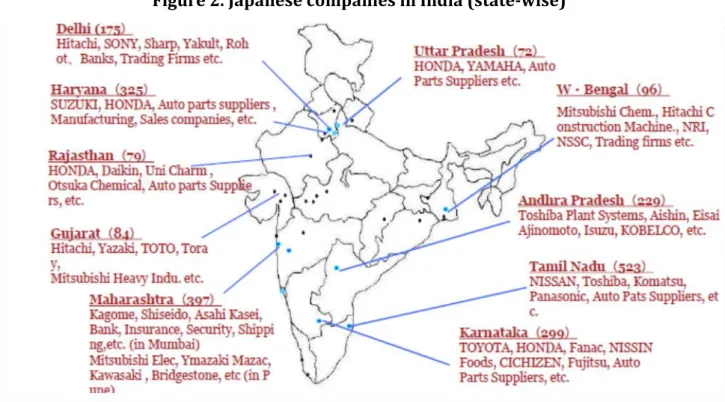
Japanese investments and the related industrial parks traditionally have been spread all over India except for eastern and north-eastern India (Figure 2.) Japanese firms’
favourite location are the National Capital Territory of Delhi (New Delhi) and the states of Maharashtra, Haryana, Karnataka and Tamil Nadu. On the sub-state level, however, we found that Japanese firms exhibited a narrow location spread in terms of engagement with the Indian market. The reasons are the market size (measured by local GDP, labour quality (reflected in higher labour costs), educational attainment, infrastructure quality, proximity to government offices and the presence of SEZs.
Lately increasing importance has been given to the role of the northeast in India’s outreach to Southeast Asia. In connection with the plans of making the northeast “a gateway for Southeast Asia”, president Pranab Mukherjee emphasized that “Considering the huge pool of natural resources and the quality of its human resources, northeast of India has the potential of being an important investment destination and a center for trade and business.”16 In April 2017, the Japan International Cooperation Agency (JICA) signed an agreement with the Union government in New Delhi to provide over
16 https://thediplomat.com/2017/08/japan-is-building-indias-infrastructure/
Figure 2. Japanese companies in India (state-wise)
Source: Survey on the “Number of Japanese Affiliated Companies in India 2013”
$610 million for Phase I of the North-East Road Network Connectivity Improvement Project, which will see the enhancement of constructions such as the national highways in Meghalaya and Mizoram. Of late, north-eastern states like Assam have been engaging with Japan directly and covering broader areas of possible cooperation. Greater Japanese cooperation with India to develop infrastructure and building up connectivity with Southeast Asia through Myanmar and Bangladesh is also a signal to China, namely that Beijing cannot ignore New Delhi’s concerns regarding the China-Pakistan Economic Corridor (CPEC). The CPEC project was objected by India as it involved sovereignty and territorial integrity issues relating to Pakistan-occupied Kashmir.
Acquiring strong local companies through M&As and/or taking up a minority owner’s position were short cuts for Japanese investors to increase their presence in India. The successful examples were the 50 billion yen worth M&A between Panasonic Electric Works and the Indian Anchor Electricals in 2007, the 500 billion yen worth acquisition of Ranbaxy by Daiichi Sankyo in 2008, the 5 billion yen worth acquisition of Camlin by Kokuyo in 201. In addition to these big value deals a number of the Japanese small and medium sized enterprises (SMEs) –up till now accounting only for less than one-fifth of
the total Japanese investments - started expanding their businesses to India in electric machinery, agriculture and food sectors.
We must add one more point to the analysis of the Japanese private investments in India. The Japanese plants in India aim at supplying the domestic market in the first place, thus their exports to sales ratio is still rather low. This characteristics of FDI differs substantially from that of in China and Southeast Asian countries where producing for exports has been a prominent feature of Japanese FDI. Foreign trade and FDI have become thus linked and the re-export from Japanese affiliates has been positively contributing to the trade balance of the respective countries. This pattern can be a candidate for replication in the case of Indo-Japanese relation at least to some extent. The upgrading of India’s manufacturing exports would greatly benefit from the shift of Japanese FDI towards producing more for export markets. There are some positive examples of the changes in this direction, first of all in the car industry. Coined as a pioneer step, two years ago Maruti Suzuki India Ltd. started exporting cars manufactured in India back to Japan. The many dozen export markets all over the world for made-in-India Suzuki cars have been rapidly expanding and it is not an unrealistic expectation that India will soon become a global export base for the Suzuki Motor Corporation. The other renowned Japanese car producer, Honda has also well established plants in India producing high quality engine components and fully- assembled diesel engines. The Honda Car India Ltd. fast-growing export markets include Japan and a number of Southeast Asian countries and the company, similarly to Suzuki, plans to make India a significant export hub for auto components.
5.3 The roadblocks for Japanese investments
Despite the positive development in Indo-Japanese investment relations, we should remain aware of the fact that India was able to attract just 1.5 percent of Japan’s overall foreign direct investment. As for the total accumulated volume of FDI inflows into India for the last one and a half decades, Japan rankes (with a share of 7.5 per cent) fourth after Mauritius, Singapore17 and the UK. Another telling example is that the number of Japanese businesses that operate in India is still less than that in Thailand.
17 Mauritius and Singapore are not the ultimate sources of FDI, since they are mostly used as a route by companies from all over the world.
There are quite a few reasons why Japanese companies have been struggling while doing business in India. According to the information by the Reserve Bank of India, and to numerous media sources, slow-moving and inefficient bureaucracy, red tape18 and the adhoc nature of state-level interventions in business deals are the main reasons for the bad experiences of Japanes firms in managing acquisitions and participating in joint ventures in India. Concrete examples include cases of Toyota Kirsloskar Motors, Sakate and Soyo and a number of others. Language problems are also often cited as a major barrier that restrict interactions between the business representatives of the two countries.
India will become more lucrative for Japanese FDI only when the Indian government successfully combats corruption, increases the transparency of legal requirements and eases the procedural bottlenecks. The poor infrastructural facilities and the delays in upgrading them has led to logistics and distribution difficulties which also have been discouraging for he Japanese investments already for a long time. Road and rail networks, electricity, warehousing are still far from being up to the international standards. The failure to fulfil contractual obligations such as those relating to power and water supply, drainage etc. in the case of industrial parks has also emerged as a frequent issue. It not by chance that foreign investments have been concentrated in the states of Maharashtra, Gujarat, Tamil Nadu, Andhra Pradesh and Karnataka or to be more precise, just in a few cities of these states, such as Mumbai, Ahmadabad, Chennai, Hyderabad and Bangalore - all the places with much better than average infrastructural conditions.
Corruption continues to be a major hindrance to the private investment of the international business community in India, including Japan. According to the Corruption Perception Index of Transparency International (TI), India ranked 79th place out of 176 countries in 2016. The roots of corruption in India can be found in excessive regulations, the lack of transparent laws, complicated tax and licensing systems, too many government departments each with opaque bureaucracy and discretionary powers,
18 A potential electric power project would require 43 central government’s and 57 state government level clearances before stepping into execution. Reportedly, Japanese companies repeatedly asked for simplification and speeding up of procedures for various permissions. (Source: Geethanjali Nataraj, 2010)