dOi: 10.1556/168.2018.19.2.10
Introduction
Several different criteria must be taken into consideration in the design of networks of protected areas. Some of these criteria refer to the representativeness or diversity of species and other conservation features; e.g., species richness, pres�
ence of endemic, rare, endangered or keystone species, habi�rare, endangered or keystone species, habi� species, habi�
tat quality, naturalness, threat level, irreplaceability and main� threat level, irreplaceability and main� main�
tenance of ecosystem and evolutionary processes (Cowling et al. 1999, Rodrigues et al. 2004�. �ther factors relate to hu��. �ther factors relate to hu�
man concerns, such as land ownership, cost of acquisition and maintenance, opportunity cost, aesthetic considerations, po�
tential usefulness for leisure and scientific acti�ities� ecos�s�activities, ecosys�, ecosys�
tem services, maintenance of wild relatives or stocks of spe�
cies of economic importance, etc. (Margules and Usher 1981, Stewart and Possingham 2005�. A third category of criteria in�ol�es spatial attributes� that is� the spatial configuration and distribution of protected areas, so as to comprise a coher�
ent reserve network (Margules and Pressey 2000, Williams et al. 2005�. The European Natura 2000 network of protected areas, for example, states ecological coherence as one of its main goals (European Commission 1996�. Some examples
of spatial attributes that have been suggested as important in reserve design are number, shape and size of individual reserves, as well as distance and connectivity among them (Diamond 1975, Williams et al. 2005�.
Connecti�it� ma� be defined as the degree to which the arrangement of reserves (or habitat patches� in the landscape facilitates the movement of organisms among them (Taylor et al. 1993�. Because it is, in principle, easier to move between reserves that are closer together, examining connectivity in many cases automatically includes the question of distance.
The permeability of the surrounding matrix (non�habitat�
will, of course, be of importance also (Prevedello and Vieira 2010�. As natural habitats become increasingly scarce and fragmented, the connectivity between patches becomes more important, because it may often be the only way in which enough habitat can be made available for populations, since individual patches are no longer large enough to meet all of their resource needs (Jordán 2001�. Moreover, exchange of individuals between local populations residing in small habitat patches may be the key factor in keeping them from complete extinction due to environmental stochasticity or genetic
Multi-node protection of landscape connectivity: habitat availability and topological reachability
J. Pereira
MTA Centre for Ecological Research, Danube Research Institute, Karolina út 29, H-1113 Budapest, Hungary.
E-mail: julianapereira.mailto@gmail.com
Keywords: Conservation priorities; Ecological networks; Graph theory; Habitat connectivity; Habitat fragmentation; Multi�
node centrality; Natura 2000; Probability of Connectivity index; Protected Areas; Reserve design.
Abstract: The selection of reserves for biodiversity conservation involves the evaluation of multiple criteria, ranging from rep�
resentati�eness of ecological features to anthropogenic interests and spatial configuration. Among the principal spatial attributes to be considered, connectivity has received particular emphasis in response to the escalating threat of habitat loss and fragmenta�
tion. Connectivity is an intrinsic property of networks. Consequently, we have observed the gradual development of the concept of reser�e networks� enlisting also tools from the mathematical branch of network theor�. Here� we first outline three ke� aspects of reserve selection for connectivity conservation based on network analysis. 1� It may be based on the application of topologi�
cal indices, which take into consideration only the geographical position of the habitat patches, or area�weighted indices, which add a premium to larger patches. 2� It may be done through single�node analysis, where the relative importance of patches is e�aluated indi�iduall�� or with the more efficient multi�node anal�sis� where we search for the optimal group of patches that best complement each other in the role of maintaining connectivity. 3� The goal of the selection may be to avoid fragmentation of the population into isolated portions, or to ensure that reachability is maintained to all habitat patches, including peripheral sites. In previous studies, we had introduced multi�node analysis to the prioritization of reserves, using fragmentation and reachability indices, but these were limited to topology only. Here, we present an improved approach where multi�node prioritization is per�
formed with area�weighted fragmentation. We apply it to 20 bird species in Catalonia, Spain. In comparison with single�node and/or topological fragmentation, we observed here a decentralization of the selected reserve sets: they included not only the main core population, but also secondary clusters of well�connected habitat. This may potentially bring two added advantages to the reser�e network: spreading of risk� and inclusion of a wider �ariet� of local genetic profiles. We propose combining this approach with topological reachability, to account for peripheral populations and maximize accessibility to the entire network.
Abbreviations: dPC–node connectivity value based on PC; PC–Probability of Connectivity index.
erosion (Lande 1988�. While spatial attributes such as size and shape are properties of individual patches, connectivity is an intrinsic property of networks as a whole. Reserve design methods have, since their beginning, considered the planning of reserve systems, rather than only individual protected areas (for example, within the SL�SS debate ('Single large or several small'�; Diamond 1975, Higgs 1981, �vaskainen 2002�. However, approaching the question from a network perspective came only more recently, as connectivity earned center stage in reserve design (Briers 2002, Cabeza 2003, Santini et al. 2016�.
Here� we discuss and briefl � re�iew some aspects of the study of landscape connectivity using graph�based approaches, particularly in the selection of habitat patches to be included in reserve networks. We outline the application of topological (position only� versus area�weighted indices, single�node versus multi�node approaches, and a fragmentation versus reachability�based view of connectivity. We suggest that a focus on multi�node analysis is most recommended, and propose a combination of area�weighted fragmentation with topological reachability. We illustrate the approach applying it to 20 bird species in Catalonia, Spain.
Graph theory and graph-based landscape indices for studying connectivity
The two most common types of spatial data used to model landscapes are vectors (polygons, lines and points� and raster grids. There is, however, a third type of data structure that is especially useful in the study of networks, and therefore of connectivity: the graph (Harary 1969�. Graph theory, also
known as network analysis, has been extensively applied to the study of landscape connectivity, particularly since the paper by Bunn and colleagues (2000�. In landscape graphs, habitat networks are modelled as nodes and links (Fig. 1�.
Usually, the nodes represent habitat patches and the links rep�
resent either physical corridors connecting the patches, or the possibility of dispersal between them. Links in networks can be binary (each pair of patches is either linked or not linked�
or weighted (links have different values, indicating the strength of the connections; see Figure 1b,c�. Link weights indicate some measure of the potential of dispersal between patches, commonly based on Euclidean or least�cost distance.
Networks built in this way are mainly based on landscape structure and refl ect potential connecti�it�� rather than actual realized connectivity (Saura and Torné 2009�, but they can include more specifi c functional aspects. �or example� radio�
tracking, mark�releasing�recapture, or observational data on the actual dispersal pathways used by organisms can be used to increase the realism of the network model, when this information is available (Bunn et al. 2000�. Detailed dispersal data is rare, however, so potential connectivity is often used (Sutherland et al. 2000�. Some studies have demonstrated a good correlation between potential and actual connectivity (see, for example, Awade et al. 2012�. In any case, graphs are a useful modelling approach in studying the connectivity of landscapes. They can be applied and yield helpful informa�
tion even in the absence of detailed biological data, and may actually be used to point out candidate areas where further survey efforts should be concentrated.
�nce the habitat network model is built, there are sev�
eral indices that allow us to quantify the connectivity of the
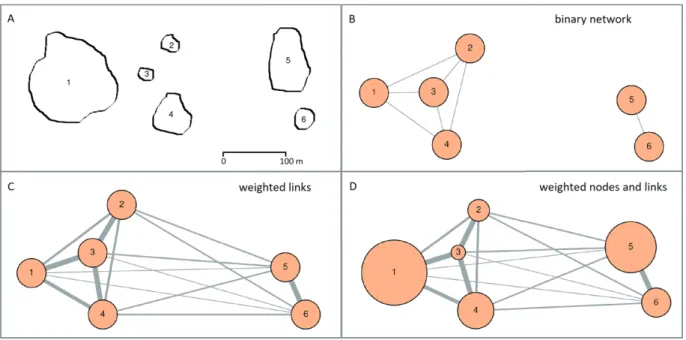
Figure 1. Types of habitat network models. A habitat network with six nodes is shown in A. In B, a binary network was built, consid�
ering as linked only patches that are located less than 100 m apart. In C, a weighted network was built, where all pairs of patches are linked, but link strength depends on the distance: patches located far apart are connected only by weak links. Link weights can cor�
respond, for example, to the probability of dispersal between patches. Topological indices of connectivity perceive networks as shown in B or C. In D, nodes are also weighted, according to their area. Landscape connectivity indices often use weighted nodes, combined with binary or weighted links. Habitat quality, population size and other attributes of interest may be used as node weights instead of (or in combination with� area.
network as a whole (overall connectivity�, as well as the con�
nectivity role of individual patches (node centrality�. Node centrality may be interpreted as the relative importance or influence of each node in terms of how much the� contribute to the connectivity of the network, or how much this connec�is connec� connec�
tivity relies on them (Estrada and Bodin 2008�. Examples of classic centrality metrics are degree, betweenness centrality and closeness centrality. These indices assign values to the nodes based on different definitions or aspects of connecti��
ity. Degree is the number of neighbours of each node; be�
tweenness measures how frequently the node in question is a part of the shortest pathways among other nodes; and close�
ness measures how close the node in question is to all of the other nodes. According to each index, then, we can find out which are the most relevant nodes. These indices were first developed and applied in network and social sciences, and in general take into account only the position of the nodes in the network (that is, their topology�.
In the case of habitat networks, however, the position of the nodes is not the only attribute of interest. As mentioned earlier, several other characteristics of the patches (spatial or other) are �uite signifi cant. �ortunatel�� it is possible to ac� �uite signifi cant. �ortunatel�� it is possible to ac� signifi cant. �ortunatel�� it is possible to ac�significant. �ortunatel�� it is possible to ac�. Fortunately, it is possible to ac�
count for some of them in network models, thus combining criteria of connectivity with other features. With this in mind, a number of indices were developed in landscape ecology that combine the idea of centrality with attributes of the patches.
The most commonly used node attribute in these indices is area extent, because area is an intuitive and well�established proxy for population size. These are then area�weighted indi�
ces. For some of them, area can be promptly substituted by an� other �uantifiable feature� such as habitat �ualit� or actual population size (Saura and Pascual�Hortal 2007�. Using node attributes is equivalent to assigning weights to the nodes, in the same way they are assigned to links (Fig. 1c,d�. Some examples of such indices are the landscape coincidence prob�
ability LCP and integral index of connectivity IIC (Pascual�
Hortal and Saura 2006�, which use binary links with weighted nodes; and the area�weighted flux dAW� (Bunn et al. 2000) and I index (Jordán et al. 2003�, which use weighted nodes and links. Actually, a considerable number of indices was developed, and even though each new development brought in valuable insights, eventually it became a concern to evalu� eventually it became a concern to evalu�ventually it became a concern to evalu�it became a concern to evalu�
ate and compare these indices, narrowing them down, in or�these indices, narrowing them down, in or�, narrowing them down, in or�narrowing them down, in or�in or�
der to offer to users clear guidelines on when and which to use (see, for example, Saura 2010, Baranyi et al. 2011�.
In this context, we highlight two studies that compared several landscape indices and evaluated their performance in detecting different types of habitat loss and correctly as�
signing protection priorities (Pascual�Hortal and Saura 2006, Saura and Pascual�Hortal 2007�. A number of indices were tested, for example, in their ability to point out as more det�
rimental the loss of a larger patch than a smaller one, and the loss of a cutpatch (a loss that leaves the rest of the net�
work completely disconnected� than a non cutpatch. The indices were also required to recognize a decrease in con�
nectivity when the distance between paches increased, and to detect as negative the loss of only part of a patch, among other things. From these investigations, the Probability of
Connectivity index (PC�, having passed the tests, was pro�
posed (Saura and Pascual�Hortal 2007�. The PC is based on the concept of habitat availability, which considers as connected habitat both the amount of area within a patch and the area available via links with other patches, evoking the area and iso�
lation effects from island biogeography theory (MacArthur and Wilson 1967, Hanski 1999�. Therefore, the PC combines patch area (or any other patch attribute of interest� with topology. It uses both weighted nodes and weighted links� and �uantifies the connectivity of the landscape as a whole (overall PC�, as well as the relative values of habitat patches for connectivity (dPC�. Another interesting feature of the PC is that it com�
putes link weights as the probability of dispersal between each pair of nodes when using the most probable path (maximum product probability, Saura and Pascual�Hortal 2007�, which may be direct or indirect. The probability of dispersal takes into consideration the distance between patches as well as the dispersal ability of the species. The maximum product prob�
ability approach increases the reliability of the network model in identifying the most likely paths used by organisms (Hock and Mumby 2015�. Several studies have applied the PC index to the prioritization of areas for protection (e.g., Awade et al.
2012, Santini et al. 2016, Engelhard et al. 2017�.
Single-node vs. multi-node network analysis
When using centrality (topological� or landscape (mostly area�weighted) indices to define which patches are the most important for connectivity, two approaches are possible:
single�node or multi�node analysis. In single�node analysis, the patches are evaluated one by one, receive an individual patch score, and are ranked in order of importance. In multi�
node analysis, instead of taking the patches individually, we look at the whole network and consider which patches work well together, complementing each other, so as to protect the connectivity for the entire network. This is important be�
cause, when we are seeking to protect more than one patch, the top ranked patches in single�node analysis may overlap, rather than complement each other, in their role of protect�
ing the connectivity (Borgatti 2006, Pereira et al. 2017�. For example, in a single�node analysis for degree centrality, the patches with the highest and second rank positions will both have high degree, but they may be located next to each other and be connected to the same exact neighbours, so that, after protecting patch number one, including number two would yield little added value to the reserve network. Instead, it may be more advantageous to choose a patch that has a lower in�
dividual degree, but is located in a different area and is con�
necting different neighbours to each other (Figure 2�. This is the aim of multi�node analysis: to avoid redundancy when multiple nodes are to be protected� so as to define more ef�
ficient priorities.
To perfectly determine the best multi�node key set of n patches to protect in a network, we would need to test all of the possible combinations of n patches, and measure the con�
nectivity value of each. Unfortunately, this means that for net�
works of any considerable size (> 25�30 nodes�, the number of combinations becomes so large that most personal com�
puters are at present unable to deal with the calculations in�
volved in this exhaustive search (Rubio et al. 2015�. To solve this, Borgatti (2006� developed an heuristic search algorithm, the keyplayer� described as follows. It fi rst performs single�
node anal�sis� and defi nes the top ranked n nodes as the initial candidate key set. Then it proceeds to attempt replacing the nodes of the candidate set, one by one, by all of the remaining nodes of the network. Each replacement is performed only if it results in increased connectivity value for the candidate key set. For each node of the candidate set, these replacements are attempted N times (N being the total number of nodes in the network�, constituting one round. Ten rounds are performed in each run of the program. Multiple runs must be performed in order to increase the chances of fi nding the actual best ke�
set. The keyplayer algorithm has recently been implemented in R for multi�node analysis with a number of classic central�
ity indices by An and Liu (2016�. We found it to have good processing performance for networks up to about 150 nodes.
Fragmentation and habitat availability vs. topological reachability
In previous studies, we examined some differences be�
tween two centrality indices in landscape multi�node analysis – fragmentation and m�reach�closeness (reachability� – and compared them with single�node analysis using dPC (Pereira and Jordán 2017, Pereira et al. 2017�. We found that fragmen�
tation centrality and dPC are conceptually similar (Fig. 3a,b�.
Both indices interpret connectivity as the opposite of frag�
mentation� which is the most common defi nition of connec�
tivity in reserve design (Briers 2002, Williams et al. 2005�.
This means that protecting patches defi ned as priorit� b� frag�
mentation centrality or dPC has the goal of preventing the splitting of the population into isolated sub�populations. This type of prioritization is particularly critical for species with limited dispersal ability, because they are naturally more vul�
nerable to fragmentation. Both fragmentation and dPC select primarily patches located in the core areas of the networks, aiming to maintain the core's integrity (Pereira et al. 2017�.
The advantage of dPC over fragmentation centrality is that dPC is an area�weighted index, and it has been tested and ap�
proved as superior to other landscape indices available at the moment, as mentioned above. The dPC was, however, limited to single�node analysis in the case of large networks. Here, we overcome this disadvantage by modifying the keyplayer code in R to perform multi�node analysis with the dPC index (Supplementary Material�.
Turning to reachability centrality, we found that another conception of connectivity, different from fragmentation, is possible. In reachability, the goal is to make sure that all of the current habitat patches are easily accessible, or reachable, to individuals of the population, including the most remote sites (Figure 3c�. This means that protecting patches prior�
itized with reachability centrality aims at guaranteeing that the population will be able to benefi t from its whole habitat network; no patches will be left unused or be impossible to recolonize. �nly species with relatively high dispersal ability are able to profi t from the protection of reachabilit� patches.
The reason for this is that species of limited mobility are usu�
ally unable to reach all of the patches via dispersal, which means that almost all patches must be protected in order to achieve high reachability, defeating the purpose of prioritiz�
ing. (It is important to notice that high or low dispersal abil�
ity are relative notions, depending on the scale of the study and organism movements relative to the average distance between patches�. Reachability sets are composed of patches widely spread throughout the network, in a way that divides the landscape into 'districts of infl uence'. The goal is that each and every habitat site, including the most remote ones, will belong to at least one district and so be connected to the other patches in the same district. Note that the different districts are not necessarily connected to each other; they may repre�
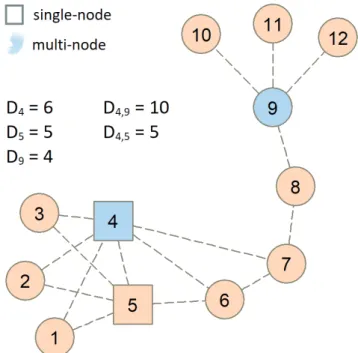
Figure 2. Single�node versus multi�node prioritiza�
tion. The centrality index considered is degree D (number of neighbours�, and two nodes are to be protected. According to single�node analysis, the square nodes are the most important to protect, since they have the highest individual degrees (D4, D5�.
But multi�node analysis points out the pair of darker nodes as the best key set. Although node 9 has a lower individual degree, the darker pair together has a higher degree than the pair 4, 5.
sent separate components of the network, and even separate sub�populations, especially when the entire range of a spe�
cies is being considered in the analysis. In a local or regional scale, the reachability approach may be particularly useful for choosing the best patches for release of individuals in a con�
text of species reintroduction (Pereira et al. 2017�.
Since patches in reachability sets are widely spread, and therefore often located towards peripheral areas, they are generally smaller patches, compared to those picked by fragmentation/dPC prioritization (Pereira and Jordán 2017�.
Consequently, using area weight in the reachability approach might prove counterproductive, since small peripheral patch�
es would tend to be avoided by the algorithm. This possibility arose during preliminary trials, but remains to be thoroughly tested. In a study discussing the importance of core versus pe�
ripheral populations, Safriel et al. (1994� argue that peripheral populations, although patchy and smaller, are of great value as a biogenetic resource to keep species alive through climate change threats, because they are naturally more acquainted with and resistant to challenging conditions. Therefore, in order to avoid underestimating the importance of keeping peripheral patches within reach, we opted to use reachability in its purely topological form. In order to avert prioritization of unreasonably small patches in topological reachability, we suggest simply excluding irrelevant nodes from the analysis.
As a general recommendation, we propose the use of multi�node dPC to secure maximum habitat availability and efficient protection from fragmentation for e�er� species�
complemented by multi�node topological reachability to en�
sure that peripheral populations are also taken into account,
especially in the case of long�distance dispersers. As link weights, we recommend using the maximum product prob�
ability of dispersal as formulated in the PC index. We illus�
trate this method next.
Case study: bird habitat networks in Catalonia Study area and species
The Spanish province of Catalonia, with about 32000 km²� is co�ered chiefl� b� forested and agricultural areas�
and provides diverse habitat for several breeding bird spe�
cies (EEA 2014�. Species distribution data from the Catalan Breeding Bird Atlas (Estrada et al. 2004� were used to model the habitat network of each species. The same 20 species evaluated in Pereira et al. (2017� were considered, in order to make the results comparable (Table 1�. Median natal dis� (Table 1�. Median natal dis� Median natal dis�
persal distances� used to define the weights of the links� were obtained from the literature or estimated with the model by Sutherland et al. (2000�, based on body mass and diet of the species (Bunn et al. 2000, Rubio et al. 2015�. When apply�
ing estimated dispersal distances in this way, it is important to note that any results should be interpreted as generic rec�
ommendation suitable for most taxonomic groups of similar traits� not as species�specific tailored solutions.
Network analysis
For each species, we built a weighted habitat network and identified priorit� areas for connecti�it� using multi�node Figure 3. Multi�node sets of n = 5 patches to be protected in a hypothetical habitat network, according to three indices: A� fragmenta�
tion, B� dPC, and C� reachability. Priority nodes are shown in different colors. Topological indices (A,C� take into consideration only the position of the nodes, while the habitat availability index dPC (B� takes into account also their area. Fragmentation and dPC (A,B�
are conceptually similar, aiming to avoid the splitting of the network into separated parts. Both select primarily nodes in the core of the network, but dPC gives preference to larger nodes. Reachability (C� aims to ensure all nodes are accessible, by dividing the network into ‘districts of influence’ and selecting one node in each district.
Fi: fragmentation centrality, PC: overall probability of connectivity, dPC: node importance based on PC, Ri: reachability centrality, n: number of nodes, pij*: maximum product probability of dispersal between nodes i and j, ai: area of node i, AL: area of the landscape.
analysis with dPC and reachability. All contiguous areas of occurrence (with different sizes� were considered habitat patches, corresponding to the nodes. Habitat patch area was used as attribute (weight� for the nodes in the analysis with the landscape index dPC. The probability of direct dispersal between patches i and j was computed as negative expo�
nential decay, with pij = exp(-kdij), where dij is the distance between patches i and j, and k is a species specific constant defined so that pij = 0.5 corresponds to the median natal dis�
persal distance (Hanski and �vaskainen 2003, Saura and Pascual�Hortal 2007�. We used edge�to�edge Euclidean dis�
tances, but more sophisticated measures, such as least�cost distances, may be equally applied. The links in the networks were then defined as the maximum product probabilit� of dispersal between each pair of nodes pij*, that is, the prob�
ability pijcorresponding to the most probable path between each pair of nodes, whether it be direct or indirect (Saura and Pascual�Hortal 2007�. Euclidean distances were obtained with the Conefor plugin 1.2.1 (Saura and Torné 2009� in Qgis 2.14.1 (QGIS Development Team 2016�. For the reachability keyplayer run, which requires link weights corresponding to distance, we used 1/pij*.
As an example of prioritization of a fixed number of patches� we identified multi�node ke� sets of n = 6 nodes (Pereira et al. 2017�. Ten runs were performed for each species, and for each index. For dPC, all runs returned the same result, for all species. For reachability, there were ties in some cases (different runs returned different key sets, all with the same centrality value�. In such cases, we chose the set with the largest total area as the final set� as a conser�
vative procedure (Pereira et al. 2017�. Multi�node analysis was performed in R 3.2.1 (R Core Team 2016�. For reach�
ability, the keyplayer package was used (An and Liu 2016�.
�or dPC� a modification of the kpset function (An and Liu 2016) was made for this stud�. This modified function finds a multi�node set based on dPC with a defined number n of patches, and computes the dPC value of the key set, the over�
all PC of the landscape, and the single�node dPC values of all patches. Scripts for both analyses are available online with an example dataset (Supplementary Material�. We display combined species maps indicating important areas for each IUCN status (excluding M. monachus, an invasive species�, overlaid with Natura 2000 sites. We show also separate maps with the results for each species, including single�node dPC results for comparison. Spatial analyses were made in Qgis 2.14.1 (QGIS Development Team 2016�.
Results and discussion
For 10 species, single�node and multi�node dPC results were different from each other. In these cases, multi�node dPC patches were less restricted to the main core of the networks (Figure 4 shows three species as an example. See the Supplementary Material for all 20 species. Note that the same comparison holds for topological fragmentation sets, which are similar to single�node dPC – see Pereira et al. 2017�. Multi�node dPC patches were mostly large ones, located at the main core, but also elsewhere, in areas that may function as secondary local cores for the networks (note, for example, the large node at the NE extremity of Table 1. The twenty bird species analysed, with conservation status (IUCN 2017�, total area of occurrence in Catalonia in km² (Area�, percentage of area included in Natura 2000 sites (Natura%�, and median natal dispersal distance in km (MND� with corresponding reference.
Species IUCN Area Natura% MND Reference
Accipiter gentilis Northern goshawk LC 1657.07 35.71 15 Wiens et al. 2006
Aegolius funereus Tengmalm’s owl LC 1028.76 57.11 34.4 Estimated* by Rubio et al. 2015 Alectoris rufa Red�legged partridge LC 23284.05 23.15 1.4 Meriggi et al. 2007
Anas platyrhynchos Mallard LC 10939.43 15.21 11.88 Estimated*
Aquila fasciata Bonelli's eagle LC 791.64 67.20 107.1 Hernández�Matías et al. 2010
Ardea purpurea Purple heron LC 1396.44 18.64 37.52 Estimated*
Calandrella brachydactyla Greater short�toed lark LC 773.38 22.49 0.94 Estimated*
Coracias garrulus European roller LC 923.63 27.93 8.9 Estimated*
Corvus corax Common raven LC 20086.96 35.71 8 Estimated*
Dryocopus martius Black woodpecker LC 3790.88 50.75 11.3 Rubio et al. 2015
Fulica atra Eurasian coot LC 739.87 24.66 20.56 Estimated*
Gypaetus barbatus Bearded vulture NT 1976.73 62.28 47.1 Donazar et al. 1993 Ichthyaetus audouinii Audouin's gull LC 554.53 21.46 26.96 Estimated*
Lophophanes cristatus European crested tit LC 24506.40 31.76 1.15 Rodriguez et al. 2007 Myiopsitta monachus Monk parakeet LC 643.82 2.77 1.2 Martín and Bucher 1993 Neophron percnopterus Egyptian vulture EN 1086.29 37.8 20 Elorriaga et al. 2009 Phalacrocorax aristotelis European shag LC 27851.00 58.54 0.32 Barlow et al. 2013
Sylvia undata Dartford warbler NT 13381.89 35.99 0.67 Estimated*
Tetrao urogallus Western capercaillie LC 1126.31 66.99 5 Rubio et al. 2015
Tetrax tetrax Little bustard NT 1083.79 44.29 46.27 Inchausti and Bretagnolle 2005
*MDN values calculated with the model by Sutherland et al. (2000�, which estimates median dispersal distance based on the body mass and diet of the species.
the map, in Fig. 4c�. This indicates that multi�node habitat availability is more decentralized; i.e., if there are multiple clusters of well connected habitat, it will seek to protect all of them. This is interesting because it may result in a larger total area protected, hosting a larger total population, and potentiall� a �ariet� of local genetic profi les� especiall� if the analysis is done considering the global range of the species.
Another advantage of this decentralization is that it balances the pursuit of connectivity with the spreading�of�risk model (den Boer 1968�, which advises „Don't put all your eggs in one basket”, and is particularly relevant for systems subject to disturbance and natural catastrophes (Urban et al. 2009�.
�n the other hand, in habitat networks where only one core area is present (as in our remaining 10 species�, multi�node dPC analysis may return the same results as its single�node counterpart.
Reachability sets included 1�4 nodes that were also selected by multi�node dPC (2 nodes for 9 species, 1 for 5 species, 3 for 4 species, and 4 for 1 species�. Reachability sets were more similar (had more nodes in common� to multi�
node dPC than to single�node dPC selections for 3 species, and equally similar for all the others. The more decentralized character of multi�node dPC (in comparison to its single�
node counterpart� is indeed expected to result in more agreeement with reachability sets, although we have here observed this only in a few cases. Therefore, one potential advantage of the combined methodology we propose is that the protection of secondary network cores by multi�
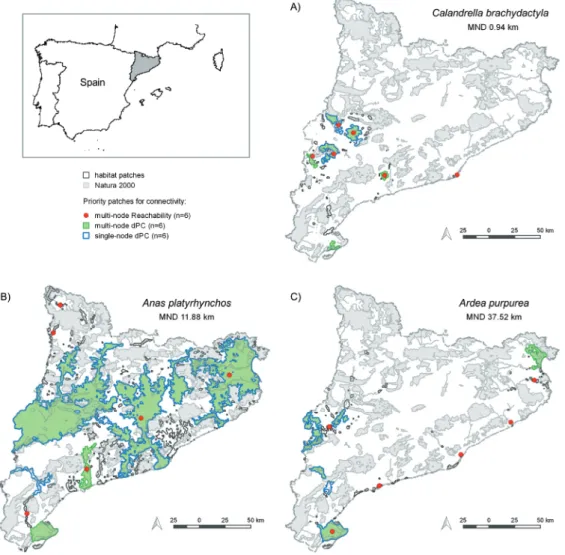
node dPC may contribute to the protection of peripheral populations as well, collaborating to the effectivity of the reachability patches. Reachability centralities of the key sets were lower for low�mobility species; in the example of Figure 4 the values were: 0.24 for C. brachydactyla, 0.82 for A. platyrhynchos, and 0.87 for A. purpurea (at a 0�1 scale)� indicating that the last two can profi t much more from reachability patches.
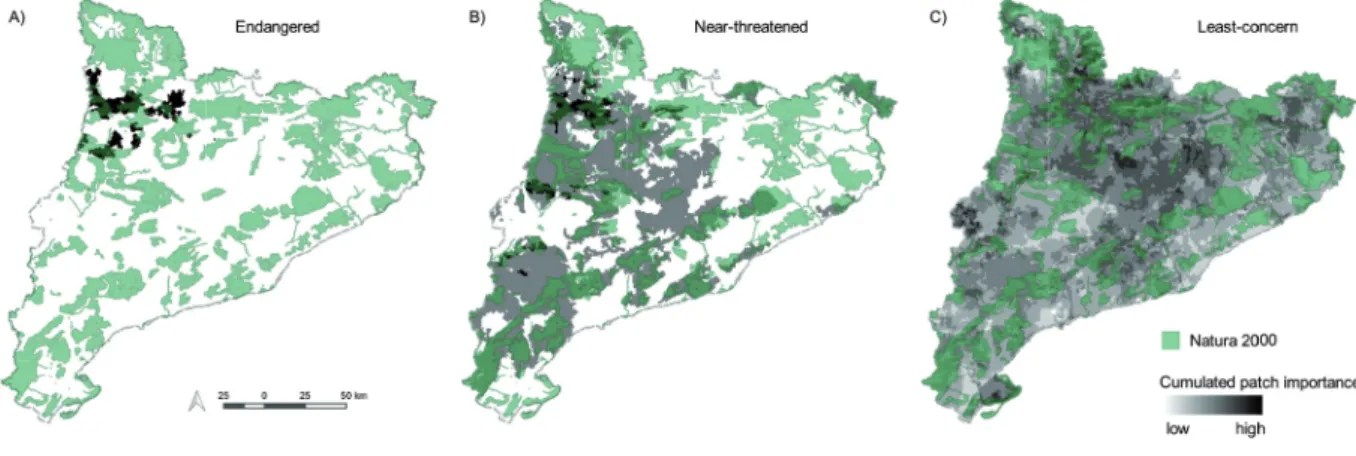
Three regions of the study area appear as key for the pro�
tection of the bird community (Fig. 5�. The area around the southern Pyrenees (Fig. 5a�, dominated by natural and semi�
natural forest, is important for the endangered N. percnop-
Figure 4. Habitat distribution and priority patches of three species of different dispersal ability (MDN: median natal dispersal distance�
in Catalonia, Spain (indicated in the inset map�. The protection of multi�node reachability patches complements multi�node dPC groups by adding accessibility to remote habitat sites. Single�node dPC patches are also shown for comparison. Current Natura 2000 sites are also indicated.
terus, and hosts also key patches for near�threatened species (Fig. 5b�. Most of these patches are at present well covered by Natura 2000 sites (Fig. 5a,b�. An agricultural region in the west part of the province is also highlighted for near�threat�
ened and least�concern species (Fig. 5b,c�. Two other ar�
eas emphasized for multiple species are the centre�NE zone, characterized by extensive agriculture and coniferous forest, and the Ebro Delta, at the coast of the southernmost point of Catalonia (Figure 5c, EEA 2014�.
Conclusions
We have presented an improved multi�node framework for the selection of priority areas to be included in reserve net�
works, in order to maintain habitat connectivity for the inhab�
iting species. This methodology aims to: 1� prevent the frag�
mentation of populations, 2� maintain maximal habitat avail�
ability, 3� avoid redundant efforts in some areas at the expense of others� 4) ensure that species can access and benefi t from their whole habitat network, and 5� promote decentralized protection, including not only main core populations, but also secondary clusters of well�connected habitat and peripheral populations. The approach we suggest is particularly recom�
mended for species or habitat types with patchy distribution.
Different spatial scales may be used for the landscape network model� but� when possible� biologicall� signifi cant boundaries (e.g., global range, partial range that is virtually isolated from others, local range pertaining to a genetically distinct group or particular communit� context) should be preferred to artifi cial administrative boundaries.
Among the spatial criteria widely acknowledged in re�
serve design, connectivity appears to be of particular analyti�
cal complexity. Because loss and fragmentation of habitats is one of the main threats to biodiversity at present, connectiv�
ity is also of central importance. This naturally invites us to think of reserves in terms of networks, where graph�based approaches both uncomplicate the assessment of connectivity and provide a foundation upon which other criteria (biologi�
cal, human or spatial� may be built. A possible perspective in
this direction would be to include additional aspects through the assignment of node weights corresponding to different criteria in turn. In this way, alternative solutions could be compared or combined, while in the background connectivity is always accounted for. Insights and tools from past research with systematic reserve design algorithms could be invalu�
able in this undertaking. We believe that connectivity�centred design of reserve networks in this manner could provide an exciting avenue for future work.
Acknowledgements: The Catalan Breeding Bird Atlas data was provided by the Instituto Catalán de �rnitología (IC��, and gathered with the support of Generalitat de Catalunya and of �bra Social de CatalunyaCaixa. I am very grateful to F. Jordán for invaluable advice throughout the project. S.
Saura is deeply acknowledged for earlier discussions on this topic. I thank A. Endrédi for technical advice, and P. Muñoz and an anonymous reviewer for helpful comments. This work was supported by the National Research, Development and Inno�ation Offi ce – NK�IH� grant OTKA K 116071.
References
An, W. and Y. Liu. 2016. keyplayer: locating key players in social net�
works. R package version 1.0.3. Available at: https://CRAN.R�
project.org/package=keyplayer (accessed 20 May2016�
Awade, M., D. Boscolo and J. P. Metzger. 2012. Using binary and probabilistic habitat availability indices derived from graph theory to model bird occurrence in fragmented forests. Landsc.
Ecol. 27:185–198.
Baranyi, G., S. Saura, J. Podani and F. Jordán. 2011. Contribution of habitat patches to network connectivity: Redundancy and uniqueness of topological indices. Ecol. Indic. 11:1301–1310.
Barlow, E.J., F. Daunt, S. Wanles and J.M. Reid. 2013. Estimating dispersal distributions at multiple scales: within�colony and among colony dispersal rates, distances and directions in European shags Phalacrocorax aristotelis. Ibis 155:762–778.
Borgatti, S.P. 2006. Identifying sets of key players in a social net�
work. Computational and Mathematical Organization Theory 12:21–34.
Figure 5. Priority areas for connectivity for 19 species (excluding the invasive M. monachus� in Catalonia, showing A� endangered (only N. percnopterus�, B� near�threatened (3 species� and C� least�concern species (15 species�. Multi�node selection with dPC and reachability are considered. Areas selected as priority for more species are shown in darker color. Natura 2000 sites are also indicated.
Briers, R.A. 2002. Incorporating connectivity into reserve selection procedures. Biol. Conserv. 103:77–83.
Bunn� A.G.� D.L. Urban and T.H. Keitt. 2000. Landscape connec�
tivity: A conservation application of graph theory. J. Environ.
Manage. 59:265–278.
Cabeza, M. 2003. Habitat loss and connectivity of reserve networks in probability approaches to reserve design. Ecol. Lett. 6:665–
672.
Cowling, R.M., R.L. Pressey, A.T. Lombard, P.G. Desmet and A.G.
Ellis. 1999. From representation to persistence: Requirements for a sustainable system of conservation areas in the species�rich mediterranean�climate desert of southern Africa. Divers. Distrib.
5:51–71.
Den Boer, P.J. 1968. Spreading of risk and stabilization of animal numbers. Acta biotheor. 18:165–194.
Diamond, J.M. 1975. The island dilemma: lessons of modern biogeo�
graphic studies for the design of natural reserves. Biol.Conserv.
7:129–146.
Donazar J.A.� �. Hiraldo and J. Bustamante. 1993. �actors influenc�
ing nest site selection, breeding density and breeding success in the Bearded Vulture (Gypaetus barbatus�. J. Appl. Ecol. 30:504–
514.
EEA – European Environment Agency. 2014. Corine Land Cover 2006 raster data. Version 17 (12/2013�. Available at: http://www.
eea.europa.eu/data�and�maps/data/corine�land�cover�2006�ras�
ter�3 (accessed 25 November 2015�
Elorriaga J., I. Zuberogoitia, I. Castillo, A. Azkona, S. Hidalgo, L. Astorkia, F. Ruiz�Moneo and A. Iraeta. 2009. First docu�
mented case of long�distance dispersal in the Egyptian Vulture (Neophron percnopterus�. J. Raptor Res. 43:142–145.
Engelhard� S.L.� C.M. Huijbers� B. Stewart�Koster� A.D. Olds� T.A.
Schlacher and R.M. Connolly. 2017. Prioritizing seascape con�
nectivity in conservation using network analysis. J. Appl.Ecol.
54:1130–1141.
Estrada, E. and Ö. Bodin. 2008. Using network centrality measures to manage landscape connectivity. Ecol. Appl. 18:1810–1825.
Estrada, J., V. Pedrocchi, L. Brotons and S. Herrando (eds.�. 2004.
Atles dels ocells nidificants de Catalunya 1999–2002. Institut Català d'�rnitologia/Lynx Edicions,Barcelona, Spain. Available at: http://scoc.ornitologia.org/ (accessed 15 February 2016�.
European Commission. 1996. Council Directive 92/43/EEC of 21 May 1992, on the conservation of natural habitats of wild fauna and flora. Eur. Community Environ. Legis 4:81–158.
Hanski, I. 1999. Habitat connectivity, habitat continuity and metapo�
pulations in dynamic landscapes. Oikos. 87:209–219.
Hanski, I. and �. �vaskainen. 2003. Metapopulation theory for frag�
mented landscapes. Theor. Pop. Biol. 64:119–127.
Harary, F. 1969. Graph Theory. Addison Wesley, Cambridge, Massachusetts, USA.
Hernández�Matías, A., J. Real, R. Pradel, A. Ravayrol, N. Vincent�
Martin, F. Bosca and G. Cheylan. 2010. Determinants of territo�
rial recruitment in Bonelli's eagle (Aquila fasciata� populations.
The Auk 127:173–184.
Higgs, A.J. 1981. Island biogeography theory and nature reserve de�
sign. J. Biogeogr. 8:117–124.
Hock� K. and P.J. Mumb�. 2015. Quantif�ing the reliabilit� of dis�
persal paths in connectivity networks. J. Royal Soc. Interface 12:20150013.
Inchausti, P. and V. Bretagnolle. 2005. Predicting short�term extinc�
tion risk for the declining Little Bustard (Tetrax tetrax� in inten�
sive agricultural habitats. Biol. Conserv. 122:375–384.
IUCN. 2017. The IUCN Red List of Threatened Species. Version 2017�2. URL http://www. iucnredlist.org. (Accessed 6 �ctober 2017�.
Jordán, F. 2001. Adding function to structure � comments on Palmarola landscape connectivity. Community Ecol. 2:133–135.
Jordán� �.� A. Báldi� K.�M. Orci� I. Rácz and Z. Varga. 2003.
Characterizing the importance of habitat patches and corridors in maintaining the landscape connectivity of a Pholidoptera trans- sylvanica (�rthoptera� metapopulation. Landsc. Ecol.18:83–92.
Lande, R. 1988. Genetics and demography in biological conserva�
tion. Science. 241 (4872�:1455–1460.
MacArthur, R.H. and E.�. Wilson. 1967. The Theory of Island Biogeography. Princeton Univ. Press, Princeton, NJ.
Margules, C.R. and R.L. Pressey. 2000. Systematic conservation planning. Nature. 405:243–253.
Margules, C. and M.B. Usher. 1981. Criteria used in assessing wild�
life conservation potential: a review. Biol. Conserv. 21:79–109.
Martín� L.�. and E.H. Bucher. 1993. Natal dispersal and first breeding age in monk parakeets. The Auk 110:930–933.
Meriggi, A., R.M.D. Stella, A. Brangi, M. Ferloni, E. Masseroni, E.
Merli and L. Pompilio. 2007. The reintroduction of grey and red�
legged partridges (Perdix perdix and Alectoris rufa� in central Italy: a metapopulation approach. Ital. J. Zool. 74(3�:215–237.
�vaskainen, �. 2002. Long�term persistence of species and the SL�SS problem. J. Theor. Biol. 218:419–433.
Pascual�Hortal, L. and S. Saura. 2006. Comparison and development of new graph�based landscape connectivity indices: towards the priorization of habitat patches and corridors for conservation.
Landsc. Ecol. 21:959–967.
Pereira, J. and F. Jordán. 2017. Multi�node selection of patches for protecting habitat connectivity: Fragmentation versus reachabil�
ity. Ecol. Indic. 81:192–200.
Pereira, J., S. Saura and F. Jordán. 2017. Single�node vs. multi�node centralit� in landscape graph anal�sis: Ke� habitat patches and their protection for 20 bird species in NE Spain. Methods in Ecol. Evol. doi: 10.1111/2041�210X.12783.
Prevedello, J.A. and M.V. Vieira. 2010. Does the type of matrix mat�
ter? A quantitative review of the evidence. Biodivers.Conserv.
19:1205–1223.
QGIS Development Team. 2016. QGIS Geographic Information System. �pen Source Geospatial Foundation Project. URL http://qgis.osgeo.org. (Accessed 25 March 2016�.
R Core Team. 2016. R: A language and environment for statistical computing. R Foundation for Statistical Computing, Vienna, Austria. URL https://www.R�project.org/. (Accessed 2 Setember 2016�.
Rodrigues, A.S.L., H.R. Akçakaya, S.J. Andelman, M.I. Bakarr, L.
Boitani, T.M. Brooks, J.S. Chanson, L.D.C. Fishpool, G.A.B.
da �onseca� K.J. Gaston� M. Hoffmann� P.A. Mar�uet� J.D.
Pilgrim, R.L. Pressey, J. Schipper, W. Sechrest, S.N. Stuart, L.G.
Underhill, R.W. Waller, M.E.J. Watts, X. Yan. 2004. Global gap analysis: priority regions for expanding the global protected�area network. BioScience 54:1092–1100.
Rodriguez, A., G. Jansson and H. Andren. 2007. Composition of an avian guild in spatially structured habitats supports a com�
petition�colonization trade�off. Proc. Royal Soc. B: Biol. Sci.
274(1616�:1403–1411.
Rubio, L., Ö. Bodin, L. Brotons and S. Saura. 2015. Connectivity conservation priorities for individual patches evaluated in the present landscape: how durable and effective are they in the long term? Ecography 38:782–791.
Safriel� U.N.� S. Volis and S. Kark. 1994. Core and peripheral popula�
tions and global climate change. Israel J. Plant Sci. 42:331–345.
Santini, L., S. Saura and C. Rondinini. 2016. Connectivity of the global network of protected areas. Divers. Distrib. 22:199–211.
Saura, S. 2010. Measuring connectivity in habitat mosaics: the equiv�
alence of two existing network indices and progress beyond them. Community Ecol. 11 (2�:217–222.
Saura, S. and J. Torné. 2009. Conefor Sensinode 2.2: A software package for quantifying the importance of habitat patches for landscape connectivity. Environ. Model. Softw. 24:135–139.
Saura, S. and L. Pascual�Hortal. 2007. A new habitat availability in�
dex to integrate connectivity in landscape conservation planning:
Comparison with existing indices and application to a case study.
Landsc. Urban Plan. 83:91–103.
Stewart� R.R. and H.P. Possingham. 2005. Efficienc�� costs and trade�
offs in marine reserve system design. Environ. Model.Assess.
10:203–213.
Sutherland� G.D.� A.S. Harestad� K. Price and K.P. Lertzman. 2000.
Scaling of natal dispersal distances in terrestrial birds and mam�
mals. Conserv. Ecol. 4:16.
Ta�lor� P.D.� L. �ahrig� K. Henein and G. Merriam. 1993. Connecti�it�
is a vital element of landscape structure. Oikos 68:571–573.
Urban, D.L., E.S. Minor, E.A. Treml and R.S. Schick. 2009. Graph models of habitat mosaics. Ecol. Lett. 12:260–273.
Wiens, D.J., R.T. Reynols and B.R. Noon. 2006. Juvenile move�
ment and natal dispersal of Northern Goshawks in Arizona. The Condor 108:253–269.
Williams, J.C., C.S. ReVelle and S.A. Levin. 2005. Spatial attributes and reserve design models: A review. Environ. Model. Assess.
10:163–181.
Received November 6, 2017 Revised March 28, 2018 Accepted April 13, 2018 Supplementary material
The supplementary material is available at www.akademiai.
com and contains: 1� commented R code script with the mod�
ified function for multi�node anal�sis with dPC� 2) comment�
ed R code script with the keyplayer reachability run as used in this study, 3� an example dataset for use with the scripts, 4) map figures of the prioritized habitat patches for single and multi�node dPC and multi�node reachability (as in Fig. 4� for all 20 species.
The file ma� also be dowloaded from https://figshare.
com//9f1da15a2a222ea6d517.