Although Adam Smith (1759) was the first pioneers to analyse how norms, beliefs and culture etc. affect economic development, economists’ interest in the role of institutions has only developed in recent decades.
Recently some institutional economists, such as the Nobel-prize winner Douglas C. North in 1993, claimed that “institutions matter” and are quite important in understanding the broad history of economic growth (North, 1990).
One of the essential facts in the history of economic growth was the Industrial Revolution in Britain. At the beginning of the 1760s a sustained and rapid growth in per capita income occurred all over the word. Exactly, why this change occurred remains one of the key mysteries of economics. Central among the reasons offered is that potentially large one-time costs are involved in the creation of inventions. Examples of this phenomenon could include the production costs of the first prototypes of a steam engine or a computer etc., the infrastructural cost of rewriting national laws, and providing enforcement and other deadweight losses in terms of the differences between real and competitive markets. Basically, as it is accepted by mainstream growth theories, without these transaction costs the innovation (R&D) might not be sustained by inventors after they have created their inventions, unless they have
some expectation of being able to capture some of the gains of efficient allocation in the form of profit (Coase, 1960). Patents and copyrights are legal form of these mechanisms which “…grant investors monopoly power in order to allow them to obtain a return from their inventions.” (Jones, 2001: p. 86.). Intellectual property rights (IPRs) attempt to use legal systems to influence the degree of excludability of ideas. It might be quite easy for someone to “copy” an invention without any existing patents or copyrights. Moreover, the competition arising from this imitation eliminates the incentive for the investor to create the idea in the first place.
However, while the academic literature has claimed that the presence of strong intellectual property rights leads to greater economic growth and that IPRs are essential elements of a well-functioning economy, during the past decades has more attention been devoted in the economic literature to the concept of coercing properties (see Weingast, 1995; Djankov et al., 2002 etc.). Thus, new institutional economic theories – namely those of Williamson (2000) and Boettke et al. (2008) – dealing with levels of institutions and institutional stickiness emphasize the importance of the legal environment in which markets operate.
Their common argument is that the core “informal”
institutions (norms, culture) are fully embodied in the
Máté DoMiciÁn
can intellectual property rights iMpact Directly on proDuctivity:
a case stuDy
in Manufacturing inDustries
According to the institutional economics thesis the role of IPRs is one of the relevant determinants of economic growth in long run. Measures of IPRs have been limited and empirical studies have not been able to evaluate their impacts on productivity growth. The major conclusion that the author can be drawn from his estimations is that the extent to which patent rights and trademarks, ceteris paribus, positively correlated with output per capita depends on the intensity of technology.1
Keywords: intellectual property rights (IPRs), legal environment, productivity
stickiest “formal” exogenous institutions of a society (Figure 1). These include the security of property rights and the rule of law, which have incrementally altered over time in spontaneous and endogenous processes.
In this sense, formal institutions are only beneficial in the presence of particular informal institutions (Williamson, 2009). Meanwhile, Diwan and Rodrik (1991) and Taylor (1994) also revealed that stronger IPRs may enhance global welfare and productivity.
On the other hand, Boldrin and Levine (2002) argued that new ideas should be protected and available for sale and “intellectual property” has come to mean not only the right to own and sell, but also the right to regulate its use. Hence, these institutions create socially inefficient markets and in this case they might be better defined as “intellectual monopolies”. Otherwise, according to Takalo and Kanniainen (2000) the strengthening of pa- tent rights can delay the introduction of new technology to the market, and Bessen and Maskin (2000) also established that patent protection reduces innovation and social welfare.
However, outside these theoretical debates, scholars are commonly interested in examining the impact of formal institutions on economic perfor- mance. Nevertheless, there is currently still quite some disagreement about whether IPRs matter directly for productivity growth and whether strengthening IPRs enhances the international competitiveness of industries. In this sense, these kinds of property rights can impact on productivity directly by affecting the technical efficiency of production as the primary engine of growth.
Since now, very little econometric evidences has been presented because measures of IPRs have been limited and the empirical growth studies have not been able to evaluate the impact on the growth of IPRs such as copyright and trade-marks etc. Gould and Gruben (1996) focused on how this effect depends on the degree of trade openness of different countries, while Ginarte and Park (1997) emphasized that patent rights could stimulate factor accumulation (human and physical
capital), which, in turn, directly influences economic growth. In a related study, Siwek (2000) examined the importance of copyright industries for U.S.
economic growth and found that copyright accounts for employment growth. Focusing on manufacturing industries in OECD countries Park (2003), found that both labour productivity and R&D expenditure increased with IPRs. In a larger sample of countries Kanwar and Evenson (2003) claimed that stronger pa- tent rights were associated with higher R&D intensity (the ratio of R&D expenditure to GDP). Hu and Png (2012) also demonstrated that more patent-intensive industries in these branches responded to stronger patent laws with higher growth, which resulted in increased GDP per capita.
The main purpose of this study is to investigate the direct relationships between IPRs and productivity growth in a sectoral approach. In our empirical research we predict that the correlation between patent rights and productivity, ceteris paribus, depends on the intensity of technology. In other worlds, IPRs give rise to more innovation in high-intensive branches than in less one, and generate more economic growth per capita through Figure 1 Levels of social analysis
Source: Williamson (2000: p. 597.)
Note: arrows represent constraints, and some feedback mechanisms are negligible according to Williamson
new products and services. In our estimations we follow a specific taxonomy to identify the characteristics of productivity growth in different technology-intensive branches over the previous decades.
The rest of this paper is structured as follows. In the next sections we briefly describe the conceptual framework of IPRs with a Cobb-Douglas production function in the manufacturing industries of 14 OECD countries. Then we will demonstrate the results of our regression models with cross-industry panel data in order to investigate how employment, investment and IPRs directly affect productivity growth. The paper ends with some policy implications and conclusions.
However, our motivation is not only to suggest a feasible point of reference for policy makers and the manage- ment of SMEs in order to enhance better productivity growth performance, but also to outline the importance of property protection in a global context.
Databases and a technology-intensive taxonomy
A unique database has been constructed for the analysis of productivity growth in the framework of the EU KLEMS (2003) Project. This project aims to create a database which includes measures of output, employment, capital formation etc. at the industry level for various OECD countries from 1970 onwards. The latest (March 2011) release of the KLEMS (2014) database provides data up to 2007 for a limited set of variables in different industries.
Hence, in our estimations we should expand the given time series of gross value added (GVA) in constant (1995) prices. GVA is a measure used in economics as the value of goods and services produced in an area,
industry or sector and is also equivalent to output (GDP) less intermediate consumption. The numbers of persons engaged in 56 separate industries were calculated and compared in the context of the economic and employment growth performance of each country. In our model specification we also need the share of investment within sectoral output for the OECD countries, which is calculated from the Penn World Table (PWT, 2014), included in Heston et al. (2006).
The industries were separated by the Indicators of activities for Industry and Services, based on ISIC Rev 3. In our estimations we followed a specific taxonomy that was first introduced by Hatzichronoglou (1997) to identify the chief features of output per capita growth tendencies. This approach focuses on technology and distinguishes four different groups ranging from high to low-technology intensive branches. Table 1 lists the classification of manufacturing industries.
Scholars generally work with county specific datasets which are relatively easy to collect and which consist of a large amount of data to reflect the valid relationship between IPRs and economic growth.
A measurement challenge was to quantify the strength of each country’s property rights to track its changes over time and evaluate the strength of the national pa- tent regimes.
One of the popular approaches in the literature substitutes IPRs with composite indices; this was collected by Ginarte and Park (1997) and upgraded by Park (2008). The so-called “GP index” comprised five components, such as (1) extent of coverage of patent protection, (2) membership of international agreements, (3) provisions of loss protection, (4) enforcement mechanisms and (5) duration of protection. Another Table 1 Classification of manufacturing industries into categories based
on R&D intensities
Source: Hatzichronoglou (1997)
High-technology industries Medium-high-technology industries
Aircraft and spacecraft Electrical machinery and apparatus, n.e.c.
Pharmaceuticals Motor vehicles, trailers and semi-trailers
Office, accounting and computing machinery Chemicals excluding pharmaceuticals
Radio, TV and communications equipment Railroad equipment and transport equipment, n.e.c.
Medical, precision and optical instruments Machinery and equipment, n.e.c.
Medium-low-technology industries Low-technology industries Building and repairing of ships and boats Manufacturing, n.e.c.; Recycling
Rubber and plastics products Wood, pulp, paper, paper products, printing and publishing Coke, refined petroleum products and nuclear fuel Food products, beverages and tobacco
Other non-metallic mineral products Textiles, textile products, leather and footwear
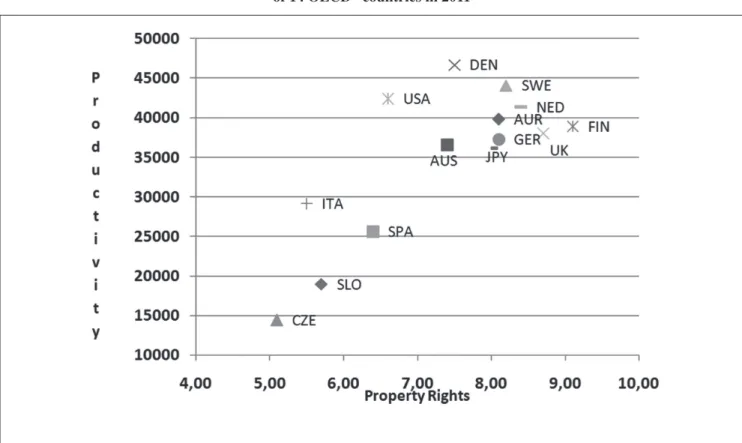
cross-country specific index to proxy the enforcement of property rights and legal systems is the Fraser Institute’s Economic Freedom of the World index which measures three subjective aspects of (1) the legal security of private ownership rights; (2) the viability of contracts and (3) the rule of law (Gwartney et al., 2000). However, in spite of the serious limitations and some methodological critiques related to their subjectivity, scholars have often used these indices to measure national patent regimes. For instance (Figure 2), demonstrates the predicted positive correlation between property rights and output per capita in 14 OECD countries in 2011.
Other researchers – including myself – prefer to use primary datasets to examine the extent to which various kinds of IPRs might explain productivity growth directly. In this approach, the data were taken from the Statistics Database of the World Intellectual Property Organization (WIPO), compiled by WIPO in the processing of international applications through the Madrid and Hague systems. The robustness of our
empirical model specifications will be simultaneously tested by the patent applications to the European Patent Office (EPO) available from the EUROSTAT (2014).
The different kinds of IPRs are considered here as indicators of the total number patent (direct and national phase entries) and trademark applications (direct and via the Madrid system), and also patent applications made to the EPO.
All in all, in both cases, we have an unbalanced pa- nel data for each industry groups of 14 OECD countries to measure the existing relationship between IPRs and GDP per capita in different technology intensive branches.
Conceptual framework
In the neo-classical growth models, developed since their introduction in the 1950s by Solow (1956), no special attention was paid to market institutions.
Basically, it was argued that the growth of physical capital accumulation had an effect on the growth of GDP, while the unexplained residual, labelled To-
Figure 2 The protection of property rights and output per capita
of 14 OECD* countries in 2011
Source: own calculation, based on EFW(2014) and World Bank (2014)
Note: protection of property rights (in a scale of 0 to 10) in the horizontal axis and output per capita in constant 2005 $ prices in the vertical axis,* for AUR, AUS, DEN, CZE, FIN, GER, ITA, JPY, NED, SLO, SPA, SWE, UK, USA.
tal Factor Productivity (TFP), could not be measured directly. This made it possible to introduce institutions into new theories dealing with economic growth. But, contrary to what the neo-classical approach claims, economic growth should be determined within the models rather than being exogenously assumed.
Now, we will begin by reviewing what kind of relationship exists between productivity and institutions. First, we focus on a well-known formalised model specification, promoted earlier by Mankiw et al. (1992), for cross-county data (see Equation 1).
We assume a Cobb-Douglas production function, so production at time (t) can be written as:
(1) The notation is the standard, where (Y) represents output, (K) and (L) are capital and labour accumulation.
Thus, we assume a constant return to scale and the magnitude of (1-α-β) should correspond roughly to the labour income share in total GDP, which is close to 1/3 in most countries. The technical efficiency of production is denoted by (A), and is assumed to be a function of institutional factors such as IPRs. Holding other environmental and institutional factors constant, let
(2) where (IPR) denotes intellectual property rights and (γ) is the elasticity of technical efficiency with respect to the level of IPR. Therefore:
(3) where y=(Y/L), k=(K/L) as output per capita and the reproducible inputs are expressed in terms of efficiency labour units. In efficiency units, the equation of motion is the following:
(4) where (g) and (n) are the rates of growth of tech- nical efficiency and of the labour force. (ik) denotes investment and (δ) the geometric rate of depreciation.
Let ik=sky, where (sk) is the respective savings rate from output. So, in the steady state:
(5) Substituting equations (4) and (5) into equation (1), and taking the logs of both sides of equation (1) and rearranging them yields the steady state level of productivity. So the log income per capita at a given time (t) equals with the following:
Empirical evidence for a sectoral approach In our model specification, the economy tends towards a long run equilibrium. The extent of economic growth generally affects the rate at which per capita out- put approaches its steady state value. Using (equation 6) our regression model assumes the following formu- la, which is tested in each of the different technology intensive sectors:
ln y
it= β
o+ β
1ln( s
k)
t+ β
2ln(n + g + δ)
it+ β
3= ln(patent)
it+
+ β
4ln(trademark)
it+ u
it+ e
itThe dependent variable (yi,t) is the ratio of real GVA per capita of a country (i) for the period (t) at a con- stant price (2005). The first independent variable refers to the share of investment (sk) within sectoral output.
Thus, (n) is the average growth rate of labour in dif- ferent branches and (g)+(δ) are assumed to be constant (0.05), as in Mankiw et al. (1992).
A patent is an exclusive right granted for an inven- tion of a product or a process that provides new techni- cal solutions, and protects for a limited period. Patents are measured here by using a proxy of the total patent applications (direct and PCT national phase entries), as (PTNW) taken from the WIPO (2014) database and by patent applications to the EPO by priority year at the national level, as the variable of (PTNE) from the EU- ROSTAT (2014) database.
A trademark is a characteristic sign, which identi- fies certain goods or services as those which have been produced or provided by a specific person or enter- prise. Over the years these “marks” have evolved into today’s system of trademark registration and protection for consumers, who also identify and purchase a prod- uct and maintain its nature and quality. The variable of trademarks (TRMW) indicates the impact of total trade- mark applications (direct and via the Madrid system) from the WIPO (2014). Finally, (u) is the between and (e) is the within entity error term.
Table 2 represents the corresponding results of our estimations in each sector. The first methodological problem was to identify whether the fixed or random effect regressions should be preferred experimentally.
β α
α − −
= t ( t t)1
t K AL
Y
tγ t
t A IPR aIPR
A = ( ) =
) 1
) (
( γ α β
α − −
= t t
t k IPR
y
k g n i
k. = k +( + +δ)
)
( + +δ
∗ =
g n s y
k k
t t
t k
t s n g IPR
y ln( ) ln( )
) 1 1 ln(
)
ln( δ γ
β α β α β
αα + + +
−
−
− +
−
= −
∗
t t
t k
t s n g IPR
y ln( ) ln( )
) 1 1 ln(
)
ln( δ γ
β α
β α β
α
α + + +
−
−
− +
−
= −
∗
In the random effects model, unlike the fixed effects model, the variation across entities is assumed to be random and uncorrelated with the independent variables included (Green, 2018: p. 183.). However, an advantage of random effects is that the time invariant variables are not absorbed by the intercept.
In the bottom section of this table we also show the results of Hausmann (H) and Breusch-Pagan Lagrange multiplier (LM) tests. The first essentially tests whether the unique errors are correlated with the regressors; the null hypothesis is that they are not. The LM test support a decision between a random effect and a simple OLS regression. The null hypothesis is that variance across entities is zero. In other worlds, there is no significant difference across the units (i.e.
no panel effect). The significance levels of these tests
in all branches suggested that a random effect model specification should be preferred.
As would be expected according to neoclassical growth theories, an increase in the share of investment within output acts pro-cyclically and correlated positively with productivity in our basic models;
however, this is not robust in all of the examined sectors. Lack of significance, in this case, could mean that changing investment does not indicate productivity growth in these branches at a given level of other determinants. Thus, in our results, the attainment of employment growth is negatively related to output per capita in (HT), (MHT) and (MLT) branches. However, if employment increases in the high-technology intensive (HT) branches it might affect productivity growth least of all.
Dependent variable: ln(Y)it Independent
Variables/
Sectors
High (HT) High (HT)
Medium high (MHT)
Medium high (MHT)
Medium low (MLT)
Medium low (MLT)
Low (LT)
Low (LT)
constant 0.607 –3.171 1.419 1.638 2.875 2.221 3.208 3.531
(0,48) (–2,53)** (2,11)** (2,86)*** (4,76)*** (2,07)** (5,41)*** (4,78)***
ln(sk)it 1.645 –0.229 0.93 0.059 0.474 –0.201 0.341 –0.481
(4,66)*** (–0,81) (6,23)*** (0,61) (4,12)*** (–0,88) (3,04)*** (–0,42)
ln(ni+g+δ)t –2.816 –2.278 –1.045 0,312 –1.229 –0.693 –0.196 0,139
(–3,48)*** (–3,8)*** (–2,59)** (1,24) (-3,81)*** (–2,64)*** (–0,66) (0,03)
ln(PTNW)it 0,281 0,004 0,022 –0.053
(3,81)*** (0,16) (0,44) (–0,87)
ln(TRMW)it 0,281 0,118 0,109 0,127
(4,82)*** (3,81)*** (2,03)*** (3,17)***
ln(PTNE)it 0,281 0,314 0,229 0,231
(10,16)*** (14,43)*** (5,29)*** (5,27)***
Observations 347 322 347 322 347 322 347 322
Countries 14
R2 within 0,087 0,584 0,149 0,711 0,120 0,653 0,026 0,707
R2 between 0,012 0,073 0,031 0,074 0,027 0,091 0,018 0,041
R2 overall 0,051 0,091 0,061 0,083 0,049 0,087 0,049 0,035
Wald-test 31,98*** 425,5*** 58,7*** 738,6*** 46,21*** 91,86*** 9,25** 344,12***
Hausman-test 0,994 0,961 0,981 0,934 0,973 0,912 0,985 0,936
LM-test 3086,8*** 2934,9*** 3908,3*** 3366,7*** 3794,1*** 3544,2*** 3850,1*** 3523,51***
Table 2.
Results of random-effect panel regression in each technology-intensive sector, 1980–2007
Source: own calculation, based on EFW(2014), EUROSTAT(2014), KLEMS (2014) and PWT(2014)
Notes: * Heteroscedasticity robust t-statistics are in parentheses. Letters in the upper index refer to significance: ***: signifi- cance at 1 per cent, **: 5 per cent, *: 10 per cent. P-values without an index mean that the coefficient is not significant even at the 10 per cent level.
In order to exemplify the robustness check of our estimations we measured the impact of IPRs on out- put per capita with different proxies in each branch.
Essentially, the effect of patents and trademarks on productivity does not seem to be large in our models.
The coefficients range from circa 0.1% to 0.31%.
However, a 1% increase in the level of patents in (PTNW) results in an increase (0.28%) of productivity in (HT) branches. Nevertheless, trademarks (TRMW) are also positively correlated with productivity growth in both models with existing significant z-statistics.
Thus, as we can demonstrate, the degree of correlation between patent rights and productivity, ceteris paribus, depends on the intensity of the technology in question.
In other worlds, IPRs might generate more economic growth per capita in the high-intensive branches than in less intensive ones. All in all, these results obviously imply the existence of a positive relationship between IPRs and productivity among the examined OECD countries in both sectors.
Conclusion
According to the institutional economics thesis the role of IPRs is one of the relevant determinants of economic growth in long run. Although recently there have been serious theoretical debates which have attempted to explain the impact of institutions and their interactions in terms of how they might influence productivity, no clear consensus has yet emerged and several unanswered problems remained. However, scholars nowadays are commonly interested in examining how these formal institutions matter, as far as the restricted amount of econometric evidence allows. So far, measures of IPRs have been limited and empirical studies have not been able to evaluate their impacts on productivity growth. The major conclusion that can be drawn from our estimations is that the extent to which patent rights and trademarks, ceteris paribus, positively correlated with output per capita depends on the intensity of technology.
The European Union (EU) has developed the Eu- rope 2020 Strategy (EU, 2010) to transform Europe- an countries into a smart, sustainable and inclusive economy that delivers high levels of employment, productivity and social cohesion. In this sense, worldwide competition through innovation means that better valorisation of patents must be considered in a global context to ease the access of SMEs to knowledge markets. It points out that a novel policy option could imply the development of local innovation systems to benefit the EU growth strategy. We can
advise SMEs to enhance the value of their intellectual assets in innovation management and we suggest that their property rights must be protected and enforced better than has previously been the case. The social, economic and environmental benefits etc. of IPRs are only gained through what actions enterprises take to ensure they obtain patents for their inventions of good or services (EC, 2012).
An additional research direction has also emerged in this study. We argue that the institutional economic perspective is relevant since it extends the achievements and existing frontiers of macroeconomic theories. We argue that, related to the results of Novotny (2013), stronger patent rights in developing countries help to secure greater technology transfer in these industries.
Hence, further research in this sectoral approach could be more fruitful.
Endnotes
1 “This research was realized in the framework of TÁMOP 4.2.4. A/2-11-1-2012-0001 »National Excellence Program – Elaborating and operating an inland student and researcher personal support system«. The project was subsidized by the Eu- ropean Union and co-financed by the European Social Fund.”
References
Bessen, J. – Maskin, E. (2000): Sequential Innovation, Patents, and Imitation. Working Paper (01), Cambridge, MA: Massachusetts Institute of Technology
Boettke, P.J. – Coyne, C.J. – Leeson, P.T. (2008): Institutional Stickiness and the New Development Economics.
American Journal of Economics and Sociology, 67(2):
p. 331–358.
Boldrin, M. – Levine, D.K. (2002): The Case Against Intellectual Property. American Economic Review, 92(2): p. 209–212.
Breusch, T.S. – Pagan, A.R. (1979): A Simple Test for Heteroscedasticity and Random Coefficient Variation, Econometrica, 47(5): p. 1287–1294.
Coase, R.H. (1960): The Problem of Social Cost. Journal of Law and Economic, 3(1): p. 1–44.
Diwan, I. – Rodrik, D. (1991): Patents, Appropriate Technology, and North-South Trade. Journal of International Economics, 30: p. 27–47.
Djankov, S. – La Porta, R. – Lopez-de-Silanez, F. – Shleifer, A. (2002): The Regulation of Entry, Quarterly Journal of Economics, 117(1): p. 1–37.
EC (2010): Europe 2020. A strategy for smart, sustainable and inclusive growth, (3.3.2010.) http://ec.europa.eu/
news/economy/100303_en.htm
EC (2012): Towards enhanced patent valorisation for growth and jobs, Commission Staff Working Document No.
458, Brussels, 21.12.2012.
EFW (2014): Fraser Institute, Economic freedom of the World Data, (last downloaded: 2014. 09. 10.) http://
www.freetheworld.com/datasets_efw.html
EUROSTAT (2014): Eurostat Database, http://epp.eurostat.
ec.europa.eu/portal/page/portal/statistics/themes (last downloaded: 2014. 09. 08.)
Ginarte, J.C. – Park, W.G. (1997): Intellectual Property Rights and Economic Growth. Contemporary Economic Policy 15: p. 51–61.
Gould, D. – Gruben, W. (1996): The Role of Intellectual Property Rights in Economic Growth, Journal of Development Economics, 48: p. 323–350.
Green, W.H. (2008): Econometric analysis, 6th ed., Upper Saddle River, N.J. Prentice Hall
Gwartney, J. – Lawson, R. – Samida, D. (2000): Economic Freedom of the World: 2000 Annual Report. Vancouver:
Fraser Institute
Hatzichronoglou, T. (1997): Revision of the High Technology Sector and Product Classification, OECD Science, Technology and Industry Working Papers, (2). Paris:
OECD Publishing
Heston, A. – Summers, R. – Aten, B. (2006): Penn World Table Version 6.2., Center for International Comparisons of Production, Income and Prices at the University of Pennsylvania
Hu, A.G.Z – Png, I.P.L. (2012): Patent Rights and Economic Growth: Evidence from Cross-Country Panels of Manufacturing Industries, 4th Annual Conference on Empirical Legal Studies, November 20–21, 2009: p. 1–41.
Jones, Ch.I. (2001): Introduction to Economic Growth. (2nd Edition) London: Norton
Kanwar, S. – Evenson, R. (2003): Does Intellectual Property Protection Spur Technical Change? Oxford Economic Papers, 55(2): p. 235–264.
KLEMS (2014): EU KLEMS Database, http://www.euklems.
net/ (last downloaded: 2014. 09. 08.)
Mankiw, G.N. – Romer, P.M. – Weil, D.N. (1992): A Contri- bution to the Empirics of Economic Growth. The Quarterly Journal of Economics, 107(2): p. 407–437.
North, D.C. (1990): Institutions, Institutional Change, and Economic Performance. Cambridge University Press Novotny, Á. (2014): Az egyetemi–ipari technológiatranszfer
sajátosságai Magyarországon. Közgazdasági Szemle, 2013. (60. évf.) 10. sz.: 1119–1139. old.
Park, W.G. (2003): Do Intellectual Property Rights Stimulate R&D and Productivity Growth? Evidence from Cross- National and Manufacturing Industry Data, in Jon Putnam, ed., Intellectual Property Rights and Innovation in the Knowledge-Based Economy, Calgary: University of Calgary Press
Park, W. (2008): International Patent Protection: 1960–2005, Research Policy, 37 (4): p. 761–766.
PWT (2014): Penn World Table 8.0 release (International Comparisons of Production, Income and Prices): http://
www.rug.nl/research/ggdc/data/penn-world-table : 2014.09.16.)
Siwek, S.E. (2000): Copyright Industries in the U.S.
Economy: 2000, Report. Prepared for the International Intellectual Property Alliance, Washington, Economist Incorporated
Smith, A. (1759): The Theory of Moral Sentiments. London:
A. Millar
Solow, R.M. (1956): A Contribution to the Theory of Economic Growth. The Quarterly Journal of Economics, 70(1): p. 65–94.
Takalo, T. – Kanniainen, K. (2000): Do Patents Slow Down Technological Progress? Real Options in Research, Patenting, and Market Introduction; International Journal of Industrial Organization, (18): p. 1105–1127.
Taylor, M.S. (1994): Trips, Trade, and Growth, International Economic Review, 35(2): p. 361–381.
Weingast, B.R. (1995): The Economic Role of Political Institutions: Market-Preserving Federalism and Economic Development. Journal of Law, Economics and Organization 11(1): p. 1–31.
Williamson, O.E. (2000): The New Institutional Economics:
Taking Stock, Looking Ahead. Journal of Economic Literature, 38(9): p. 595–613.
Williamson, C.R. (2009): Informal Institutions Rule:
Institutional Arrangements and Economic Performance.
Public Choice, 139(4): p. 371–387.
WIPO (2014): World Intellectual Property Organization’s Statistics Data Center, www.wipo.int/ipstats/ (last downloaded: 2014. 08.10.)
World Bank (2014): World Bank Database, http://data.
worldbank.org/indicator/NY.GDP.PCAP.CD, (last down- loaded: 2014. 08.10.)