ELSEVIER Int. J. Production Economics 43 (1996) 193-211
production economics
Evaluation of corporate environmental management approaches:
A framework and application
Gyula Vastaga, *, Shndor Kerekesb, Dennis A. Rondinelli”
“Kenan Institute of Private Enterprise, Kenan-Flagler Business School, Universi~ of North Carolina, Campus Box 3440, Chapel Hill. NC 27599-3440, USA
bDepartment of Environmental Economics and Technology, Budapest University of Economic Sciences, Budapest IX,, Kinizsi x1-7, H-1092 Budapest, Hungary
Received 1 September 1995; accepted for publication in revised form 18 December 1995
Abstract
This article proposes a framework to evaluate corporate environmental strategies. In the proposed framework, a company’s environmental risks are analyzed on two dimensions. One dimension, the endogenous environmental risks, arises from the internal operations of the company. The other dimension, the exogenous environmental risks, are determined by the company’s external world: its location, its ecological setting, and the demographic characteristics of the physical environment in which it operates. Four environmental management approaches are defined as a function of endogenous and exogenous environmental risks: reactive, proactive, strategic, and crisis preventive. The framework was applied in a survey of 141 company representatives in Hungary. A relationship was sought between the a priori defined environmental management approaches based on technology and location and the companies’ environmental manage- ment characteristics defined by senior managers. Variables that differentiated among the four environmental manage- ment approaches were identified and ranked. The study concludes that there is a relatively well-defined relationship between the environmental risks of companies and the nature of their environmental management approaches.
Implementing a strategic environmental management approach may not be the best option for all companies ~ although there is a growing pressure to do so.
Keywords: Environmental management; Environmental risks; Survey
1. Introduction
A general consensus is emerging among business managers and environmental protection advocates that the economic impacts of the worldwide movement toward environmental management
* Corresponding author. Tel.: (919) 9624201; fax: (919) 962- 8202; e-mail: vastagg.kenan@mhs.unc.edu.
are becoming increasingly important for interna- tional corporations [ 11. Often, however, observers see the results differently. Environmentalists increasingly emphasize the strong business oppor- tunities inherent in the growing concern with environmental protection and management while business executives often see the threats to their companies of diminishing market oppor- tunities, rising costs, decreasing competitiveness, 0925-5273/96/$15.00 Copyright Lc 1996 Elsevier Science B.V. All rights reserved
SSDl 0925-5273(96)00040-O
194 G. Vastag et al./Int. J. Production Economics 43 (1996) 193-211 and increasing uncertainties and legal challenges
PI.
The most direct impacts may arise from the fact that with greater frequency individual executives are being held responsible under criminal laws for their companies’ environmental damage, especially in the United States and Canada. And as the concern with environmental issues spreads, govern- ments in other countries are also beginning to impose legal liabilities on managers for the environ- mental degradation caused by their companies [3].
This generally results in defensive reactions from managers, who either demand changes in legal re- quirements or seek stronger personal protection against the potentially illegal consequences of their companies’ activities [4].
The threat of criminal prosecution, however, is not the only force driving companies to create environmental management strategies. Increasing- ly, customers are reacting negatively to corporate environmental mismanagement, shareholders are abandoning companies caught in environmental crises, and financial institutions are including en- vironmental risks in their assessments of loan re- quests [S]. The IS0 14000 standards now being drafted by the International Organization for Stan- dardization (ISO) will set criteria for multinational companies to develop environmental management systems that are similar to the IS0 9000 standards for total quality management. But the compulsion to avoid legal liabilities that exists among execu- tives and corporations is in itself a strong moti- vation to adopt environmental management strategies [6].
Developing a sophisticated, comprehensive, and well-documented environmental management strategy, usually with the help of outside experts seems, in most cases, to be the best (although not necessarily the safest) way for most managers to avoid legal liabilities [7]. A proper reaction to the environmental challenge is also crucial to ensure the survival of companies in an era of heightened environmental sensitivities. Bad environmental management, resulting in serious environmental damages or health hazards, can destroy a company as quickly as bad financial management. Moreover, the social risks of environmental mismanagement in a globalizing and increasingly competitive econ-
omy may be even greater. But there are also serious financial risks in developing an overly sophisticated and constraining environmental management strategy - even if it does protect the managers who demand it ~ when it is not really needed or justified.
This paper describes a framework to evaluate corporate environmental management approaches.
We first discuss the issues that a company must address in developing an appropriate environ- mental management strategy and then provide a framework for choosing the best alternative. We test the framework in an international business setting by drawing on a survey of Hungarian com- panies to see how well the characteristics of com- panies and the perceptions of their executives about the importance of environmental challenges can predict the approaches that companies have ad- opted. We use two methodologies to test the valid- ity of framework: one analyzes the management attitudes and characteristics of companies assigned to each group in the framework based on their technology and location; the other classifies com- panies into four groups using all variables and a new, powerful methodology of classification and regression trees (CART).
2. What is an appropriate environmental management approach?
Any corporation facing environmental manage- ment challenges must deal with two questions.
First, what is the appropriate level of environ- mental standards to which a company should comply or the most prudent environmental man- agement approach that a company should adopt?
Second, at what level of the organization should environmental issues be addressed?
Companies can commit two types of errors in adopting an environmental management approach:
1. they can underestimate or overestimate the business opportunities offered by the growing worldwide concern for environmental protection;
or
2. they can underestimate or overestimate the costs and constraints created by legal and market demands for environmental management.
G. Vastag et al. Jlnt. J. Production Economics 43 (1996) 193-21 I 195
Both mistakes can have serious impacts on a company’s competitiveness and profitability. If management does not recognize the business op- portunities created by increasing public demand for environmental protection, it may overlook a grow- ing market segment and eventually lose market share to more sensitive and agile competitors. One report from the Organization for Economic Co- operation and Development (OECD) put the value of environmental-technology markets at $200 bil- lion in 1990. The OECD projects that this market will grow to $300 billion by the end of the decade, and some experts are even more optimistic in pre- dicting an enormous demand for clean-up services from fast-growing countries such as China, Taiwan and South Korea, and from the former Soviet Union as they clean up more than 40 years of industrial pollution [S]. On the other hand, overes- timating environmental threats may result in un- necessarily costly expenditures or constrain the company from undertaking otherwise profitable activities. If the business opportunities offered by increasing demands for environmental protection are overestimated, a company may initiate projects that do not produce revenues. But if the company does not spend enough to comply with regulations, it may be unable to meet new or stricter require- ments in the future, which could result in catastro- phic costs, fines, penalties, or other legal liabilities that may threaten its competitiveness, profitability or survival [9].
Unfortunately, companies are often led to make such errors by regulatory experts or consulting firms that try to impose common guidelines on companies that do not all have the same character- istics and needs or that do not operate in the same economic and social environments. The growing movement toward adopting international environ- mental charters or standards that seek to impose universal principles of sustainable development and environmental management - which is a very positive development in itself - often push corpora- tions to adopt environmental management approaches that may be either inappropriate or imprudent for their circumstances [lo]. As Barthman points out, “no bright line standard exists for an environmental-compliance manage- ment framework” [ 111. Legal requirements often
impose on companies what regulators consider to be ideal universal standards. Although a sound environmental management approach should be based on widely accepted general principles, it must also be specifically designed to reflect the character- istics of the company and the external conditions that affect its operations.
2.1. Endogenous and exogenous elements of environmental risk
The primary criterion for designing an appropri- ate environmental management approach is the company’s ability to manage its environmental risks. A company’s environmental risks can be de- fined as the probability of causing environmental damage and the seriousness of that damage. A com- pany’s environmental risk depends not only on its own activities but also on the environmental conse- quences of its activities that are determined by external factors. The broad environmental conse- quences include not only those influenced by the physical environment but also those resulting from the social environment in which the company oper- ates. Public reaction to environmental damages is often shaped not so much by the facts as by the public’s perceptions of the facts [12]. This difference explains much of the debate that takes place between managers and engineers and the rest of the population after environmentally damaging incidents. The “experts” and the public often perceive and evaluate the same facts differently because their knowledge of the facts, perceptions of damage, and “social environments”
are different.
In reality, the environmental risk of an activity is always somewhat uncertain. As Wynne concluded from his studies of hazardous wastes:
“The scientific uncertainties about what happens chemically, physically, and biologically in a landfill site are huge, and the opportunities for examining and reducing them extremely limited. Thus, the effects of putting a given waste into a site can only be approximately known; these effects are not in any case determinate, but depend (inter alia) upon how the site is operated and managed.
At which site a waste ends up, and in what
196 G. Vastag et al. JInt. J. Production Economics 43 (1996) 193-211 condition, also depends upon many social un-
knowns and contingencies” [ 131.
A similar level of uncertainty attends the envir- onmental consequences of other company activ- ities, and attempting to predict either the real impacts or the public reactions to them is often impossible for managers. However, in practice, due diligence and responsible care may be sufficient strategies for most companies; scientific exactness may not be required.
latory authorities. Risks created by externalities usually are beyond the influence or control of either the company or regulators. As a result, environ- mentalists and managers debate whether multi- national companies should comply with the requirements of the host country in which they operate or the home country of their headquarters
ClQ
Based on these assumptions we propose that a company’s environmental risks be analyzed on two dimensions, although we are fully aware of the multidimensional nature of the problem. One di- mension - the endogenous environmental risks - includes the internal operations of the company, including the materials, technologies, and human resources used in the manufacturing process. The other dimension - the exogenous environmental risks - is determined by the company’s external world: its location, the ecological characteristics (biodiversity, winds, topography) of the physical environment in which it operates, the demog- raphics (population density, age, income distribu- tion,), infrastructure (roads, telecommunication networks,), education levels of the population, and their attitudes toward environmental hazards.
Political institutions play an especially important role in exogenous environmental risks. As Wynne points out, in analyzing hazardous waste practices of the United States and the United Kingdom, the impact of regulatory agencies in environmental risk is a function of political culture [14].
The proposed framework does not evaluate the fine individual differences between companies, such as results of previous environmental projects. Its focus is rather general: it considers the technology used in the industry and the location and surround- ing of the plant.
It is not always easy to decide if a company’s suppliers and customers are part of the internal risks or the external risks. We can argue that sup- pliers are selected by a company and therefore it should be responsible for the potential damages caused by its transactions with them. The situation is different for customers because a company has far less influence on them. But if customers use a company’s products (e.g., fertilizers) improperly it may cause significant pollution and destroy its en- vironmental image.
The importance of considering both endogenous and exogenous factors in determining a company’s potential environmental risks can be illustrated by an example from Hungary. In Hungary, many chemical companies that had originally been located well outside of cities were later surrounded by the spread of urban centers into suburbs and rural hinterlands. At the beginning, even the heav- ily polluting companies did not cause a problem because they were relatively far from the city. To- day even those companies that meet all environ- mental regulations but are now surrounded by a city may have environmentally related conflicts and problems. The 1987 explosion in a Budapest chemical plant - although the damage from the explosion did not go beyond the fence - produced serious conflicts with city officials. Many people in Budapest demanded that the plant be closed, whereas 40 years earlier people living in Budapest would not even have noticed that something had happened on the plant’s grounds.
2.2. Environmental management as function of environmental risk
We propose four environmental management approaches - shown in Fig. 1 ~ as explanations of how companies respond to their endogenous and exogenous risks.
Both endogenous and exogenous dimensions of Endogenous environmental risks along the verti- environmental risk are complex, but they differ in cal axis and exogenous environmental risks along their implications. Endogenous risks are more the horizontal axis are, for purposes of illustration, clearly under the control of management and regu- divided into small and large. The cells describe four
G. Vastag et al./Int. J. Production Economics 43 (1996) 193-211 197
Small Large
4
IL3 Group B Group c2
Proactive Strategic
‘> 1
si a
s Group A Group D
% Reactive Crisis Preventive
8 32
Large
Small
Exogenous Environmental Risks
Fig. 1 Classification of environmental management ap- proaches.
environmental management approaches with com- binations of large and small exogenous and endo- genous risks.
2.2.1. Reactive environmental management
approach (Group A) 2.2.3. Strategic environmental management Group A would consist of those companies, for
example, that are in an industry that has low levels of pollution emission in which the pollutants are not environmentally dangerous and the number of people affected is small. These companies may use nonexhaustible resources as raw materials, produc- tion is not energy-intensive, and their activities do not involve transportation of massive volumes of hazardous materials. Mass production industries that use well-developed technologies such as tex- tiles, precision instruments, or some food producers (bakeries, for example) could appropriately adopt a reactive environmental management strategy. In these companies, environmental management calls merely for complying with local environmental re- gulations without taking extraordinary precautions to prevent highly unlikely environmental damages.
This approach does not have a significant influence on the company’s operations and responsibility for monitoring compliance can be carried out at middle management levels by an environmental and safety officer.
approach (Group C)
This group consists of companies in industries that are highly polluting and that operate in a so- cial or physical context in which risks are further increased by external conditions or public attitudes toward environmental hazards. Large chemical companies in cities are good examples. In these companies, environmental management must be an important part of the company’s overall business strategy and should be dealt with at the senior management level. These companies must often go beyond compliance with environmental regulations and take more aggressive safeguards to prevent or reduce environmental damage. Their environmental management strategy should be well defined, highly visible in company publications, and monitored carefully to protect managers against legal actions.
2.2.4. Crisis preventive environmental management approach (Group D)
In this group, the companies are not high-level polluters either because they do not use large 2.2.2. Proactive environmental management
approach (Group B)
Group B consists of companies in industries whose technologies involve high levels of pollution or emit pollutants that are environmentally danger- ous. However, because of location, climate condi- tions, or good environmental infrastructure, the adverse ecological and health consequences of these pollutants are small. Distilleries or sugar fac- tories from the food processing industry, for example, might be assigned to this group. At these companies, the environmental function is more sig- nificant than in Group A; managers have to anti- cipate future changes in environmental regulations, technology, and public opinion. The environmental management of these companies is often highly decentralized to the plants where the critical tech- nologies are concentrated. These plants, however, may be located in or around smaller towns where the inhabitants are less sensitive to environmental issues (in most cases the plant may be the only major employer in the town) and the population density is much smaller than in or around major cities.
198 G. Vastag et al./Int. J. Production Economics 43 (1996) 193-211
volumes of inputs or because the pollution happens indirectly (e.g., tourism, fast food chains) and the direct effect is not significant. Whatever pollution does occur, however, may be highly visible and affect large numbers of people or a wide territory.
Other examples include electric energy plants using clean energy sources, nuclear plants, and hydro- electric stations (except flatland-based ones) or poultry processing plants located in big cities. The environmental management approach can be best characterized as crisis preventive where public edu- cation campaigns are combined with elaborate technical procedures to assure that neither the pol- lution worsens nor the public misperceives the dangers of the low-level pollution that is taking place.
2.3. Comparing environmental management approaches
The reactive and strategic environmental man- agement approaches represent two extremes where the external and internal environmental risks are balanced, both of them are at the same qualitatively defined level (either low or high). In the former, there is no pressure to do anything beyond comply- ing with regulations - there are no urgent environ- mental issues, and the companies can wait to adopt new management guidelines. In the latter, a com- pany is under enormous pressure to go beyond compliance - environmental issues are extremely important; they cannot wait any longer to develop a strategy; and they cannot afford to make mis- takes. In the other two approaches (proactive and crisis preventive), the environmental risks are un- balanced. In both cases, companies can wait; they are not pressed to do anything immediately. But this situation may change, and they may have to plan their moves very carefully.
This classification of environmental manage- ment approaches gives a static description of com- panies at a specific point in time. Obviously, their situations may change quickly.
Although there is a growing international pres- sure for companies to develop and use strategic environmental management approaches in all cases, it may not be necessary or profitable to move
from proactive or crisis preventive approaches to the strategic management approach. Through tech- nology modifications and better emission control (for companies in Group B) and through public opinion monitoring (for companies in Group D), moving toward a reactive environmental manage- ment approach may be another option. The differ- ence in costs and requirements between the reactive and strategic environmental management ap- proaches are enormous, as illustrated in Table 1.
Adopting a reactive environmental management approach does not mean that companies pay no attention to opportunities for emission reduction, waste management, or more stringent sanitary practices. But because they are not central to the operations of the company, they can be dealt with by middle managers or outside experts rather than by senior management. Problems normally do not require immediate intervention because their non- crisis nature leaves time to fix them. Not all em- ployees would necessarily be given environmental education and training; it may be enough to have activities monitored by experts in the company.
Pollution emission reduction using monitoring equipment or “end-of-pipe” filters is the primary goal of these companies. Demand for environ- mental investments comes from stricter regulations and norms. These regulations and norms are the main forces driving these companies to make envir- onmental improvements.
At those companies where environmental perfor- mance is a crucial element of business activities, environmental management has to be part of the company’s overall business strategy, formulated and implemented by top management. For this reason, companies like 3M, McDonalds, Volvo, Kodak, Allied Signal, and many of the world’s leading chemical companies have adopted prin- ciples of industrial ecology and pervasive environ- mental management strategies [ 161. A high-level environmental committee including outside experts should play an important role in environment-re- lated decisions. The objectives of environmental management are derived from the company’s long- term strategy and not from current environmental regulations. All employees should be educated about environmental hazards, and environmental investments should include state-of-the-art techno-
G. Vastag et al./Int. J. Production Economics 43 (1996) 193-21 I
Table 1
Comparison of reactive and strategic environmental management
199
Reactive Activity Strategic
Middle level management involvement;
environmental committee less critical Low
There is time to fix it Cost optimization is important Special training for experts and for middle management
Pollution reduction Monitoring and control Complying with regulations A few years behind state-of-the-art technologies is acceptable
Management seniority level
Enaironmental management reporting level Uneven performance of environmental management
Cost control
Training and education
Management focus
Main actioity of environmental management Regulatory focus
Innovation in pollution prevention
Senior management leadership,
environmental committee in key position Very high (Chairman or CEO level) Serious and immediate intervention is required
Risk reduction is the critical issue; cost does not matter
Corporation-wide, specific training for senior and middle management Outstanding environmental performance Innovation and communication To be the standard for the industry Innovation to state-of-the-art technologies is critical to stay in business; it is part of competitiveness
logy and intensive attempts to reduce waste and whether a plant faces large or small exogenous risk.
pollution in the manufacturing process rather than Thus, plants from the same industry could be in relying on end-of-pipe controls. different cells.
3. Testing the framework: Environmental management in Hungarian companies
The purpose of this section is to test empirically the validity of the proposed framework for assess- ing environmental management approaches. We have argued that the most appropriate environ- mental management approach chosen by a company should be a function of the company’s environmental risks. Therefore, companies from different industries and in different locations may be better off following different paths. To measure the endogenous and exogenous environmental risks of a company - the basis of this framework _ we use the industry (technology) and the location of its plants. A priori classification of a plant’s processing technology will divide them into into
“large” and “small” endogenous risk categories, while population density, closeness to cities, dominant winds, environmental sensitivity and at- titude of neighboring communities will determine
Central Europe and, specifically, Hungary, were chosen as test sites because executives there must operate in complex and uncertain economic condi- tions as their countries undergo a transition from socialist to market systems. The transition affects every segment of the society. One of the most criti- cal challenges facing Hungarian managers, for example, is how to resolve the conflicting pressures of attaining financial stability for their companies while at the same time coping with potentially serious environmental risks [17].
A survey of corporate executives’ perceptions of environmental challenges was carried out in Hungary in late 1992 and early 1993 and was based on a similar worldwide survey undertaken by McKinsey a year earlier [18]. The questions were translated from English to Hungarian, and some new questions about company ownership were ad- ded to those used in the McKinsey survey. The translation was made by a doctoral candidate at the Budapest University of Economic Sciences and was verified by one of the authors. Questionnaires were sent to 400 medium- or large-sized companies
200 G. Vastag et al./Int. J. Production Economics 43 (1996) 193-211
that were on the membership list of the Hungarian Chamber of Commerce. The 42% response rate - 169 company executives, mostly senior managers
~ was itself an indicator of the strong interest in this topic among Hungarian companies. However, as is common in surveys, not all of the respondents answered all of the questions; and, thus, the actual number of respondents varies from question to question [ 193.
To test the validity of the approaches described in Fig. 1, 141 companies were selected from the 169 responses. The selection was based on readily avail- able information about the location and techno- logy of the company. Most of the companies had only one plant, but if the company had multiple plants then the most significant plant was selected to represent the company. Therefore, “company”
and “plant” are used interchangeably in the paper.
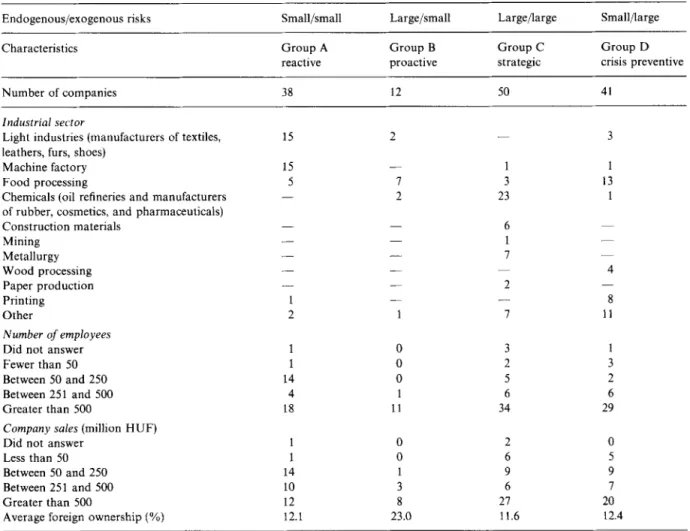
The authors then determined the exogenous risks based on the location of the plant and the endogen- ous risks based on prevalent technology in the industry. The exogenous risks were considered small if the company was located in or around smaller cities where the population density was low and the company was a major employer in the region. Similarly, if the company was in major cities with high population density and generally with higher levels of environmental awareness, the exogenous risks were considered large. The endo- genous risks of mass production industries that use well-developed technologies with low emissions such as textiles, precision instruments, or bakeries, for example, were considered low. Chemical com- panies, distilleries, or sugar factories with high emissions of pollutants were considered to have large endogenous risks. The characteristics of the selected companies by group are shown in Table 2.
Based on their technology and location as surro- gates for endogenous and exogenous risks, Group A included textile and some machine tool com- panies that manufacture precision instruments.
Group B included companies that were heavy pol- luters, such as leather processing plants that emit high levels of chrome in their waste, and food, sugar, and distillating plants located outside of major urban centers. These companies are pollut- ing but they are not perceived to be dangerous.
Group C included pharmaceutical and heavy
chemical companies, and waste incinerators with technologies that emit high levels of pollutants and located in or near cities. Food processing, wood processing and printing companies that do not have serious environmental problems now but could have in the future if public opinion about the environmental impacts of their operations changes or if regulations further constrain their significant emissions of wastewater fell into Group D. Gener- ally, companies in groups C and D were larger than in the other two groups. The low foreign invest- ment in group C, where companies needed it the most, can be explained by the fact that foreign investors in Hungary may at some time be required to assume liability for past environmental pollution _ a risk that is very high for almost all investors.
Some industries include companies that fall into more than one category. In Table 2 there are com- panies from the food processing industry for example in all four groups. Food processing is a very broad category and it includes a variety of activities, nonetheless this scattered distribution of companies in all categories requires some explana- tion. The five companies in Group A are bakeries with no environmental problems. They did not pay any pollution charges in the past and their location is not really an issue. The seven companies in Group B are distilleries (3), sugar plants (3) and a canning plant - all located around small towns.
All of them paid water pollution charges - there is high water consumption and potential or actual water pollution in these plants that is reduced by their remote location and the fact that they are major employers in the region. Three large dairy companies located in major cities were assigned to Group C. They require large amounts of water and if they have the infrastructural support (cleaning facilities for the waste water) they are environ- mentally safe. These plants did not have such facili- ties and paid high water pollution charges. Poultry and meat processing companies with slaughter houses located in major cities are assigned to Group D. Their situation may change at any time.
Animal protection leagues may sue them for keep- ing the animals in unacceptable conditions, cus- tomers may boycott their products (smoked ham, for example), and water pollution is a threatening issue for them.
G. Vastag et al./Int. J. Production Economics 43 (1996) 193-211 201 Table 2
Sample characteristics
Endogenous/exogenous risks Small/small Large/small Large/large Small/large
Characteristics
Number of companies
Group A Group B Group C Group D
reactive proactive strategic crisis preventive
38 12 50 41
Industrial sector
Light industries (manufacturers of textiles, leathers, furs, shoes)
Machine factory Food processing
Chemicals (oil refineries and manufacturers of rubber, cosmetics, and pharmaceuticals) Construction materials
Mining Metallurgy Wood processing Paper production Printing Other
Number of employees Did not answer Fewer than 50 Between 50 and 250 Between 251 and 500 Greater than 500
Company sales (million HUF) Did not answer
Less than 50 Between 50 and 250 Between 251 and 500 Greater than 500
Average foreign ownership (%)
15
- - - 2 1 1 14 4 18
1 14 10 12 12.1
2
I 2
- -
1 0 0 0
11 0 0 3 8 23.0
3 23
3 2 5 6 34 2 6 9 6 21 11.6
3
13
4
8 11
3 2 6 29 0 5 9 20 12.4
There are significant differences in environ- mental investments and pollution charges paid by the different groups. Table 3 shows the actual and anticipated percentages of environmental invest- ments from total company investments in 1992 and in 2000 and the average air and water pollution charges in 1992. In 1992, the percentage of environ- mental investments from total company invest- ments (which, in general, were much lower than in previous years due to the recession in the Hungar- ian economy) was significantly higher in Group C than in the other groups. These numbers show two clear trends: first, generally, with the notable exception of Group C, companies plan to spend
more on environmental investments in the future;
and, second, the differences between the groups are decreasing. As expected, a higher portion of com- panies in Group C paid fines than the others.
Table 4 shows that a senior manager (the respon- dent to this questionnaire) was responsible for environmental management in all groups.
The high level of direct participation of senior managers in Hungarian companies can be ex- plained by past experience as well. Before 1989, the political forces in opposition to the government used environmental issues to legitimize their criti- cisms. As a result, company managers representing the economic power of the state learned early on
202 G. Vastag et al./Int. J. Production Economics 43 (1996) 193-21 I
Table 3
Environmental investments and pollution charges Characteristics
Environmental investments (% of total investments) in 1992
in 2000
Pollution charges paid in 1992 (in Hungarian Forints) Average air pollution charge (number of companies fined) Average water pollution charge (number of companies fined)
Group A Group B
reactive proactive
3.7 4.6
12.2 12.0
135,250 905,000
(4) (2)
23,126 1,060,OOO
(3) (3)
Group C strategic
19.0 19.9
3,679,867 (15) 118,883,OOO
(17)
Group D crisis preventive
5.1 15.7
293,833 (6) 3,763,93 1
(6)
Table 4
Hierarchical level of environmental manager
Hierarchical level Group Group Group Group
A B C D
CEO or President 12 3 14 10
COO or Chief Engineer 13 6 21 20
Middle manager 8 8 8 5
Did not answer 5 2 7 6
Number of responses 38 12 50 41
that they had to prove that they used due diligence and reasonable care in their operations to offset criticism from a relatively well-organized social en- vironmental movement favored by the media.
If the initial theoretical classification described in Fig. 1 is a valid one, then the groups should show different environmental management attitudes and they should have different environmental manage- ment profiles. Considering the immediate and enor- mous pressure that managers in Group C face, it is reasonable to assume that this group should show a significantly different environmental profile from the others.
3. I. Environmental management projiles of the groups
To measure the managerial characteristics of the companies, respondents were asked about the
following topics: general environmental attitude;
key environmental concerns within the industry;
seriousness of environmental issues at different phases of product creation; the most effective ways to protect the environment; the environmental pol- icy component that is currently installed at their companies; and the familiarity of employees with company objectives in environmental protection.
Most of the questions were worded as statements, and respondents were asked the extent of their agreement or disagreement with the statement on a five-point scale. Based on the proposed theoret- ical framework, several hypotheses about the envir- onmental management profiles of the groups were tested. We hypothesized that Group C is more advanced in managerial characteristics related to the environment than other groups and that com- panies in Group C would be fundamentally differ- ent from the others. Table 5 gives more details about these questions and shows the hypotheses for each section.
Managers were asked about seven statements related to different aspects of environmental man- agement. The strongly agree answers on a five- point Likert-scale showed a positive environmental attitude, while the strongly disagree answers reflec- ted a negative attitude. First, using Cronbach’s alpha coefficient, the reliability of the scale was analyzed. Cronbach’s alpha for the seven state- ments was 0.64, which is slightly lower than the average of this indicator in psychology and
G. Vastag et aLlInt. J. Production Economics 43 (1996) 193-211 Table 5
Variables and hypotheses related to managerial characteristics of companies
203
Variable description Hypothesis
General enuironmental attitude: Managers were asked about seven statements related to different aspects of environmental management.
The scale ranged from 1 (strongly disagree) to 5 (strongly agree), where 5 showed a positive environmental attitude. The managers general attitude was measured as the average of the seven answers.
Ke!: enuironmental concerns within the industry: (1) Complying with regulations; (2) Preventing incidents; (3) Realizing new market oppor- tunities; (4) Enhancing positive image; (5) Integrating environment into corporate strategy. The scale ranged from 1 (not important) to 5 (very important). The level of environmental concern was defined as the average of the five answers.
Seriousness of etwironmental issues at the following phases of product creation: (1) Sourcing of (raw) materials; (2) Production (including transportation, storage); (3) Product use; (4) Disposal/Recycling. The scale ranged from 1 (not serious) to 5 (very serious). The level of seriousness of environmental issues in product creation is the average of the four answers.
Most efictive options to protect the environment: (1) Improve manufac- turing technology; (2) Improve end product; (3) Improve waste manage- ment. The scale ranged from 1 (not effective) to 5 (very effective).
Environmental policy component that is currently installed at the com- pany: (1) Written company policy statement; (2) Board member with specific responsibility; (3) Environmental performance evaluation of suppliers; (4) Hiring external experts in environmental affairs; (5) Public communication programs; (6) Environmental marketing program (e.g., green products, green labeling, special promotions, advertising). The options to answer this question were yes or no. The overall portion of yes answers shows the strategic content of the company’s environ- mental policy.
Familiarity with company objectives in environmental protection: Man- agers were asked to indicate on a five-point scale the extent (1 = not at all, 5 = to a great extent) to which the employees are familiar with company objectives in environmental protection.
The environmental attitudes of Groups B and C (where the endogenous environmental risks are large) are more positive than those of Groups A and D.
Overall, Group C has a higher level of concern about the environment than the other groups, which are about at the same level.
Group C faces more serious environmental problems in the broadly defined production process than the others.
In the other groups, the seriousness of environmental issues are approximately equal.
Improving manufacturing technology and the end prod- uct are considered the most effective in Group C and are about equal in the other groups. Improvement in waste management is the most (and about equally) important in Groups A, B, and D and less important in Group C.
Group C has the most strategic environmental policy content; the other groups are about equal.
In Group C, employees are more familiar with the com- pany objectives in environmental protection than in other groups, which are approximately at the same level.
marketing research but it is acceptable in prelimi- nary research situations like ours [20]. Moreover, considering that we relied on an international sur- vey instrument, this level of internal consistency is quite acceptable.
Second, the general environmental attitude of the groups (as the average of the answers to the seven statements) was tested. The hypothesis tested was that the environmental attitudes of respondents in Groups B and C (groups with large endogenous
environmental risks) would be more positive than those in Groups A and D. Managers who know the environmental dangers of their technologies should be more sensitive to environmental issues than those working with environmentally safe technolo- gies. Table 6 shows the average level of agreement with the statements in each group and the tests of our hypothesis.
Overall, as shown by the average of seven state- ments, managers in Groups B and C had a much
204 G. Vastag et aLlInt. J. Production Economics 43 (1996) 193-211
Table 6
General environmental attitude (1 = strongly disagree, 5 = strongly agree)
Statement Group A Group B Group C Group D
The environmental challenge is one of the central issues of the 21st century
4.5 4.9 4.1 4.6
The industry will have to re-think its entire conception of the industrial process if it is to adapt profitably to an increasingly environment oriented world
Where environmental or health considerations demand it, the sale of our products will be curtailed or their production halted, regardless of our economic interests
Pollution prevention pays
There is a need to assume responsibility for one’s products even after they left the plant
In the long-term, our spending on environmental R&D will give us a competitive advantage
3.8 3.8 3.9 3.8
2.3 2.3 2.9 2.5
3.3 3.4 4.0 3.4
4.1 4.8 4.1 4.1
3.2 3.8 4.1 3.6
To minimize the chance of future (environmental) tragedies, we should pursue a partnership of government, industry and academia
4.3 4.5 4.3 4.2
General environmental attitude (average of the seven answers) 3.71 3.94 4.07 3.80
Does the hypothesis hold? (ANOVA results) Yes”
(F , 28,, = 3.726; p = 0.056)
a The significance level is slightly higher than the customary 5%, however, the difference is so small that we accepted the hypothesis that environmental attitudes in Groups B and C are more positive than in Groups A and D.
more positive environmental attitude than the others - our hypothesis holds at 5.6% significance level that is slightly higher than the customary 5%.
The two areas where managers in Group C showed a far more positive attitude than the other groups were the willingness to stop production if environ- mental or health considerations demand it and their belief that “pollution prevention pays.” All groups agreed at a very high level (minimum 4.5 on a scale of 1 to 5) that the environmental challenge is one of the central issues of the 21st century and companies should assume responsibility for their products even after they have left the plant.
Key environmental concerns included four areas (complying with regulations, preventing incidents, enhancing positive image, and integrating environ- ment into corporate strategy) - all of them are very important for an environmentally conscious com- pany. For these four statements the Cronbach’s alpha was 0.72 - a generally accepted level of con- sistency. We hypothesized that, overall, group C would have a higher level of concern about the environment than the other groups. The overall
level of environmental concerns was measured as the average of the four answers. Table 7 shows that there was a significant difference between Group C and the others.
Because of the external and internal factors de- scribed earlier, companies in Group C face more serious environmental problems in the production process than those in the other groups. The serious- ness of environmental issues in the broadly defined production process was measured as the average of four answers, each related to one phase of produc- tion. The reliability of this scale was 0.73 - an acceptable level. Table 8 shows that this hypothesis holds.
We also discerned differences in the attitudes of respondents about the most effective ways to protect the environment. We hypothesized that improving manufacturing technology and end products - the most strategic options - would be considered the most effective in Group C and about equal in the other groups. Moreover, improving waste management - the most conservative ap- proach - would be considered the most effective in
G. Vastag et al. Jlnt. J. Production Economics 43 (1996) 193-211 205
Table 7
Key environmental concerns (1 = not important, 5 = very important)
Statement Group A Group B Group C Group D
Complying with regulations 4.3 4.0 4.2 4.3
Preventing incidents 4.4 4.3 4.8 4.6
Enhancing positive image 4.4 4.6 4.6 4.5
Integrating environment into corporate strategy 4.0 4.1 4.6 4.1
Level of environmental concerns (average of the four answers) 4.31 4.25 4.55 4.36
Does the hypothesis hold? (ANOVA results) Yes
(FI,Z,l = 4.661; p = 0.033)
Table 8
Seriousness of environmental issues (1 = not serious, 5 = very serious)
Phases of product creation Group A Group B Group C Group D
Sourcing of (raw) materials 3.2 2.3 3.2 2.1
Production (including transportation, storage) 2.9 3.0 3.6 3.0
Product use 2.0 1.7 2.4 2.4
Disposal and recycling 3.5 3.3 4.0 3.9
Seriousness of environmental issues (average of the four answers) 2.9 1 2.57 3.21 2.99
Does the hypothesis hold? (ANOVA results) Yes
(F,28;, = 6.442; p = 0.006)
Table 9
Most effective options to protect the environment (1 = not effective, 5 = very effective)
Options to protect the environment Group A Group B Group C Group D Does the hypothesis hold:’
(ANOVA results)
Improve manufacturing technology 3.9 4.0 4.4 3.9
Improve end product 3.0 2.9 3.2 2.1
Improve waste management 4.4 4.3 4.0 4.5
Yes
(Ft3*., = 4.412; p = 0.019) No
(FIz6,r = 1.901; p = 0.085) Yes
(FIz3,, = 4.080; p = 0.023)
all groups but C. Table 9 shows that at 5% signifi- cance level our hypothesis about the end product (the only exception) did not hold - it holds at an 8.5% significance level showing the same tendency.
Table 10 shows the scope of environmental pro- grams currently adopted by companies in the four groups. The yes answers indicate a more strategic
orientation in the company’s environmental policy.
In Hungary, as shown by the low percentage of yes answers in our sample, many of these strategic management approaches are not yet generally used.
The overall proportion of yes answers to the six questions in the Hungarian sample is 25.7% with Group C having a significantly higher portion of
206
Table 10
G. Vastag et al./Int. J. Production Economics 43 (1996) 193-21 I
Scope of environmental programs
Environmental policy component installed at the company Percentage of yes answers
Group A Group B Group C Group D
Environmental protection is part of the company (written) philosophy
Board member with specific responsibility
Environmental performance evaluation of suppliers Hiring external experts in environmental affairs Public communication program
Environmental marketing program Scope of environmental programs
(average of the six indicators above) Does the hypothesis hold? (ANOVA results)
52.6 66.7 76.0 46.3
34.2 16.7 38.0 41.5
5.3 16.7 6.0 2.4
10.5 8.3 32.0 9.8
5.3 0.0 10.0 2.4
26.3 41.7 28.0 19.5
22.4 25.0 31.7 20.3
(FID.I = Yes
13.448; p = 0.000)
them. Our hypothesis about Group C as having the most strategic environmental management ap- proach holds.
Managers were also asked to indicate on a five- point scale the extent (1 = not at all, 5 = to a great extent) to which their employees are familiar with company objectives in environmental protection.
In Group C, employees are significantly more in- formed (Fiz9;i = 18.873; p = 0.000) than in the other groups (the mean in Group A was 2.91; 2.90 in Group B; compared to 3.80 in Group C, and 3.00 in Group D).
These analyses showed the validity of the pro- posed framework, namely that companies with dif- ferent exogenous and endogenous risks - proxied as industry technology and location - follow differ- ent environmental management approaches. In all sections described in Table 5, companies in Group C have differentiated themselves from
and expressed attitudes congruent with environmental management approach.
the others a strategic
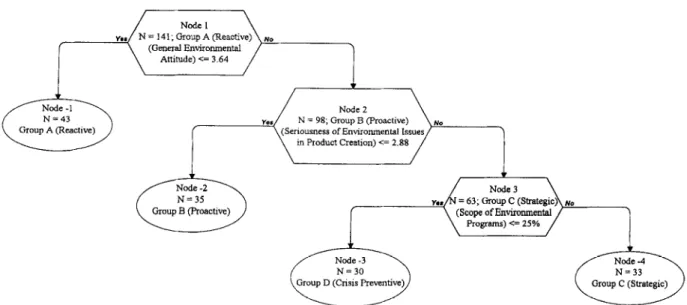
3.2. Classification of environmental management approaches using all variables
The objective of this section is to validate the proposed framework in a different way. In the pre- vious section, we compared the environmental
management characteristics of the groups and tes- ted several hypotheses about the differences - vari- able by variable. In this section, we classify the companies based on their environmental manage- ment characteristics into the four groups predeter- mined by the company’s environmental risks - using all variables at the same time. We are looking for a relationship between the physical character- istics of the company (exogenous and endogenous environmental risks) and environmental manage- ment characteristics, which - if the framework is valid - should match. However, there are serious limitations that dampened our expectations about this classification: (1) the original assignment was based on proxy variables, and there may have been some errors in assigning companies to different groups; (2) the variable set we used had only envir- onmental management characteristics; and, more- over, it reflected the opinion of one senior manager from each company; and (3) the variable set con- tained only eight variables. A random classification would yield about a 25% success rate. This analysis could only be considered successful if it resulted in a significantly higher success rate.
The data base used in the analysis was relatively small (141 observations and 8 variables), but it had missing data points and a presumably non- homogeneous data structure. A nonhomogeneous data structure means that relationships among