TRANSCARPATHIA 1920–2020
Transcarpathian Hungarians in the Last 100 Years
Transcarpathia 1920–2020
Transcarpathian Hungarians in the Last 100 Years
István Csernicskó Kornélia Hires-László
Zoltán Karmacsi Anita Márku
Réka Máté Enikő Tóth-Orosz
2020
TRANSCARPATHIA 1920–2020. Transcarpathian Hungarians in the Last 100 Years Authors: István Csernicskó, Kornélia Hires-László, Zoltán Karmacsi,
Anita Márku, Réka Máté, Enikő Tóth-Orosz Maps: István Molnár D.
Figures: István Csernicskó and Kornélia Hires-László Photos: Szabolcs Bunda, László Fülöp, Mihály Gazdag and
staff of the Antal Hodinka Linguistic Research Center Translation: Réka Máté
Cover design: Anita Márku and Kornélia Hires-László Typographic preparation: Enikő Tóth-Orosz
Cover image: Berehove/Beregszász. Photo by: Mihály Gazdag Made at the Antal Hodinka Linguistics Research Center
© The authors, 2020 Berehove/Beregszász, 2020
3
Contents
History 5
Demography 7
Education 13
Churches 21
Language rights 24
Language use, identity 32
Economy 42
Representation of interests 47
Selected sources 52
4
The Verecke Pass
(Photo by: Mihály Gazdag)
5
History
Transcarpathia, as a geographical-administrative unit, was created in 1919 as a result of peace treaties ending World War I, as a part of the (first) Czechoslovak Republic, under the name Podkarpatska Rus. A century ago, political decisions not only created the state of the Czechoslovak Republic, an administrative unit lacking historical background, but also the Hungarian national minority of Transcarpathia.
During the 20th century, historical storms swept through what is now known as Transcarpathia: after the Hungarian Kingdom and within the Austro-Hungarian Monarchy, it belonged to Czechoslovakia, and during a transitional period, a part of its territory formed a short-lived state (Carpatho-Ukraine); for a short time it returned to the Kingdom of Hungary; it was annexed to the Soviet Union after another transitional period (Transcarpathian Ukraine); In 1991, it was inherited by Ukraine, which became independent at the time (Table 1).
6
Table 1. The status of the region in the twentieth century and today
State affiliation Period Name of the region International treaties that affect the region's affiliation Kingdom of Hungary in Austro-
Hungarian Monarchy 1867–1918 Ung, Bereg, Ugocsa, Máramaros counties
Austro-Hungarian Compromise on the establishment of the Austro-Hungarian Monarchy (1867).
Czechoslovak Republic 1919–1938 Podkarpatska Rus Treaty of Saint-Germain (10/09/1919), Treaty of Trianon (04/06/1920).
Czechoslovak Republic
1938–1939 Podkarpatska Rus Autonomous region
Carpatho-Ukraine 14-16.03.1939 Independent State
Kingdom of Hungary 1939–1944 Subcarpathian Province First Vienna Award (02/11/1938); Military actions (14- 18/03/1939), second Vienna Award (30/08/1940).
Transcarpathian Ukraine 26.9.1944–
22.1.1946 (Theoretically) Independent State
Ukrainian SSR in the Soviet
Union 1946–1991 Zakarpattia Oblast Treaty between The Soviet Union and Czechoslovakia (29/06/1945).
Ukraine From 1991 Zakarpattia Oblast
Establishment of the Commonwealth of Independent States (07/12/1991) and Act of Declaration of Independence of
Ukraine (24/08/1991).
7
Demography
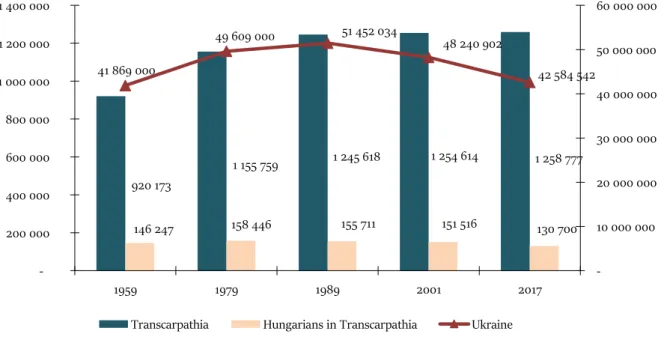
Between 1880 and 1910, the number of Ukrainians/Ruthenians living in the territory of the contemporary Hungarian state increased from 342,354 to 464,270, while between 1910 and 2001 the number of Hungarians living in the present Transcarpathian region decreased from 184,287 (1910) to 151,516 in 2001 and 130,700 in 2017. The decrease in the number and proportion of Hungarians is significant and shows a correlation with the changes in states (Figures 1 and 2).
Following the collapse of the Soviet Union in 1991, the first (and still only) census in the independent Ukraine was organized in 2001. The majority of the country's population was Ukrainian (77.8%). The largest national minority was Russian (17.3%). The proportion of other minority communities did not reach 1%. In 2001, 156,566 people declared themselves to be of Hungarian nationality (0.3%), while the number of Hungarian native speakers was 161,618 (Figure 3).
96.8% of Hungarians living in Ukraine and 98.2% of people with Hungarian as a native language lived in one region: Transcarpathia. In this region, following Ukrainians (80.5%), Hungarians were the largest community (12.1%). The number of Hungarian native speakers was 158,729, which was 12.7% in 2001. The number of Hungarian native speakers exceeded the number of Hungarians by 7,123.
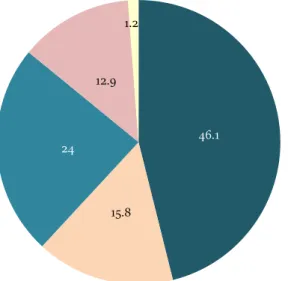
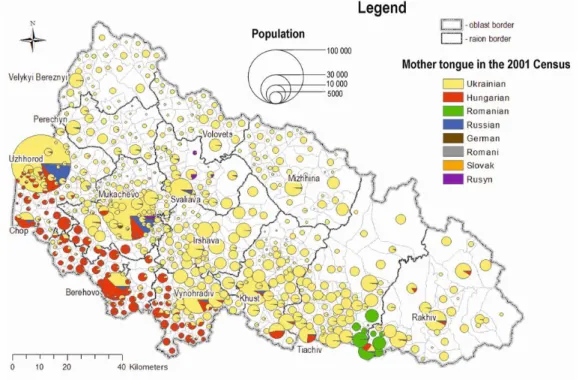
Most Hungarians in Transcarpathia (62%) still live in settlements where Hungarians make up an absolute majority (Figures 4 and 5).
8
Figure 1. Changes in the percentage of Hungarians in today's Transcarpathia in the light of official census data (1880-2001)
25.47
28.18
30.66
18.13
15.93
27.41
15.89
14.37 13.71
12.50 12.08
0 5 10 15 20 25 30 35
1880 1900 1910 1921 1930 1941 1959 1970 1979 1989 2001
9
Figure 2. Population trends of Ukraine and Transcarpathia and the number of Hungarians in Transcarpathia between 1959 and 2001
920 173
1 155 759 1 245 618 1 254 614 1 258 777
146 247 158 446 155 711 151 516 130 700 41 869 000
49 609 000 51 452 034
48 240 902
42 584 542
-
10 000 000 20 000 000 30 000 000 40 000 000 50 000 000 60 000 000
- 200 000 400 000 600 000 800 000 1 000 000 1 200 000 1 400 000
1959 1979 1989 2001 2017
Transcarpathia Hungarians in Transcarpathia Ukraine
10
Figure 3. Minority language speakers in Ukraine based on 2001 census data
21 96
2 768 3 307 4 206
6 029 6 725
19 195 22 603
23 765
51 847 56 249
134 396 142 671
161 618
185 032
231 382
0 50000 100000 150000 200000 250000
Krymchak Karaim Slovak Yiddish German Greek Rusyn/Ruthenian Polish Romani Gagauz Armenian Belarusian Bulgarian Romanian Hungarian Moldavian Crimean Tatar
Russian: 14,273,670
11
Figure 4. Distribution of Hungarians by ethnic composition of settlements in Transcarpathia based on the 2001 census data (%)
46.1
15.8 24
12.9 1.2
Higher than 75% (Hungarian dominance)
Between 50% and 75% (Hungarian majority)
Between 10% and 50% (Hungarian minority)
the proportion of Hungarians is below 10%, their number is over 100 (diaspora)
Hungarians are under 10%, less than 100 (people living in diaspora)
12
Figure 5. Native-language composition of the population in Transcarpathia by settlement in 2001
13
Education
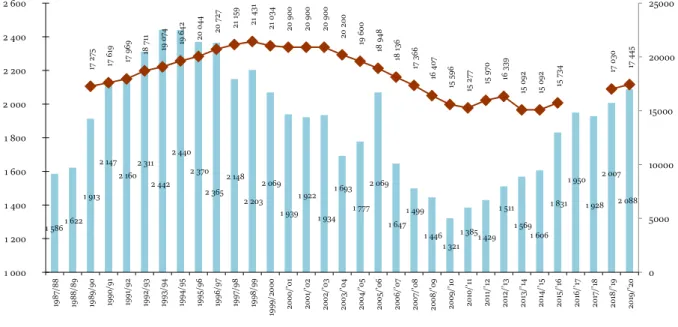
Hungarian-language medium education has a long tradition in today's Transcarpathia: schools with Hungarian as the language of instruction operated here even when the region belonged to Czechoslovakia or the Soviet Union. Independent Ukraine also made it possible for the Hungarian-language medium education system to function and even to develop (Figure 6). During the academic year 2019/2020, nearly 16,000 children studied in Hungarian in 97 schools (mostly with Hungarian as the language of instruction) in Transcarpathia.
However, not all Hungarians (are able to) learn in their mother tongue. The higher the level of the education, the more Hungarian children and younsters study in the official language of the state (Figure 7).
Most of these learners chose to study in the state language at their own discretion; however, there are also some who are forced (because there is no Hungarian kindergarten or school available in their settlement or near their place of residence).
As the language of higher education in the Soviet Union was Russian, Slavic speakers were in a better position. It is clear from the data of the 2001 census that the proportion of Russian-speaking graduates in Ukraine was the highest, and the lowest among non-Slavic (Moldavian, Hungarian, Romanian) speakers (Figure 8).
14
Figure 6. The number of pupils in Hungarian schools and the number of children enrolled in the first grade of Hungarian schools in Transcarpathia between 1987 and 2020
1 586 1 622 1 913
2 147 2 160
2 311 2 442
2 440 2 370
2 365 2 148
2 203 2 069
1 939 1 922
1 934 1 693
1 777 2 069
1 647 1 499
1 446 1 321
1 385 1 429 1 511
1 569 1 606
1 831 1 950
1 928 2 007
2 088
17 275 17 619 17 969 18 711 19 074 19 642 20 044 20 727 21 159 21 431 21 034 20 900 20 900 20 900 20 200 19 600 18 948 18 136 17 366 16 407 15 596 15 277 15 970 16 339 15 092 15 092 15 734 17 030 17 445
0 5000 10000 15000 20000 25000
1 000 1 200 1 400 1 600 1 800 2 000 2 200 2 400 2 600
1987/88 1988/89 1989/90 1990/91 1991/92 1992/93 1993/94 1994/95 1995/96 1996/97 1997/98 1998/99 1999/2000 2000/’01 2001/’02 2002/’03 2003/’04 2004/’05 2005/’06 2006/’07 2007/’08 2008/’09 2009/’10 2010/’11 2011/’12 2012/’13 2013/’14 2014/’15 2015/’16 2016/’17 2017/’18 2018/’19 2019/’20
Hungarian 1st graders all students studying Hungarian
15
Figure 7. The proportion of Hungarian and majority language learners at each level of education based on Tandem 2016 research data (N=362)
14.8% 14.6% 13.9% 16.8%
26.6% 30.3%
41.5%
53.4%
7.7% 7.2% 6.7% 7.7%
18.2%
28.4% 15.3%
13.2%
70.5% 77.8% 78.8% 75.2%
51.0%
34.9% 38.9%
26.7%
0%
10%
20%
30%
40%
50%
60%
70%
80%
90%
100%
Kindergarten Primary school (grades 1-4)
Basic general secondary
school (grades 5-9)
Complete general secondary
school (grades 10-11)
Vocational school
Technical school
University (BA/BSc)
University (MA/MSc)
In Hungarian In Russian In Ukrainian
16
Figure 8. The ratio of higher education in Ukraine by nationality based on 2001 census data
19.4%
16.1%
12.4%
11.7%
10.6%
5.4% 5.2%
4.2%
0%
5%
10%
15%
20%
25%
Russian Belarusian Ukrainian Polish Bulgarian Moldavian Hungarian Romanian
17
Educational discrimination is indicated by a study of a representative sample of Ukrainians and Hungarians living in the region, showing that Ukrainians in Transcarpathia have better education rates than Hungarians (Figure 9).
After the establishment of Ferenc Rákóczi II Transcarpathian Hungarian College in 1996, the institution issued its first graduates in 2001. The Hungarian-language college graduates – supplemented by the students of the Hungarian-Ukrainian Institute of Education and Science of the National University of Ungvár – have significantly improved the education indicators of the Transcarpathian Hungarian population: the proportion of the Hungarians had grown, especially amongst younger generations (Figure 10).
With the new Law on Education adopted in 2017 and its related legislation, Ukraine wants to curb the role of the mother tongues at all levels of education and direct citizens towards studying in the state language.
As a result of the new legislation, from 2023 onwards in schools with Hungarian and Romanian language of instruction, and from 5th September 2020 in Russian-language medium institutions, some subjects will no longer be taught in mother tongues but will have to be partially changed for state language education (Table 2). In the cells of Table 2, 100% means that all subject but the foreign language classes, Ukrainian language and Ukrainian literature are taught in that language.
The building of the Ferenc Rakoczi II Transcarpathian Hungarian College of Higher Education (Photo by: László Fülöp)
18
Figure 9. The education of Hungarians and Ukrainians in Transcarpathia based on Tandem 2016
4%
6%
13%
4%
32%
68%
29%
9%
22%
13%
0% 10% 20% 30% 40% 50% 60% 70% 80% 90% 100%
Ukrainian Hungarian
Basic general secondary school Vocational school Complete general secondary school
Technical school University
19
Figure 10. The highest level of education among Transcarpathian Hungarians by age group, according to Summa 2017
1%
3%
9%
4%
8%
7%
8%
19%
36%
48%
70%
68%
79%
78%
71%
54%
38%
25%
24%
14%
13%
10%
7%
5%
0% 10% 20% 30% 40% 50% 60% 70% 80% 90% 100%
18-29 30-39 40-49 50-59 60-69 70-79 80+
less than general general secondary higher
20
Table 2. Maximum percentage of the use of the mother tongue at different levels of public education, pursuant to Article 7 of the Law on Education of 2017, Article 5 of the law on general secondary education, and Article 21 of the State Language Law
Grades 1–4 5th grade 9th grade Grades 10–12 Who are they?
persons belonging to the majority* 100 100 100 100 Ukrainians
indigenous people** 100 100 100 100 Crimean Tatars
minorities whose languages are
official in the EU** 100 80 60 40 Hungarians,
Romanians minorities whose languages are
not official in the EU** 100 20 20 20 Russians
* At least one foreign language is taught as a subject from Grade 1
** At least one foreign language + Ukrainian language and literature are taught as a subject. The mother tongue may only appear in education
“alongside the state language”.
21
Churches
The Ukrainian census does not contain data on religious, denominational composition of the population.
However, from sociological surveys, we know that the majority of the Ukrainian population is Eastern Christian, that is, Orthodox (Table 3), but the absolute majority of Hungarians are supporters of Western Christian churches. The majority of Hungarians in Transcarpathia are Reformed, but a significant proportion are Roman or Greek Catholic (Figure 11).
Berehove/Beregszász (Photo by: Szabolcs Bunda)
22
Table 3. Religious distribution of the population of Ukraine according to sociological survey data (2019)
Church denomination %
Orthodox 79%
Roman Catholic 1%
Greek Catholic 9%
Protestant 1%
other 3%
atheist 4%
no answer 3%
total 100%
23
Figure 11. The denominational composition of the Transcarpathian Hungarian community based on data from various sociological researches
69%
64%
66%
65%
68%
18%
19%
14%
18%
16%
8%
10%
12%
13%
10%
2%
4%
7%
2%
1%
2%
2%
1%
2%
5%
0% 20% 40% 60% 80% 100%
MOZAIK 2001 Hungarian Youth Research 2016
Tandem 2016 Summa 2017 Hungarians Abroad
Research 2019
Reformed, Calvinist Roman Catholic Greek Catholic Orthodox other
24
Language rights
The legal status of minority languages is characterized by 6 grades and levels (Table 4):
• (5) The language of the minority is an official or state language throughout the country.
• (4) The official language of a smaller or larger regional unit (country, province, autonomous region, county, district).
• (3) The use of a language is allowed in public communication, it can be used in education, cultural life, the press, and in some cases it can be used in official situations, although the language has no official status.
• (2) The use of a language is tolerated in private life, possibly in church life and in private schools, but not (or to a limited extent) in state-controlled settings.
• The use of a language is prohibited by laws and regulations.
• The existence and independence of the language is not recognized.
25
Table 4. The legal status of the languages used today in Transcarpathia (1868-2020) on a 6-point scale
Languages → States ↓
Rusyn/
Ruthenian Ukrainian Hungarian Russian Slovak Romanian Romani Yiddish Kingdom of Hungary in
Austro-Hungarian Monarchy
3 3 5 3 3 3 0 0
(First) Czechoslovak
Republic 4 4 3 3 5 3 2 3
Czechoslovak Republic 2 4 3 3 5 3 2 3
Carpatho-Ukraine 2 5 2 3 2 2 2 2
Kingdom of Hungary 4 1 5 3 2 2 2 2
Ukrainian Transcarpathia 0 5 2 5 2 2 2 2
Soviet Union 0 4 3 5 3 2 2 2
Ukraine (1991–2012) 0 5 3 3 3 3 2 2
Ukraine (2012–2018) 2 5 4 3 3 3 2 2
Ukraine (2019-) 0 5 2 2 2 2 2 2
26
It is clear from the summary table that:
• The legal status of the languages used in today's Transcarpathia has changed many times over the last hundred years. None of the languages’ status used in the region has been constant over the last hundred years.
• In all cases, the changes in states reordered the hierarchy between languages.
• The official language has changed 6 times in the last hundred years, which has always brought a change, a compulsion for the people living in the region.
• Taking a closer look at the status of the Hungarian language and its changes, we can see that its language policy is not constant in the independent Ukraine.
• The 2012 Language Law brought a positive change, but the State Language Act adopted in 2019 reduced the status of the Hungarian language in Transcarpathia compared to 1991.
• Over the last century, several state entities have allowed minority languages to be used as official languages at regional and/or local level.
• The 2019 Ukrainian State Language Act abolished the regional official language status of the Hungarian language, and our language cannot be used as an official language in the work of county, district or local governments even in nearly 100% of Hungarian-populated settlements (Table 5).
27
Table 5. Official languages at national, regional and local level in what is now Transcarpathia (1868-2020)
at the national (imperial) level regional level at the local (municipal) level Kingdom of Hungary in Austro-
Hungarian Monarchy German Hungarian the language of the local majority
(First) Czechoslovak Republic Czechoslovak Czechoslovak, Rusyn/Ruthenian
besides Czechoslovak, the language whose speakers reached 20%
Czechoslovak Republic Czechoslovak Czechoslovak,
Rusyn/Ruthenian
the language whose speakers reached 20%
Carpatho-Ukraine Ukrainian Ukrainian Ukrainian
Kingdom of Hungary Hungarian Hungarian, Hungarian-
Russian (Rusyn/Ruthenian)
Hungarian, Hungarian-Russian (Rusyn/Ruthenian) Ukrainian Transcarpathia Russian, Ukrainian Russian, Ukrainian Russian, Ukrainian
Soviet Union Russian, Ukrainian Ukrainian Russian, Ukrainian
Ukraine (1991–2012) Ukrainian Ukrainian besides Ukrainian, the language of a
national minority which exceeds 50%
Ukraine (2012–2018) Ukrainian Ukrainian, Hungarian in addition to Ukrainian, the language whose native speakers reach a 10% ratio
Ukraine (2019-) Ukrainian Ukrainian Ukrainian
28
The status of minority languages, including Hungarian, may change or decrease even today, in the 21st century, because current international law, unfortunately, does not codify appropriate protection mechanisms for minority language speakers. For example, according to the 2017 monitoring by the Committee of Experts of the Council of Europe, Ukraine is not even fully fulfilling its obligations when ratifying the European Charter for Regional or Minority Languages.
The Committee of Experts used a 3-point scale to assess its obligations:
(4) Fulfilled: Policies, legislation and practice are in conformity with the Charter.
(3) Partly fulfilled: Policies and legislation are wholly or partly in conformity with the Charter, but the undertaking is only partly implemented in practice.
(2) Formally fulfilled: Policies and legislation are in conformity with the Charter, but there is no implementation in practice.
(1) Not fulfilled: No action in policies, legislation and practice has been taken to implement the undertaking or the Committee of Experts has not received any information on the implementation over several monitoring cycles.
( ) No conclusion: The Committee of Experts is not in a position to conclude on the fulfilment of the undertaking as no or insufficient information has been provided by the authorities.
For example, if we look at how the Committee of Experts assessed Kyiv's compliance with its obligations in 2017, e. g. in Article 10 of the Language Charter, it appears that none of the points was fully met (Table 6).
29
Table 6. How Kyiv has fulfilled its commitments to promote the use of regional or minority languages in public administration, as assessed by the Council of Europe Committee of Experts (4: fulfilled; 3: partly fulfilled; 2: formally fulfilled; 1: not fulfilled)
Article 10 – Administrative authorities and public services
2. In respect of the local and regional authorities on whose territory the number of residents who are users of regional or minority languages is such as to justify the measures specified below, the Parties undertake to allow and/or encourage:
a) the use of regional or minority languages within the framework of the regional or local authority; 3 b) the possibility for users of regional or minority languages to submit oral or written applications in these languages; – c) the publication by regional authorities of their official documents also in the relevant regional or minority
languages 1
d)the publication by local authorities of their official documents also in the relevant regional or minority languages; 1 e) the use by regional authorities of regional or minority languages in debates in their assemblies, without excluding,
however, the use of the official language(s) of the State; 1
f) the use by local authorities of regional or minority languages in debates in their assemblies, without excluding,
however, the use of the official language(s) of the State; 3
g) the use or adoption, if necessary in conjunction with the name in the official language(s), of traditional and correct
forms of place-names in regional or minority languages. 3
30
For other articles of the Charter, Ukraine has fulfilled its obligations at a slightly higher proportion, but its level of performance is, on average, slightly below that of the partially fulfilled, and not even higher for the application of any Article of the Language Charter (Figure 12).
Ukrainian language policy gone astray- analytical overview of Ukrainian language policy in Hungarian, Ukrainian and English
31
Figure 12. How Kyiv has fulfilled its obligations regarding the promotion of regional or minority languages through ratification of the Language Charter, as assessed by the EC Committee of Experts in 2017 (4: fulfilled;
3: partly fulfilled; 2: formally fulfilled; 1: not fulfilled)
3.13
2.58
1.79
1.40
2.05
2.36
3.42
2.39
0 1 2 3 4
7. Objectives and principles
8. Education 9. Judicial authorities
10.
Administrative authorities and public services
11. Media 12. Cultural activities and
facilities
14. Transfortier exchanges
Average
32
Language use, identity
At the turn of the 19-20th century, the majority of Hungarians in Hungary, Ung, Bereg, Ugocsa and Máramaros were monolingual, but there is a significant proportion of Hungarians living in today's Transcarpathia who speak other languages besides their mother tongue. Although it is true that between the years 1880 and 1910, the proportion of multilingual Hungarians in each of the four mentioned Northeastern counties slightly decreased, in 1910 almost half of the Hungarian-speaking population were (at least) bilingual in Máramaros, nearly two-fifths in Ung, one-fifth in Ugocsa and one-sixth in Bereg (Table 6).
Place name plate of Hecha/Mezőgecse
33
Table 6. The percentage of Hungarian-speaking population who also speak other languages in Hungary and in the four surveyed counties (1880-1910)
1880 1890 1900 1910
Hungary 17.5 18.6 20.5 18.6
Ung 38.3 37.5 33.9 37.4
Bereg 23.3 18.2 16.3 16.3
Ugocsa 26.9 27.7 20.8 22.0
Máramaros 51.6 51.5 49.2 45.9
34
Figure 13. A change in the proportion of speakers of Hungarian among mother tongue speakers of other languages between 1880 and 1910, based on census data (in percentages)
33
47.8 46.5 14.8
30
44.6 42.9 13.7
27.5
42.4 38.2 12.5
32.1
43.6 35.7
10.8
0 10 20 30 40 50 60
Ung Bereg Ugocsa
Máramaros 1880
1890 1900 1910
35
Meanwhile, between 1890 and 1910, the proportion of Hungarian speakers among non-Hungarians increased significantly in the Northeastern region of Hungary (Figure 13).
A comparison of Table 6 and Figure 13 (the proportion of native speakers of Hungarian who were bilingual compared to the proportion of non-native speakers of the state language) reveals that the proportion of bilingual Hungarians is higher than Hungarian speakers of different nationalities. Based on four censuses conducted at the turn of the 20th century, the proportion of those Ruthenians who spoke the official language increased from 5.5% in 1880 to 14.0% in 1910, but in those four examined counties, the knowledge of the Hungarian language did not spread rapidly among the Slavic population. In 1910, the proportion of Ruthenians who spoke Hungarian reached 25% only in Bereg among the four counties. In fact, among native speakers of Hungarian, the proportion of those familiar with Ruthenian was almost as high as the other way round (Table 7). In Máramaros, for example, the 1910 census recorded that almost a quarter of Hungarian native speakers in the county spoke Ruthenian, while only 8 percent of the Ruthenian population knew Hungarian. In this county, all four censuses of the time stated that the Slavic languages were more widely known among Hungarians than the state language among the minorities.
36
Table 7. The percentage of Rusyns and Hungarians that mutually speak each other’s language
1880 1890 1900 1910
Rusyns in Hungarian
Hungarians in Rusyn
Rusyns in Hungarian
Hungarians in Rusyn
Rusyns in Hungarian
Hungarians in Rusyn
Rusyns in Hungarian
Hungarians in Rusyn
Ung 2.9 2.7 4.1 3.7 8.1 5.0 16.0 8.9
Bereg 5.3 7.9 10.7 7.6 15.2 7.9 25.6 14.1
Ugocsa 19.6 12.8 17.4 11.5 18.7 15.4 22.0 15.6
Máramaros 3.4 17.9 5.6 22.2 4.8 18.6 8.0 24.4
Kingdom of Hungary 5.5 0.3 7.3 0.3 8.4 0.3 14.0 0.5
37
From the above it can be seen that at the turn of the 20th century, the hierarchical relationships between languages in the region away from the centers were influenced more by the regional and local majority- minority relationship and the usefulness of languages, than by state language and education policy.
Furthermore, if we look at the data on the knowledge of languages from the turn of the 20-21. century, a similar picture emerges.
According to the 2001 census (Tables 8 and 9), in Transcarpathia, most people spoke Hungarian (36 thousand) and Russian (31 thousand) as their second language in addition to their mother tongue. The majority of those who spoke Hungarian was among Ukrainians, while Russian was spoken mostly by Ukrainians and Hungarians. Almost two thirds (63%) of the Transcarpathians spoke only their mother tongue (Figure 14).
Linguistic legal relationships have a decisive influence on which languages are mandatory, permitted or even prohibited in certain situations. The 2016 survey of Transcarpathian Ukrainians and Hungarians with a total of 1,200 contributors reveals that Ukrainian native speakers can use the Ukrainian language in a statistically significant number of situations and in greater proportions and are generally not forced to use another language. At the same time, it can be seen that the proportion of those who use only Hungarian is outstanding in situations that can be classified as private. Hungarians use only the Hungarian language when communicating with their neighbors, friends, schoolmates and the social network more often than the informants in the Ukrainian sample. Thus, in most situations Hungarians are forced to use another language beside or instead of their mother tongue (Figure 15).
38
Table 8. Language skills of the population of Transcarpathia based on the 1989 and 2001 censuses
Languages
Mother tongue Second language In total Do not speak
1989 2001 1989 2001 1989 2001 1989 2001
Ukrainian 972,827 1,016,268 48,106 19,699 1,020,933 1,035,967 224,685 218,647
Hungarian 166,700 158,729 12,500 38,694 179,200 197,423 1,066,418 1,057,191
Russian 62,150 36,412 670,046 32,877 732,196 69,289 513,422 1,185,325
39
Table 9. Language skills of the population of Transcarpathia, based on the 1989 and 2001 censuses (percentage of the total population)
Languages
Mother tongue Second language In total Do not speak
1989 2001 1989 2001 1989 2001 1989 2001
Ukrainian 78.10 81.00 3.86 1.57 81.96 82.57 18.04 17.43
Hungarian 13.38 12.65 1.00 3.08 14.39 15.74 85.61 84.26
Russian 4.99 2.90 53.79 2.62 58.78 5.52 41.22 94.48
40
Figure 14. The percentage of people who only speak their mother tongue in Transcarpathia by nationality based on the 2001 census
68.8
56.6
49.1
41.3
18.9 17.3
12.2
63
0 10 20 30 40 50 60 70 80
Ukrainian Roma Romanian Hungarian Russian German Slovak Transcarpathia
41
Figure 15. Exclusive appearance of the mother tongue in different language usage scenes in the Ukrainian and Hungarian subsamples according to Tandem 2016 (in percentages)
40.5
31.5
21.4 24
59.9 58.4
74.8
62.3 75.5
61.7 59.3
75.4 69.7
63.1
85.6 89.3
38.5 37.6
56.8
65.4
79.1 77.5
60.7 56.5
0 20 40 60 80 100
At work When shopping
At doctor At offices With neighbor
With friends With schoolmates
outside of school
While watching TV
When reading newspaper
When listening to
the radio When browsing web pages
Facebook, other community
Hungarian patern only Hungarian Ukrainian pattern only Ukrainian
42
Economy
The hierarchical relationship between the majority and the minority, as well as the legacy of the Soviet era politics are reflected in the fact that Russian and Ukrainian nationalities are overrepresented in senior positions, while the proportion of Hungarians among manual workers is higher (Figure 16).
Tandem 2016 data from a representative sample of Ukrainians and Hungarians in Transcarpathia in 2016 suggest improving trends, although traces of inequality are still to be found: Hungarians have a higher proportion of subordinate employees and inactive people in the labor market, than among the Ukrainians (Figure 17).
Fruit and vegetable art exhibition at the Bereg Fest event
43
Figure 16. Nationalities by occupation in Transcarpathia according to the 2001 census
38.20%
21.20%
6.90%
15.50%
36.20%
13.50%
48.80%
14.40%
4.98%
51.85%
10.40%
2.53%
60.20%
1.40%
0.28%
0% 10% 20% 30% 40% 50% 60% 70%
non-professional jobs jobs requiring qualifications leaders, senior civil servants
Roma Romanians Hungarians Russians Ukrainians
44
Figure 17. The social activity of Ukrainian and Hungarian adults in Transcarpathia (based on Tandem 2016)
43.5%
2.9%
11.3%
9.4%
7.4%
12.6%
12.9%
42.3%
1.2%
11.6%
10.4%
4.0%
12.6%
17.8%
0% 5% 10% 15% 20% 25% 30% 35% 40% 45% 50%
employee leader casual work entrepreneur student pensioner other inactive
Hungarian Ukrainian
45
Their prestige and belief in their economic usefulness are essential to the future of languages: the language that is considered worthless and useless will not be passed on to the next generation. In 2016, a sample of Transcarpathian Ukrainians and Hungarians was asked on the importance of Ukrainian, Hungarian, Russian, English and German. The importance of each language was rated on a scale of 1 (not at all important) to 5 (very important). Both samples considered their own language very important. As the second most important language, both the Ukrainian and the Hungarian sample named the global language, English. The third highest score was given to the language of the other side in both samples: Ukrainians value the role of the Hungarian language relatively and Hungarians the role of the Ukrainian language in the future of their child. Both models consider German to be slightly more important and useful for future generations than Russian (Figure 18).
Inscriptions in Ukrainian, Hungarian and English at a fast food stall
46
Figure 18. Assessing the importance of languages for their children's future (1 = not important, 5 = very important)
4.79
3.46
3.20
4.4
3.27 4.64
4.05
3.01
4.35
3.15
1 2 3 4 5
own language another language Russian English German
Ukrainian patern Hungarian patern
47
Representation of interests
In the last days of the Soviet Union, the Transcarpathian Hungarian Cultural Association (KMKSZ), the largest organization of Hungarians in Transcarpathia, was formed, and a few years later the Ukrainian Democratic Association of Ukraine (UMDSZ) was formed. Along with other professional organizations (e.g.
Transcarpathian Hungarian Pedagogical Association, Transcarpathian Association of Hungarian Intellectuals, Transcarpathian Hungarian Academic Council, etc.), the Hungarian national community is undoubtedly the most organized minority in Ukraine. These have made a significant contribution to the democratization of Ukraine, the route of Euro-Atlantic integration, are active supporters of the integration efforts of the Hungarians, and are indispensable contributors to maintaining political stability and inter-ethnic peace in the country and in Transcarpathia.
Transcarpathian Hungarians, despite making up only 0.3% of the population in Ukraine, were repre- sented in five of the nine parliamentary cycles of Ukraine that became independent in 1991 with one represent- tative in the 450-person parliament in Kyiv (Table 10). Unfortunately, due to the transformation of the election conditions, there is no Hungarian representative in Kyiv in the parliament elected in summer 2019.
Hungarian representatives are present in the representative bodies of the Transcarpathian regional (county, district) and local governments (Table 11 and Figure 18).
48
Table 10. Representatives of the Hungarians of Transcarpathia in the independent Supreme Council of Ukraine
Időszak Képviselő
Cycle I April 1990 – May 1994 –
Cycle II May 1994 – May 1998 Mihály Tóth
Cycle III May 1998 – May 2002 Miklós Kovács
Cycle IV May 2002 – May 2006 István Gajdos
Cycle V May 2006 – November 2007 –
Cycle VI November 2007 – December 2012 –
Cycle VII December 2012 – November 2014 István Gajdos
Cycle VIII November 2014 – August 2019 László Brenzovics
Cycle IX August 2019 – –
49
Table 11. Hungarian representatives on the representative body of the Transcarpathian County Council
Cycle mandate Total number of representatives
Number of Hungarian representatives, respective number of representatives of the Hungarian
fraction
Cycle I April 1992 – May 1994 60 11
Cycle II July 1994 – April 1998 60 9
Cycle III April 1998 – April 2002 75 4
Cycle IV April 2002 – April 2006 85 4 (KMKSZ) and 3 (UMDSZ)
Cycle V April 2006 – November 2010 70 5 (KMKSZ) and 4 (UMDSZ)
Cycle VI November 2010 – December 2015 108 3 (KMKSZ) and 4 (UMDSZ)
Cycle VII December 2015 – 64 8 (KMKSZ and UMDSZ joint fraction)
50
Transcarpathian Hungarian parties were represented in all the administrative units of the region (subordinate towns of Uzhhorod, Mukachevo, Berehove and Chop counties, ’raion’ councils of Berehove, Vynohradiv, Mukachevo and Uzhhorod), where a significant number of Hungarians live. In the town of Berehove and in the Berehove raion (district), the Hungarian political representation deputizes the most representatives in the municipalities (Figure 19).
The poster announcing the 2020 municipal elections in Berehove/Beregszász
51
Figure 19. Representatives of the two Transcarpathian Hungarian parties in Hungarian-inhabited administrative units in Transcarpathia in the 2015-2020 election cycle
8 2
7 4 3
11 12
19
2 3
3 4
4 2
4 5
5
5 6
8 4
3
6 9
2 8
9
8 5 4
7 3
7 18 17
9 5 8
3 3
3
4 4
2
1 1
0% 10% 20% 30% 40% 50% 60% 70% 80% 90% 100%
Uzhhorod raion Uzhhorod Chop Mukachevo raion Mukachevo Vynohradiv raion Berehove Berehove raion
KMKSZ + UMDP Batkivshchyna Opposition Bloc
Radical Party of Oleh Lyashko BPP "Solidarity"
Revival United Centre
European Party of Ukraine Samopomich
Patriot Our Land Svoboda
52
Selected sources
Baranyi Béla szerk. 2009. Kárpátalja. A Kárpát-medence régiói 11., Pécs–Budapest: MTA Regionális Kutatások Központja – Dialóg Campus Kiadó.
Batt, Judy 2002. Transcarpathia: Peripheral region at the ‘centre of Europe’. Regional & Federal Studies, 12(2): 155–177.
Beregszászi Anikó – Csernicskó István – Orosz Ildikó 2001. Nyelv, oktatás, politika. Beregszász: Kárpátaljai Magyar Tanárképző Főiskola.
Brenzovics, László – Zubánics, László – Orosz, Ildikó – Tóth, Mihály – Darcsi, Karolina – Csernicskó, István 2020. The continous restriction of language right sin Ukraine. Berehove–Uzhhorod.
Csernicskó István 1998. A magyar nyelv Ukrajnában (Kárpátalján). Budapest: Osiris Kiadó – MTA Kisebbségkutató Műhely.
Csernicskó István 2013. Államok, nyelvek, államnyelvek. Nyelvpolitika a mai Kárpátalja területén (1867–2010). Budapest:
Gondolat Kiadó.
Csernicskó István 2016. Nyelvpolitika a háborús Ukrajnában. Ungvár: Autdor-Shark.
Csernicskó István 2019. Fények és árnyak Kárpátalja nyelvi tájképéből. Ungvár: Autdor-Shark.
Csernicskó, István – Hires-László, Kornélia – Karmacsi, Zoltán – Márku, Anita – Máté, Réka – Tóth-Orosz, Enikő 2020.
Ukrainian language policy gone astray: The Law of Ukraine “On Supporting the Functioning of the Ukrainian Language as the State Language” (analytical overview). Törökbálint: Termini Egyesület.
Csernicskó István – Orosz Ildikó 2019. The Hungarian language in Education in Ukraine. Leeuwarden: Mercator European Research Centre on Multilingualism and Language Learning.
53
Csernicskó István – Soós Kálmán 2002. Mozaik 2001. Gyorsjelentés – Kárpátalja. In: Mozaik 2001. Magyar fiatalok a Kárpát-medencében, 91–135. Budapest: Nemzeti Ifjúságkutató Intézet.
Csernicskó István szerk. 2003. A mi szavunk járása. Bevezetés a kárpátaljai magyar nyelvhasználatba. Beregszász:
Kárpátaljai Magyar Tanárképző Főiskola.
Csernicskó István szerk. 2010a. Megtart a szó. Hasznosítható ismeretek a kárpátaljai magyar nyelvhasználatról.
Budapest–Beregszász: MTA Magyar Tudományosság Külföldön Elnöki Bizottság – Hodinka Antal Intézet.
Csernicskó István szerk. 2010b. Nyelvek, emberek, helyzetek: a magyar, ukrán és orosz nyelv használata a kárpátaljai magyar közösségben. Ungvár: PoliPrint.
Fedinec Csilla – Halász Iván – Tóth Mihály 2016. A független Ukrajna. Államépítés, alkotmányozás és elsüllyesztett kincsek. Budapest: MTA TK Kisebbségkutató Intézet – Kalligram Kiadó.
Fedinec Csilla – Vehes Mikola főszerk., Osztapec Jurij, Oficinszkij Roman, Szarka László, Tokár Marián és Csernicskó István szerk. 2010. Kárpátalja 1919–2009: történelem, politika, kultúra. Budapest: Argumentum–MTA Etnikai- nemzeti Kisebbségkutató Intézete.
Ferenc Viktória – Kovály Katalin szerk. 2020. Kárpátalja mozgásban: társadalmi változások és interetnikus viszonyok az Euromajdan után. Budapest: Bethteln Gábor Alapkezelő Zrt.
Ferenc Viktória – Molnár József 2017. A Tandem 2016 kutatás általános bemutatása és mintavételi eljárás. Kisebbségi szemle 2017/2. 5–19.
Ismertté vált a megyei tanács összetétele. Kárpátalja hetilap. 2015. november 4., 773. szám.
https://karpataljalap.net/2015/11/04/ismertte-valt-megyei-tanacs-osszetetele Kárpátaljai Magyar Pedagógus Szövetség adatbázisa
Központi Statisztikai Hivatal. Népszámlálási digitális adattár.
https://library.hungaricana.hu/hu/collection/kozponti_statisztikai_hivatal_nepszamlalasi_digitalis_adattar/
54
Külhoni magyarok komplex kvantitatív és kvalitatív kutatás. Kárpátalja magyar nyelvű lakossága körében végzett kutatás, 2019 (Kézirat).
Molnár József – Molnár D. István 2005. Kárpátalja népessége és magyarsága a népszámlálási és népmozgalmi adatok tükrében. Beregszász: KMPSZ Tankönyv- és Taneszköz Tanácsa.
Molnár D. István 2018. Perifériáról perifériára. Kárpátalja népessége 1869-től napjainkig. Budapest: MTA TK Kisebbségkutató Intézet – Kalligram Kiadó.
Székely Levente szerk. 2018. Magyar fiatalok a Kárpát-medencében, Magyar Ifjúság Kutatás 2016. Budapest: Kutatópont Kft.
Tátrai Patrik – Molnár József – Molnár D. István – Kovály Katalin – Erőss Ágnes – Ferenc Viktória – Rákóczi Krisztián 2018. A migrációs folyamatok hatása a kárpátaljai magyarok számának alakulására. Metszetek Vol. 7 (2018) No.
1. Pp. 5–29.
Vehes Mikola, Molnár D. István, Molnár József, Osztapec Jurij, Oficinszkij Roman, Tokar Mariana, Fedinec Csilla és Csernicskó István szerk. 2011. Хроніка Закарпаття 1867–2010 / Kárpátalja évszámokban 1867–2010.
Ужгород–Ungvár: Hoverla.
Всеукраїнський перепис населення 2001. http://2001.ukrcensus.gov.ua/
Конфесійна структура населення України і створення Православної Церкви України: травень 2019.
http://oou.org.ua/2019/05/24/konfesijna-struktura-naselennya-ukrayiny-i-stvorennya-pravoslavnoyi-czerkvy- ukrayiny-traven-2019/
55
The present-day Transcarpathia in Austro-Hungarian Monarchy
56
The present-day Transcarpathia in the Czechoslovak Republic
57
The present-day Transcarpathia in Hungarian Kingdom
58
The present-day Transcarpathia in Soviet Union
59
Transcarpathia in Ukraine