nanomaterials
Article
Optimization Method of the Solvothermal Parameters Using Box–Behnken Experimental Design—The Case Study of ZnO Structural and Catalytic Tailoring
Zoltán Kovács1,2,3, Csanád Molnár1, Urška Lavrenˇciˇc Štangar4 , Vasile-Mircea Cristea5, Zsolt Pap3,6,*, Klara Hernadi1,3,7,* and Lucian Baia2,6
Citation: Kovács, Z.; Molnár, C.;
Štangar, U.L.; Cristea, V.-M.; Pap, Z.;
Hernadi, K.; Baia, L. Optimization Method of the Solvothermal Parameters Using Box–Behnken Experimental Design—The Case Study of ZnO Structural and Catalytic Tailoring.Nanomaterials2021,11, 1334.
https://doi.org/10.3390/
nano11051334
Academic Editor: Nikos Boukos
Received: 19 April 2021 Accepted: 14 May 2021 Published: 19 May 2021
Publisher’s Note:MDPI stays neutral with regard to jurisdictional claims in published maps and institutional affil- iations.
Copyright: © 2021 by the authors.
Licensee MDPI, Basel, Switzerland.
This article is an open access article distributed under the terms and conditions of the Creative Commons Attribution (CC BY) license (https://
creativecommons.org/licenses/by/
4.0/).
1 Research Group of Environmental Chemistry, Institute of Chemistry, University of Szeged, Tisza Lajos krt. 103, H-6720 Szeged, Hungary; kovacs.zoltan.ubb@gmail.com (Z.K.);
Molnar.Csanad@stud.u-szeged.hu (C.M.)
2 Faculty of Physics, Babes,-Bolyai University, Str. Mihail Kogălniceanu 1, RO-400084 Cluj-Napoca, Romania;
lucian.baia@phys.ubbcluj.ro
3 Department of Applied and Environmental Chemistry, University of Szeged, Rerrich tér 1, H-6720 Szeged, Hungary
4 Faculty of Chemistry and Chemical Technology, University of Ljubljana, Veˇcna pot 113, 1000 Ljubljana, Slovenia; Urska.Lavrencic.Stangar@fkkt.uni-lj.si
5 Faculty of Chemistry and Chemical Engineering, Babes,-Bolyai University, Str. Arany János 11, RO-400028 Cluj-Napoca, Romania; mircea.cristea@ubbcluj.ro
6 Centre of Nanostructured Materials and Bio-Nano Interfaces, Institute for Interdisciplinary Research on Bio-Nano-Sciences, Treboniu Laurian 42, RO-400271 Cluj-Napoca, Romania
7 Institute of Physical Metallurgy, Metal Forming and Nanotechnology, University of Miskolc, HU-3515 Miskolc-Egyetemváros, Hungary
* Correspondence: pzsolt@chem.u-szeged.hu (Z.P.); hernadi@chem.u-szeged.hu (K.H.)
Abstract:ZnO photocatalysts were synthesized via solvothermal method and a reduced experimental design (Box–Behnken) was applied to investigate the influence of four parameters (temperature, duration, composition of the reaction mixture) upon the photocatalytic activity and the crystal structure of ZnO. The four parameters were correlated with photocatalytic degradation of methyl orange and the ratio of two crystallographic facets ((002) and (100)) using a quadratic model. The quadratic model shows good fit for both responses. The optimization experimental results validated the models. The ratio of the crystal facets shows similar variation as the photocatalytic activity of the samples. The water content of the solvent is the primary factor, which predominantly influence both responses. An explanation was proposed for the effect of the parameters and how the ratio of (002) and (100) crystal facets is influenced and its relation to the photocatalytic activity. The present research laconically describes a case study for an original experimental work, in order to serve as guideline to deal with such complicated subjects as quantifying influence of synthesis parameters upon the catalytic activity of the obtained ZnO.
Keywords:Box–Behnken design (BBD), ZnO; photocatalysis; solvothermal crystallization; optimization
1. Introduction
In the last few decades, various semiconductor oxides have been employed as pho- tocatalysts (such as TiO2, ZnO, Fe2O3, WO3, BiVO4) [1]. Amongst these oxide materials, zinc-oxide (ZnO) has received tremendous attention, because of its versatility in many different fields of application, such as field emission displays [2], varistors [3], sensors [4], piezoelectrical component, and most extensively, has been studied in the field of heteroge- nous catalysis for wastewater treatment [5–7]. The basis of the photocatalytic phenomenon lies within the semiconductor nature of the oxide catalyst. When a semiconductor is ir- radiated by electromagnetic radiation with an energy quantum equal or higher than its band-gap energy, an electron from the valence band is transferred to the conduction band,
Nanomaterials2021,11, 1334. https://doi.org/10.3390/nano11051334 https://www.mdpi.com/journal/nanomaterials
leaving behind a positive charged hole. Subsequently these separated charges can interact separately with other molecules inducing redox reactions or generate highly reactive radi- cals with dissolved oxygen (•OH,•O2−), which contribute to the mineralization process of organic pollutants present in wastewater [8].
Nowadays the focus concerning ZnO is turned towards material science related aspects, where it is well-known that the structural, morphological, optical, and surface proprieties are the primary qualities, which determine the catalytic activity [9]. Thus, the research trends of ZnO photocatalyst are currently focused on identifying the mentioned properties and further optimizing them by different synthesis methods (sol-gel [10], low- temperature chemical precipitation [11], electrochemical deposition [12], chemical vapor deposition [13], etc.). The main challenge is to identify the parameters that could positively influence these properties and implicitly help to the design of the (photo) catalyst, in general or specifically, for the photodegradation of organic compounds in order to get a more efficient remediation of the contaminated water [14]. Solvothermal techniques for the synthesis of pure ZnO powders is most reported with the preparation of a liquid reaction mixture of a designated precursor. The crystallization process is promoted in a single step thermal treatment in a sealed laboratory autoclave, followed by a washing and drying step. The role of the solvothermal treatment is to influence the crystallizations’
kinetics and energetic aspects to promote an existing reaction towards the formation of ZnO crystals [15].
For the preparation of ZnO, several types of solvents, precursors, and additives can be used, which overall determines the possible reaction routes. The optimal synthetic conditions used to maximize the photocatalytic activity for the solvothermal preparation of ZnO nanoparticles has already been attempted several times [16,17]. A. Famengo et al. have reported that ZnO prepared in organic solvents, but especially in ethanol, leads to highly active photocatalysts than in water [18]. Also, several precursors have been studied to prepare ZnO using solvothermal method, such as inorganic salts (zinc- acetate [19,20], -nitrate [6,21]), as well as organic complexes (zinc-acetylacetonate [15], -oximate [22], -alkoxides [23]). One of the most investigated crystallization mechanisms is the controlled hydrolyzation of zinc-acetylacetonate that predominantly consists of the hydroxylation of the central Zn2+ion of the compound in mixtures of water and different organic solvents [24]. By this simple approach there were several successful attempts in the literature, which proved that the crystallization of the semiconductor from similar reaction mixture is directly responsible for the photocatalytic activity of the obtained ZnO samples, by manipulating the structure of the crystals and their morphology. In a typical solvothermal synthesis route involving the usual laboratory scale autoclaves, without any internal sensors, there is no possibility to monitor the crystallization process in the sealed autoclave. Therefore, the information is gathered only from the preliminary reaction mixture and the measurements carried out upon the obtained materials after the end of the thermal treatment step [18].
Mathematically speaking, this situation resembles very much with that of a black box system than a white box system, because between the input and output variables the internal relationships we could only assume the phenomenologically corresponding math- ematics. Therefore, we could only observe the overall sum of an empirical trend [24–26].
Consequently, the search for the simplest and most efficient control upon the photocatalytic activity of ZnO obtained through solvothermal synthesis has become a scientific curiosity and lately an annoyance. Most of the literature attends the description of varying one or two parameters. In most of the cases these singular or binary variable systems can be inter- preted with fair accuracy in a linear fashion. Due the many possible interactions between multiple parameters of the synthesis of ZnO, the obstacle to quantify an actual empirical correlation between all primary controllable parameters and photocatalytic activity roots to the fact of high experimental number. By adding new variables to the correlation, the amount of data required to describe the relation for further use to predict new experimental results grows exponentially. This is a requirement to ensure a closely accurate description
Nanomaterials2021,11, 1334 3 of 20
of their individual and interacting influence with the possibility of deviating from linear fashion behavior. Eventually this renders it a more risky and more consuming approach, in terms of resources and time. An exemplary case for such situation is the work of Jacek Wojnarowicz et al. Their results showed that by adjusting the water content of the solvent (ethylene-glycol) in range of 1–4% in microwave solvothermal synthesis of ZnO, the particle size can be easily controlled between 20 and 120 nm [19,20]. These types of research offer great results and should further increase their parameter range, but that would require a higher number of experiments, which is laborious and time consuming. A similar work also proves a quantifiable relationship between activity, size, and solvothermal synthesis parameters, but with a very extensive spectrum of experimental analysis [27].
In order to combat the above-mentioned disadvantages one approach would be to minimize the experimental and measurement requirements by fractional factorial exper- imental designs, which exploit the sparsity-of-effects principle to reduce a full factorial design. Fractional factorial design applied to examine synthesis parameter effects upon catalytic properties has proven to be a straightforward tool to find the optimum condi- tions to achieve a higher activity of the respective catalyst without using an extensive investigation (X-ray Photoelectron Spectroscopy (XPS), BET specific surface measurements etc.) of specific material properties related to the activity. Poortavasoly et al. have already successfully optimized the synthesis parameters of ZnO to obtain the maximum activity of composite structures using Taguchi design [28]. One of the most used experimental design is Box–Behnken design (BBD), which yields fairly stable results in case of systems with 4 up to 7 input parameters. As the precedence of already existing data confirms BBDs have been proven successful to determine empirical kinetic models for photocatalysis of several organic dyes, pharmaceuticals, and typical model pollutants (phenol, gallic acid, etc.), photochemical reactions or to optimize structural proprieties of semiconductors, it was not used in the case of pure ZnO synthesized via solvothermal method to optimize photocatalytic efficiency, even though such a design would require less than 40% of exper- iments of the initial full factorial design and less time and resource consuming material investigations techniques. Hence, in the present work, the 4 most generally controllable parameters of the solvothermal synthesis of ZnO have been investigated in a 3 level BBD and analysis of variance (ANOVA) was used to fit a full quadratic model and to subject the parameters to significance tests. In order to prove that experimental designs straightfor- ward can utilized to improve the activity of the catalyst and also to prevent unnecessary time- and resource-consuming investigations (such as XPS, BET).
2. Materials and Methods 2.1. Reagents and Materials
All chemicals used here were of reagent grade and used without further purification.
The materials used for the solvothermal synthesis for ZnO photocatalysts were the fol- lowing: zinc-acetylacetonate monohydrate (ZnAA2, Zn(C5H7O2)2·H2O, >99%, purchased from Alfa Aesar, Karlsruhe, Germany) as precursor; absolute ethanol (EtOH, 100%, Molar Chemicals, Halásztelek, Hungary) and double distilled ultrafiltered water (MQ, specific conductivity 0.055–0.056µS/cm) as solvents. The organic compound used as model pollu- tant for photodegradation was methyl orange (MO) (99.99%, VWR International, Debrecen, Hungary). A reference catalyst was used Evonik Aeroxide P25 (Essen, Germany).
2.2. Solvothermal Synthesis of ZnO
In each experiment we prepared a reaction mixture by dissolving a certain amount of ZnAA2 corresponding to a concentration of X1 (0.068, 0.136, and 0.204 molar) in a solvent prepared by mixing MQ water and absolute ethanol, corresponding to a certain concentration of ethanol, X2(30, 60, and 90%v/v). The precursor was first added to pure ethanol and stirred continuously for 40 min using magnetic stirrers at a speed of 500 rpm to ensure solution homogeneity then the corresponding amount of MQ water was added to obtain the desired solvent composition and was stirred for another 20 min. This was
Nanomaterials2021,11, 1334 4 of 20
followed by the transfer of the reaction mixture into a Teflon lined autoclave, with a 70%
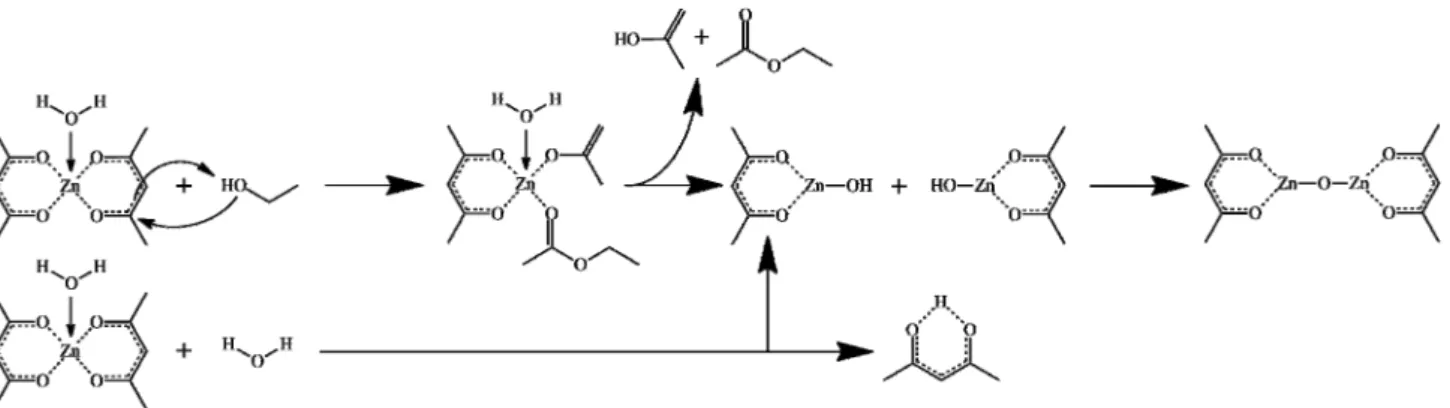
active volume, and subjected to a solvothermal treatment at a temperature of X3(90, 140, and 190◦C) with a heating rate of 5◦C min−1for a duration of X4(4, 8, and 12 h). In all the cases we obtained a white precipitate, which was washed several times with ethanol and dried for 12 h at 80◦C. All syntheses were carried out in triplicate and in 2 autoclaves with internal volumes of 150 and 300 mL, respectively. A proposed mechanism for the formation of ZnO from the precursor and solvent mixture is represented in Figure1.
2.2. Solvothermal Synthesis of ZnO
In each experiment we prepared a reaction mixture by dissolving a certain amount of ZnAA2 corresponding to a concentration of X1 (0.068, 0.136, and 0.204 molar) in a sol- vent prepared by mixing MQ water and absolute ethanol, corresponding to a certain con- centration of ethanol, X2 (30, 60, and 90% v/v). The precursor was first added to pure eth- anol and stirred continuously for 40 min using magnetic stirrers at a speed of 500 rpm to ensure solution homogeneity then the corresponding amount of MQ water was added to obtain the desired solvent composition and was stirred for another 20 min. This was fol- lowed by the transfer of the reaction mixture into a Teflon lined autoclave, with a 70%
active volume, and subjected to a solvothermal treatment at a temperature of X3 (90, 140, and 190 °C) with a heating rate of 5 °C∙min−1 for a duration of X4 (4, 8, and 12 h). In all the cases we obtained a white precipitate, which was washed several times with ethanol and dried for 12 h at 80 °C. All syntheses were carried out in triplicate and in 2 autoclaves with internal volumes of 150 and 300 mL, respectively. A proposed mechanism for the for- mation of ZnO from the precursor and solvent mixture is represented in Figure 1.
Figure 1. Proposed mechanisms of Zn-O-Zn bond formation from zinc-acetylacetonate monohydrate. 2.3. Characteriza- tion.
The obtained crystalline phases were identified by X-ray diffractometry (XRD, Rigaku MiniFlex II diffractometer, Tokyo, Japan) using Cu-Kα radiation (λ = 1.5406 Å) equipped with a graphite monochromator, between 29 and 39° to observe the 3 most im- portant and intensive characteristics of the ZnO wurtzite structure: (1 0 0), (0 0 2), (1 0 1) [29]. Mean primary crystallite sizes were calculated applying the Scherrer equation [16].
In order to evaluate a possible correlation between the structure and photodegrada- tion efficiency (PDE), ANOVA analysis was performed for the following values: ratio be- tween the intensities of the identified X-ray diffraction peaks and PDE fitted with a full quadratic function with the solvothermal parameters.
Jasco-V650 UV–vis spectrometer (Jasco, Tokyo, Japan) with an integration sphere (ILV-724) was used to determine the diffuse reflectance spectra (DRS) of catalysts in the wavelength range of 250–800 nm using BaSO4 as the reference standard. In order to deter- mine the band-gap energy of the synthesized samples the DRS were transformed using the Kubelka–Munk equation and using Tauc plot representation, respectively, the possi- ble electron transition was calculated by the first derivative of the DRS [11].
The morphology was analyzed by a Hitachi S-4700 Type II scanning electron micro- scope (Tokyo, Japan).
2.3. The Assessment of the Photocatalytic Activity
The photocatalytic efficiency of the ZnO samples was evaluated by the decolorization of MO in aqueous solutions in batch experiments. In a photochemical reactor system un- der UV-A irradiation (6 ×6 W fluorescent lamps, λmax ≈ 365 nm), the irradiation time was 1 h. For a typical experiment, 130 mL standard solution of 80 μM (C0) MO was prepared.
Figure 1.Proposed mechanisms of Zn-O-Zn bond formation from zinc-acetylacetonate monohydrate. 2.3. Characterization.
The obtained crystalline phases were identified by X-ray diffractometry (XRD, Rigaku MiniFlex II diffractometer, Tokyo, Japan) using Cu-Kαradiation (λ= 1.5406 Å) equipped with a graphite monochromator, between 29 and 39◦to observe the 3 most important and intensive characteristics of the ZnO wurtzite structure: (1 0 0), (0 0 2), (1 0 1) [29]. Mean primary crystallite sizes were calculated applying the Scherrer equation [16].
In order to evaluate a possible correlation between the structure and photodegradation efficiency (PDE), ANOVA analysis was performed for the following values: ratio between the intensities of the identified X-ray diffraction peaks and PDE fitted with a full quadratic function with the solvothermal parameters.
Jasco-V650 UV–vis spectrometer (Jasco, Tokyo, Japan) with an integration sphere (ILV-724) was used to determine the diffuse reflectance spectra (DRS) of catalysts in the wavelength range of 250–800 nm using BaSO4 as the reference standard. In order to determine the band-gap energy of the synthesized samples the DRS were transformed using the Kubelka–Munk equation and using Tauc plot representation, respectively, the possible electron transition was calculated by the first derivative of the DRS [11].
The morphology was analyzed by a Hitachi S-4700 Type II scanning electron micro- scope (Tokyo, Japan).
2.3. The Assessment of the Photocatalytic Activity
The photocatalytic efficiency of the ZnO samples was evaluated by the decolorization of MO in aqueous solutions in batch experiments. In a photochemical reactor system under UV-A irradiation (6×6 W fluorescent lamps,λmax≈365 nm), the irradiation time was 1 h.
For a typical experiment, 130 mL standard solution of 80µM (C0) MO was prepared.
In all experiments the catalyst was added according to a concentration of 1 g·L−1, then the obtained mixture was stirred in a dark environment for 20 min to ensure the adsorption-desorption equilibria. During the decolorization experiment, the suspension was continuously stirred (400 rpm) and, in addition, was purged by air to maintain the dissolved oxygen concentration.
Quantitative analyses of the MO present in the reaction solution during irradiation was carried out by UV-Vis spectroscopy at absorption maximum of 513 nm (using JASCO-V650 spectrophotometer, using the calibration curve presented in Figure S1 in the Supplemen- tary Material). Sampling was carried out as following: to ensure adsorption-desorption equilibrium to set in the solution was kept in the dark under stirring, after which samples
Nanomaterials2021,11, 1334 5 of 20
were taken every 10 min for 1 h. PDE was calculated by the conversion of the MO during photodegradation test, which was computed by using Equation (1).
Y = (C0−C1)/C0×100 [%], (1)
where Y is the conversion, C0is the concentration of MO after 10 min in the dark, and C1 denotes for the concentration of MO 40 min of the degradation.
The stability of the best performing sample was investigated through the reuse of the photocatalyst in 3 cycle degradation experiment. One cycle consisted in a degradation experiment described before, in addition of separation of the catalyst from the solution by centrifugation, followed by drying at 40◦C for 12 h. After each cycle the catalyst is reintroduced in a new experimental cycle.
2.4. Experimental Design
The Box–Behnken design (BBD) with response surface methodology (RSM) was ap- plied to investigate the influence of 4 major independent variables (molar concentration of the precursor in the reaction mixture, ethanol content of the solvent, temperature, and du- ration of the crystallization procedure) [17,25,28]. The interaction effects between synthesis variables and their influence on the response (dependent variable) were quantified. Fur- thermore, the developed prediction model was used to optimize the synthesis conditions for the higher photocatalytic degradation efficiency of the obtained ZnO.
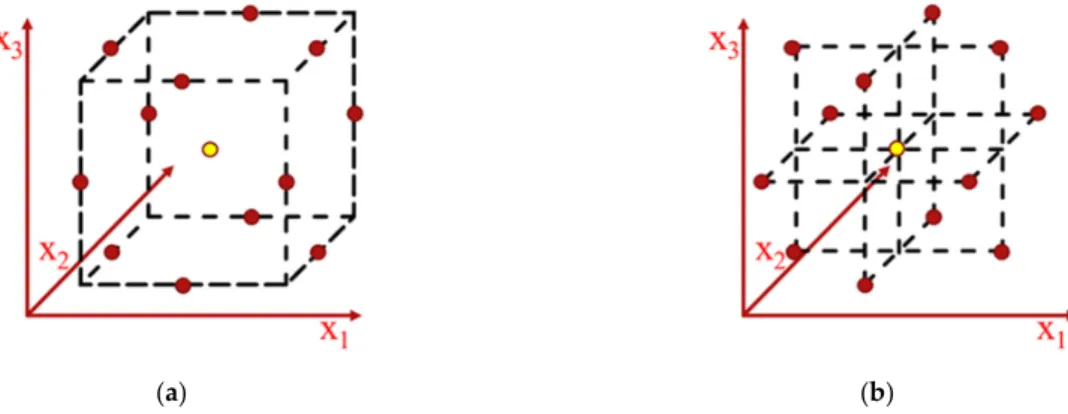
The Box–Behnken design is a second-order technique based on three-level factorial design (suited for three factors and more), with selected points from a system arrange- ment [20]. The Box–Behnken design based on RSM was chosen in this study since this design is more effective than the other RSM designs (full factorial designs and central composite design), as it requires a smaller set of experimental data for the case of four independent variables. A visual representation of reduced experimental designs (BBD and central composite design) can be seen in Figure2. The number of experimental runs required (N) is calculated by Equation (2).
N = 2k (k−1) + C, (2)
where the number of factors is k and the central point is C. To improve the stability and adequacy of the model, all factors have been adjusted to three levels:−1 (lower), 0 (medial), and 1 (higher) and the central point of the experimental design (with parameter coordinates:
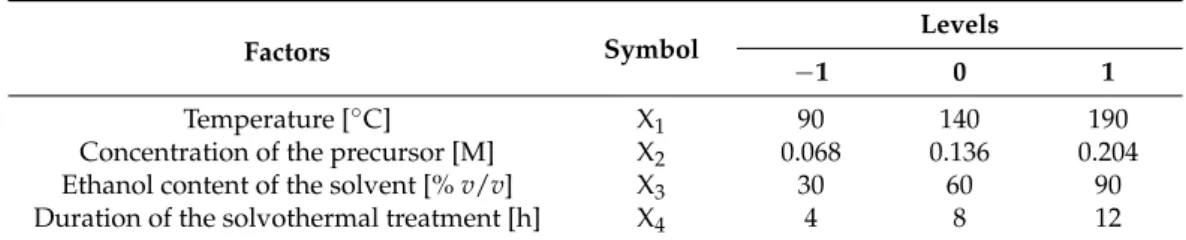
precursor concentration 0.136 M, 60%v/vethanol-water solvent, 140◦C, 8 h solvothermal treatment) was carried out three times. The chosen factors and their three levels are shown in Table1, and based on these data, the 27 experimental conditions were specified compared to 81 of a full factorial design. The notation of the synthesized ZnO-s is chosen by the value of the levels (−1, 0, 1) and according to the parameter order mentioned in Table1(e.g.:
ZnO 1001 is ZnO synthesized at 190◦C, with a precursor concentration of 0.136 M in 60%
ethanol-water mixture for 12 h).
Nanomaterials 2021, 11, x FOR PEER REVIEW 6 of 21
(a) (b)
Figure 2. The forms of Box–Behnken design: (a) cube; (b) three interlocking 3 factorial design.
Table 1. Variables, levels of variables and constrains used for Box–Behnken design.
Factors Symbol Levels
−1 0 1
Temperature [°C] X1 90 140 190
Concentration of the precursor [M] X2 0.068 0.136 0.204
Ethanol content of the solvent [% v/v] X3 30 60 90
Duration of the solvothermal treatment [h] X4 4 8 12
The results were statistically analyzed using Minitab v.17 software. The relationship between the set of independent variables and the response (conversion, crystallinity) was evaluated based on the Box–Behnken design with a full quadratic model shown in the Equation (3).
Y = b0 + b1X1 + b2X2 + b3X3 + b4X4 + b5X12 + b6X22 + b7X32 + b8X42 + b9X1X2 + b10X1X3 + b11X1X4 + b12X2X3 + b13X2X4
+ b14X3X4 + ε, (3)
where Y is the response (conversion, crystallinity), Xi (i = 1 to 4) are the independent var- iables and bi (i = 0 to 14), are regression coefficients.
ANOVA was applied to evaluate the quality of the model equation. The significance of model equation was statistically assessed by calculating the p-value (probability value—the probability of obtaining test results at least as extreme as the results actually observed during the test) with the significance level of 95% (p < 0.05). The model goodness of fit was evaluated by the coefficient of determination (R2) and the reproducibility of ex- perimental data was determined just by errors. The validation of the model was tested by the generation of new input variables based on the model. In order to have a better over- view of the model, response surfaces and contour plots were also generated.
3. Results and Discussion
In the case of all the samples the synthesis was performed with two autoclaves sim- ultaneously with 150 and 300 mL internal volumes and 70% fill. Yet, the results of struc- tural, optical, and photocatalytic activity investigations showed no observable differences, indicating that the process is not sensible of volumetric scaling in the respective range.
Further on there is no need to discuss separately or in comparison the samples prepared in the two different autoclaves.
3.1. Characterization
Some of the representative XRD patterns of the synthesized ZnO samples can be seen in Figure 3. As may be noticed, the samples contained only the hexagonal wurtzite crystal phase (P63mc), which was evidenced from the identified diffraction peaks (JCPDS card Figure 2.The forms of Box–Behnken design: (a) cube; (b) three interlocking 3 factorial design.
Table 1.Variables, levels of variables and constrains used for Box–Behnken design.
Factors Symbol Levels
−1 0 1
Temperature [◦C] X1 90 140 190
Concentration of the precursor [M] X2 0.068 0.136 0.204
Ethanol content of the solvent [%v/v] X3 30 60 90
Duration of the solvothermal treatment [h] X4 4 8 12
The results were statistically analyzed using Minitab v.17 software. The relationship between the set of independent variables and the response (conversion, crystallinity) was evaluated based on the Box–Behnken design with a full quadratic model shown in the Equation (3).
Y = b0+ b1X1+ b2X2+ b3X3+ b4X4+ b5X12+ b6X22+ b7X32+ b8X42+ b9X1X2+ b10X1X3+ b11X1X4+ b12X2X3
+ b13X2X4+ b14X3X4+ε, (3)
where Y is the response (conversion, crystallinity), Xi (i = 1 to 4) are the independent variables and bi(i = 0 to 14), are regression coefficients.
ANOVA was applied to evaluate the quality of the model equation. The significance of model equation was statistically assessed by calculating thep-value (probability value—the probability of obtaining test results at least as extreme as the results actually observed during the test) with the significance level of 95% (p< 0.05). The model goodness of fit was evaluated by the coefficient of determination (R2) and the reproducibility of experimental data was determined just by errors. The validation of the model was tested by the genera- tion of new input variables based on the model. In order to have a better overview of the model, response surfaces and contour plots were also generated.
3. Results and Discussion
In the case of all the samples the synthesis was performed with two autoclaves simultaneously with 150 and 300 mL internal volumes and 70% fill. Yet, the results of structural, optical, and photocatalytic activity investigations showed no observable differences, indicating that the process is not sensible of volumetric scaling in the respective range. Further on there is no need to discuss separately or in comparison the samples prepared in the two different autoclaves.
3.1. Characterization
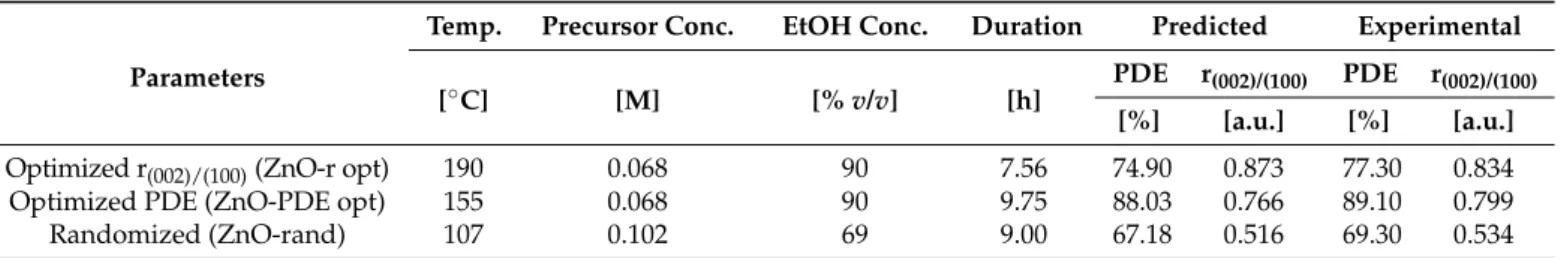
Some of the representative XRD patterns of the synthesized ZnO samples can be seen in Figure3. As may be noticed, the samples contained only the hexagonal wurtzite crystal phase (P63mc), which was evidenced from the identified diffraction peaks (JCPDS card no.0-3-0888) at scattering angles of 2θ: 31.40, 34.4, 36.3 corresponding to (1 0 0), (0 0 2), (1 0 1) crystallographic planes. Additional X-ray diffractograms can be found in the Supplementary Material Figure S2. On the diffraction patterns, it could be observed that the ratio of the intensities of these peaks differs from sample to sample (a few examples could be found on Figure3), yet in order to relate plausibly to the PDE, ANOVA was applied in function of the input parameters for the ratio of intensities of (0 0 2)/(1 0 0), which is discussed in later sections. Mean crystallite size was calculated, ranges 30–46 nm for the samples. The light absorption proprieties of the ZnO samples were determined by DRS and the band-gap values were calculated using Kubelka–Munk transformation and the first derivative of the spectra, yet no conclusive difference can be found amongst the samples, as all determined band-gap values range between 3.08–3.15 eV using Kubelka–
Munk transformation and 3.15–3.24 eV using the first derivative, which is a too small range of variation, but confirms that our catalysts should be active in the UV-A region. The DRS spectra can be found in the Supplementary Materials as Figure S3.
Nanomaterials2021,11, 1334 7 of 20
Nanomaterials 2021, 11, x FOR PEER REVIEW 7 of 21
no.0-3-0888) at scattering angles of 2θ: 31.40, 34.4, 36.3 corresponding to (1 0 0), (0 0 2), (1 0 1) crystallographic planes. Additional X-ray diffractograms can be found in the supple- mentary material Figure S2. On the diffraction patterns, it could be observed that the ratio of the intensities of these peaks differs from sample to sample (a few examples could be found on Figure 3.), yet in order to relate plausibly to the PDE, ANOVA was applied in function of the input parameters for the ratio of intensities of (0 0 2)/(1 0 0), which is dis- cussed in later sections. Mean crystallite size was calculated, ranges 30–46 nm for the sam- ples. The light absorption proprieties of the ZnO samples were determined by DRS and the band-gap values were calculated using Kubelka–Munk transformation and the first derivative of the spectra, yet no conclusive difference can be found amongst the samples, as all determined band-gap values range between 3.08–3.15 eV using Kubelka–Munk transformation and 3.15–3.24 eV using the first derivative, which is a too small range of variation, but confirms that our catalysts should be active in the UV-A region. The DRS spectra can be found in the Supplementary Materials as Figure S3.
Figure 3. XRD patterns of some representative ZnO samples showing the wurtzite crystal phase.
3.2. Photocatalytic Degradation Test
Methyl orange was chosen as model pollutant because it is the most widely used dye in testing the photocatalytic activity of various semiconductor catalyst [30], as well in the case of ZnO, because the photocatalytic degradation has proven sensible for material en- gineering of semiconductor photocatalyst, such as structure changes, surface proprieties, morphology, and light absorption proprieties [31,32]. All prepared samples have been proven to exhibit photocatalytic activity, as during photolysis experiments MO decolori- zation was <1 μM, the MO concentration does not change more than 2 μM, when the sus- pension is kept in dark and the change in the concentration is detectable only at the first sampling (after 10 min in dark); This assures that decolorization during irradiation is due to the influence of the catalysts.
As can be observed in Figure 4, the variation of the MO concentration shows strong linearity, as expected [33–35]. It is easy to observe that each experimental condition has an impact upon the photocatalytic activity; also, the ratio between the intensities of diffrac- tion peaks associated with crystal facets (0 0 2), (1 0 0) changes accordingly, but in order to adequately present the relation between them, the response surface plots will be used for discussion.
Figure 3.XRD patterns of some representative ZnO samples showing the wurtzite crystal phase.
3.2. Photocatalytic Degradation Test
Methyl orange was chosen as model pollutant because it is the most widely used dye in testing the photocatalytic activity of various semiconductor catalyst [30], as well in the case of ZnO, because the photocatalytic degradation has proven sensible for material engineering of semiconductor photocatalyst, such as structure changes, surface proprieties, morphology, and light absorption proprieties [31,32]. All prepared samples have been proven to exhibit photocatalytic activity, as during photolysis experiments MO decol- orization was <1µM, the MO concentration does not change more than 2µM, when the suspension is kept in dark and the change in the concentration is detectable only at the first sampling (after 10 min in dark); This assures that decolorization during irradiation is due to the influence of the catalysts.
As can be observed in Figure4, the variation of the MO concentration shows strong linearity, as expected [33–35]. It is easy to observe that each experimental condition has an impact upon the photocatalytic activity; also, the ratio between the intensities of diffraction peaks associated with crystal facets (0 0 2), (1 0 0) changes accordingly, but in order to adequately present the relation between them, the response surface plots will be used for discussion.
Nanomaterials 2021, 11, x FOR PEER REVIEW 8 of 21
(a) (b)
Figure 4. The MO degradation curves of some representative ZnO samples: (a) MO concentration vs. time; (b) C/C0 vs.
time.
3.3. Model Fitting and ANOVA Analysis
A fractional factorial design proves to be very effective in the present case because conducting experiments for just 27 sets of reaction coordinates is much more convenient to explore the effects of the parameters, as compared to the number of experiments re- quired for a full factorial design (34). This decrease in the number of experimental runs undoubtedly reduces the possibility of human error and saved 66% of the time and re- sources to conduct the synthesis and analysis. In general, the fractional experimental de- signs are sensible to the mathematical behavior of the output. To avoid interference or false-positive results from the experimental design, the PDE values were evaluated only in that time interval from the degradation, where the degradation curve could be consid- ered linear (the fit of linear equation exceeded an R2 ≥97%), so degradation values at 40 min were selected for input PDE values. Equation (2) was fitted separately for the PDE, ratio of intensities (0 0 2)/(1 0 0), which was further evaluated by ANOVA analysis. The correlation resulted from the full quadratic equation fitting with their respective coeffi- cient values are presented in Equation (4), respectively (5) and were further used to opti- mize the synthesis method to maximize the photocatalytic activity of ZnO.
PDE = −168.8 + 1.629X1 + 906.6X2 + 0.999X3 + 4.98X4 − 0.006818X12 − 1232X22 − 0.00558X32 − 0.5951X42 − 1.007X1X2 + 0.004417X1X3 + 0.01362X1X4 − 6.581X2X3 − 12.59X2X4 + 0.05979X3X4 (4) r(002)/(100) = 0.854 − 0. 00404X1 − 1.28X2 − 0.00929X3 + 0.0107X4 + 0.000005X12 + 8.94X22 + 0.000117X32 −
0.00214X42
− 0.01471X1X2 + 0.000035X1X3 + 0.0003X1X4 + 0.00135X2X3 − 0.0083X2X4 − 0.000385X3X4, (5) where, X1, X2, X3, and X4 are the process factors of the following parameters: temperature (°C), concentration of the precursor (M), ethanol content of the solvent (%) v/v of EtOH, and the duration of the solvothermal treatment (h), and PDE (%) and r(002)/(100) (ratio of intensities of diffraction peaks corresponding to (0 0 2) and (1 0 0) crystallographic planes).
As shown in Figure 5a, good agreement exists between the predicted results and those obtained from experiments for both responses. The ANOVA results of ZnO photocatalysts synthesis are shown in Tables 2 and 3.
−20 −10 0 10 20 30 40 50 60 70
0 10 20 30 40 50 60 70 80
CMO(µmol•L-1)
Irradiation time (min) ZnO -1001 ZnO 0-110 ZnO 0110 ZnO 0000 Photolysis Lamps
off
0 10 20 30 40 50 60 70
0.0 0.2 0.4 0.6 0.8 1.0
C/C0
Irradiation time(min) ZnO -1001
ZnO 0-110 ZnO 0110 ZnO 0000 Photolysis
Figure 4. The MO degradation curves of some representative ZnO samples: (a) MO concentration vs. time; (b) C/C0 vs. time.
3.3. Model Fitting and ANOVA Analysis
A fractional factorial design proves to be very effective in the present case because conducting experiments for just 27 sets of reaction coordinates is much more convenient to
explore the effects of the parameters, as compared to the number of experiments required for a full factorial design (34). This decrease in the number of experimental runs undoubt- edly reduces the possibility of human error and saved 66% of the time and resources to conduct the synthesis and analysis. In general, the fractional experimental designs are sensible to the mathematical behavior of the output. To avoid interference or false-positive results from the experimental design, the PDE values were evaluated only in that time interval from the degradation, where the degradation curve could be considered linear (the fit of linear equation exceeded an R2≥97%), so degradation values at 40 min were selected for input PDE values. Equation (2) was fitted separately for the PDE, ratio of intensities (0 0 2)/(1 0 0), which was further evaluated by ANOVA analysis. The correlation resulted from the full quadratic equation fitting with their respective coefficient values are presented in Equation (4), respectively (5) and were further used to optimize the synthesis method to maximize the photocatalytic activity of ZnO.
PDE =−168.8 + 1.629X1+ 906.6X2+ 0.999X3+ 4.98X4−0.006818X12−1232X22−0.00558X32−0.5951X42
−1.007X1X2+ 0.004417X1X3+ 0.01362X1X4−6.581X2X3−12.59X2X4+ 0.05979X3X4 (4) r(002)/(100)= 0.854−0. 00404X1−1.28X2−0.00929X3+ 0.0107X4+ 0.000005X12+ 8.94X22+ 0.000117X32
−0.00214X42−0.01471X1X2+ 0.000035X1X3+ 0.0003X1X4+ 0.00135X2X3−0.0083X2X4−0.000385X3X4, (5) where, X1, X2, X3, and X4are the process factors of the following parameters: temperature (◦C), concentration of the precursor (M), ethanol content of the solvent (%)v/vof EtOH, and the duration of the solvothermal treatment (h), and PDE (%) and r(002)/(100)(ratio of intensities of diffraction peaks corresponding to (0 0 2) and (1 0 0) crystallographic planes).
As shown in Figure5a, good agreement exists between the predicted results and those obtained from experiments for both responses. The ANOVA results of ZnO photocatalysts synthesis are shown in Tables2and3.
Nanomaterials 2021, 11, x FOR PEER REVIEW 9 of 21
(a)
(b)
Figure 5. Experimental runs of Box–Behnken design with the comparison between predicted and experimental photocatalytic degradation efficiency: (a) in case PDE; (b) in case ratio of intensities (0 0 2)/(1 0 0).
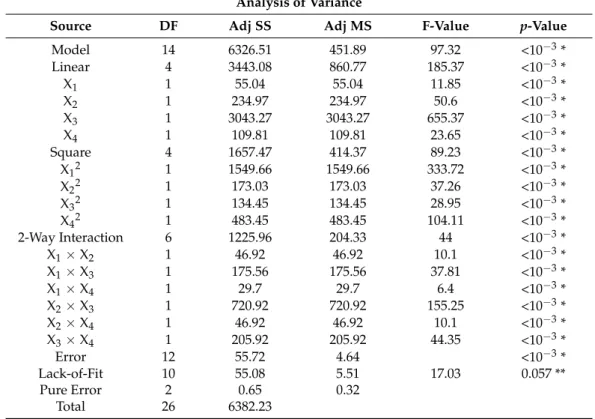
Table 2. ANOVA results for quadratic model of ZnO using Box–Behnken design for photocata- lytic measurements.
Analysis of Variance
Source DF Adj SS Adj MS F-Value p-Value
Model 14 6326.51 451.89 97.32 <10−3 * Linear 4 3443.08 860.77 185.37 <10−3 * X1 1 55.04 55.04 11.85 <10−3 * X2 1 234.97 234.97 50.6 <10−3 * X3 1 3043.27 3043.27 655.37 <10−3 * X4 1 109.81 109.81 23.65 <10−3 * Square 4 1657.47 414.37 89.23 <10−3 * X12 1 1549.66 1549.66 333.72 <10−3 * X22 1 173.03 173.03 37.26 <10−3 * X32 1 134.45 134.45 28.95 <10−3 * X42 1 483.45 483.45 104.11 <10−3 * 2-Way Interaction 6 1225.96 204.33 44 <10−3 * X1 × X2 1 46.92 46.92 10.1 <10−3 * X1 × X3 1 175.56 175.56 37.81 <10−3 * X1 × X4 1 29.7 29.7 6.4 <10−3 *
-1-100 -1100
-10-10 -1010
-100-1 -1001
1-100 1100
10-10 1010
100-1 1001
0-1-10 0-110
0-10-1 0-101
01-10 0110
010-1 0101
00-1-1 00-11
0011 001-1
0000 0000
0000 0
10 20 30 40 50 60 70 80 90 100
PDE (%)
ZnO experimental coordinates
PDE
Experimental Predicted
-1-100 -1100
-10-10 -1010
-100-1 -1001
1-100 1100
10-10 1010
100-1 1001
0-1-10 0-110
0-10-1 0-101
01-10 0110
010-1 0101
00-1-1 00-11
0011 001-1
0000 0000
0000 0.0
0.2 0.4 0.6 0.8 1.0
r(002)/(100)
ZnO experimental coordinates
Ratio of (002)/(100) Experimental Predicted
Figure 5.Experimental runs of Box–Behnken design with the comparison between predicted and exper- imental photocatalytic degradation efficiency: (a) in case PDE; (b) in case ratio of intensities (0 0 2)/(1 0 0).
Nanomaterials2021,11, 1334 9 of 20
Table 2. ANOVA results for quadratic model of ZnO using Box–Behnken design for photocat- alytic measurements.
Analysis of Variance
Source DF Adj SS Adj MS F-Value p-Value
Model 14 6326.51 451.89 97.32 <10−3*
Linear 4 3443.08 860.77 185.37 <10−3*
X1 1 55.04 55.04 11.85 <10−3*
X2 1 234.97 234.97 50.6 <10−3*
X3 1 3043.27 3043.27 655.37 <10−3*
X4 1 109.81 109.81 23.65 <10−3*
Square 4 1657.47 414.37 89.23 <10−3*
X12 1 1549.66 1549.66 333.72 <10−3*
X22 1 173.03 173.03 37.26 <10−3*
X32 1 134.45 134.45 28.95 <10−3*
X42 1 483.45 483.45 104.11 <10−3*
2-Way Interaction 6 1225.96 204.33 44 <10−3*
X1×X2 1 46.92 46.92 10.1 <10−3*
X1×X3 1 175.56 175.56 37.81 <10−3*
X1×X4 1 29.7 29.7 6.4 <10−3*
X2×X3 1 720.92 720.92 155.25 <10−3*
X2×X4 1 46.92 46.92 10.1 <10−3*
X3×X4 1 205.92 205.92 44.35 <10−3*
Error 12 55.72 4.64 <10−3*
Lack-of-Fit 10 55.08 5.51 17.03 0.057 **
Pure Error 2 0.65 0.32
Total 26 6382.23
* significant (p< 0.05); ** not significant; S = 1.83, R2= 0.9913, R2(adj) = 0.9811, R2(pred) = 0.9501.
Table 3. ANOVA results for quadratic model of ZnO using Box–Behnken design for the ratio of intensities of X-ray diffraction peaks.
Analysis of Variance
Source DF Adj SS Adj MS F-Value p-Value
Model 14 0.693 0.050 32.5 <10−3*
Linear 4 0.557 0.139 91.31 <10−3*
X1 1 0.001 0.001 0.38 0.551 **
X2 1 0.044 0.044 28.98 <10−3*
X3 1 0.506 0.506 331.72 <10−3*
X4 1 0.006 0.006 4.17 0.064 **
Square 4 0.092 0.023 15.16 <10−3*
X12 1 0.001 0.001 0.52 0.484 **
X22 1 0.009 0.009 5.98 <10−3*
X32 1 0.059 0.059 38.92 <10−3*
X42 1 0.006 0.006 4.09 0.066 **
2-Way Interaction 6 0.044 0.007 4.85 <10−3*
X1×X2 1 0.010 0.010 6.56 <10−3*
X1×X3 1 0.011 0.011 7.44 <10−3*
X1×X4 1 0.014 0.014 9.45 <10−3*
X2×X3 1 0.000 0.000 0.02 0.89 **
X2×X4 1 0.000 0.000 0.01 0.91 **
X3×X4 1 0.009 0.009 5.61 <10−3*
Error 12 0.018 0.002 <10−3*
Lack-of-Fit 10 0.018 0.002 16.37 0.059 **
Pure Error 2 0.000 0.000
Total 26 0.712
* significant (p< 0.05); ** not significant; S = 0.039, R2= 0.9743, R2(adj) = 0.9443, R2(pred) = 0.8531.
From the data presented in Figure5, it becomes obvious that the parameters do show great variance upon the activity. One of the first measures for a good fit is the low standard deviation values (S) of 2.15(2) for PDE and 0.039(0) for the crystallographic ratio. However, low S values do not indicate properly that the model meets the model assumptions. R values is a basic statistical measure of how close the data are to the fitted values, which in present case, for both responses (PDE and r(002)/(100)) the R2 are 0.9913 and 0.9743, respectively, and are indicating the validity of the predicted PDE and r(002)/(100); also, a relatively high value of the adjusted R2coefficients (R2adj is 0.9338 for PDE and 0.9443 for r(002)/(100)) was obtained, which means that the final prediction is in good agreement with the experimental results and accounts for 99% (PDE) and 97% (r(002)/(100)) of the variance [28,29]. ANOVA analysis reveals that all the studied factors are with a highly significantpvalue (p< 0.05) for PDE, but for the crystallographic parameter only half of the parameters exceeds the significance threshold. The Variance inflation factor (VIF, it is presented in the Supplementary Material as Table S1) values are 1.00 or 1.25 in both cases, which confirms that the predictors are not correlated and there is no multicollinearity in none of the models, subsequently the predictors are stable. The lack of the fits’ significance isp= 0.054 (for PDE) andp= 0.059 (for intensity ratio) and are close to the threshold pvalue (0.050), which can be the consequence of the significance of the square terms, as it could suggest that some factors tend more toward non-linear behavior, as expected by a thermal process [25].
The significance of the terms in the full quadratic equation is much different in the case of ratio of intensities (0 0 2) and (1 0 0), as can be seen in Table3, half of the terms shows significance. Linear and second order terms’ significance appears for the ethanol precursor concentration and temperature related interaction terms dominates.
Taking in consideration that temperature and duration of solvothermal treatment only appear significant in interaction terms suggests that these parameters predominately produce impact during the main crystallization, implying the secondary crystallization is less occurrent [24].
The same model fitting was carried out for mean crystallite size of the samples.
Unfortunately, the size showed no conclusive correlation with the synthesis parameters.
This probably can be explained by the relatively narrow range, 30–46 nm, but the standard deviation is higher for 3 nm and R2is less than 0.6, which makes it ineligible to uphold the proposed quadratic model.
3.4. Adequacy of the Regression Model
In order to optimize a higher PDE of ZnO photocatalysts by avoiding poor and undesired results, a fit of the experimental data was performed. Figure6shows all the diagnostic plots of ZnO optimization with both photocatalytic degradation efficiency and the ratio of the two mentioned crystallographic peaks to evaluate the adequacy of the regression model of prediction. From Figure5, it can already be seen that both the PDE and the r(002)/(100)values predicted by the fitted model are very close to the experimentally determined (the actual values are presented in Tables S2 and S3 in the Supplementary Material). Generally, the residuals must be evaluated as their distribution signify if the model is a real description of the mathematical behavior of the experimental data, which is revealed at Figure6. In our case, one of the most significant observations at all diagnostic plots is that for both analyses the residuals are randomly distributed, as shown on the normal probability plots of residuals as all are situated close to the reference line, which represents a perfect normal distribution and residual vs. fitted value plots, so we could consider the errors present are independent and do not show skew or specific tendency out of randomness. These align with data presented in Figure S3a,b as the histogram of the residuals shows a good symmetrical distribution, revealing no outlier run in the considered range.
Nanomaterials2021,11, 1334 11 of 20
Nanomaterials 2021, 11, x FOR PEER REVIEW 11 of 21
that the predictors are not correlated and there is no multicollinearity in none of the mod- els, subsequently the predictors are stable. The lack of the fits’ significance is p = 0.054 (for PDE) and p = 0.059 (for intensity ratio) and are close to the threshold p value (0.050), which can be the consequence of the significance of the square terms, as it could suggest that some factors tend more toward non-linear behavior, as expected by a thermal process [25].
The significance of the terms in the full quadratic equation is much different in the case of ratio of intensities (0 0 2) and (1 0 0), as can be seen in Table 3, half of the terms shows significance. Linear and second order terms’ significance appears for the ethanol precursor concentration and temperature related interaction terms dominates. Taking in consideration that temperature and duration of solvothermal treatment only appear sig- nificant in interaction terms suggests that these parameters predominately produce im- pact during the main crystallization, implying the secondary crystallization is less occur- rent [24].
The same model fitting was carried out for mean crystallite size of the samples. Un- fortunately, the size showed no conclusive correlation with the synthesis parameters. This probably can be explained by the relatively narrow range, 30–46 nm, but the standard deviation is higher for 3 nm and R2 is less than 0.6, which makes it ineligible to uphold the proposed quadratic model.
3.4. Adequacy of the Regression Model
In order to optimize a higher PDE of ZnO photocatalysts by avoiding poor and un- desired results, a fit of the experimental data was performed. Figure 6 shows all the diag- nostic plots of ZnO optimization with both photocatalytic degradation efficiency and the ratio of the two mentioned crystallographic peaks to evaluate the adequacy of the regres- sion model of prediction. From Figure 5, it can already be seen that both the PDE and the
r(002)/(100) values predicted by the fitted model are very close to the experimentally deter-
mined (the actual values are presented in Tables S2 and S3 in the Supplementary material).
Generally, the residuals must be evaluated as their distribution signify if the model is a real description of the mathematical behavior of the experimental data, which is revealed at Figure 6. In our case, one of the most significant observations at all diagnostic plots is that for both analyses the residuals are randomly distributed, as shown on the normal probability plots of residuals as all are situated close to the reference line, which represents a perfect normal distribution and residual vs. fitted value plots, so we could consider the errors present are independent and do not show skew or specific tendency out of random- ness. These align with data presented in Figure S3a,b as the histogram of the residuals shows a good symmetrical distribution, revealing no outlier run in the considered range.
(a) (b)
−4 −3 −2 −1 0 1 2 3 4
1 2 5 10 20 30 4050 60 70 80 90 95 98 99
Percent
Residual
Reference line r(002)/(100)
−0.06 −0.04 −0.02 0.00 0.02 0.04 0.06 1
2 5 10 20 30 4050 60 70 80 90 95 98 99
Percent
Residual
Reference line r(002)/(100)
Nanomaterials 2021, 11, x FOR PEER REVIEW 12 of 21
(c) (d)
(e) (f)
Figure 6. Diagnostic plots of ZnO synthesis results: normal probability plot of residual: (a) for PDE; (b) for r(002)/(100) and residual vs. fitted values: (c) for PDE; (d) for r(002)/(100); standardized effects of the equation terms (e) for PDE; (f) for r(002)/(100).
From the standardized effects of the equation terms plot (Figure 6e,f) can be observed that the significance of 3 terms, which produce major effect upon the output follows the following order: for PDE X3 > X12 > X2X3 and for r(002)/(100) X3 > X32 > X2. As it can be seen, the highest impact on both responses is the composition of the solvent applied during the solvothermal treatment, also worth mentioning that the duration falls beyond the other factors in significance, and the impact on both responses are much less, implying that crystallization process takes place relatively fast, the effect of these terms it is discussed further in alignment with the contour and response surface plots.
3.5. Effect of Synthesis Factors as Surface and Contour Plots
The effect of each factor on the synthesis of ZnO photocatalysts was investigated in a 3-D response surface and contour (2-D) graphs created using the full quadratic model.
Figures 7 to 8 show the effect of the different interactions between all the factors by vary- ing two factors within the experimental ranges, while the other factors were held at the central point values (C with parameters: precursor concentration 0.136 M, 60% v/v etha- nol-water solvent, 140 °C, 8 h solvothermal treatment). These effects were explained indi- vidually using statistical values, bringing more evidence on how the effects occurred, while varying the factors within specified ranges. Even though almost all of the terms of the fitted equation contribute significantly in case of PDE, we mentioned before, that
0 10 20 30 40 50 60 70 80 90 100
−4
−3
−2
−1 0 1 2 3 4
Residual
Fitted PDE value 0.0 0.1 0.2 0.3 0.4 0.5 0.6 0.7 0.8 0.9
−0.08
−0.06
−0.04
−0.02 0.00 0.02 0.04 0.06 0.08
Residual
Fittedr(002)/(100) value
Figure 6.Diagnostic plots of ZnO synthesis results: normal probability plot of residual: (a) for PDE; (b) for r(002)/(100)and residual vs. fitted values: (c) for PDE; (d) for r(002)/(100); standardized effects of the equation terms (e) for PDE; (f) for r(002)/(100).
From the standardized effects of the equation terms plot (Figure6e,f) can be observed that the significance of 3 terms, which produce major effect upon the output follows the following order: for PDE X3> X12> X2X3and for r(002)/(100)X3> X32> X2. As it can be seen, the highest impact on both responses is the composition of the solvent applied during the solvothermal treatment, also worth mentioning that the duration falls beyond the other factors in significance, and the impact on both responses are much less, implying that