Fundamentals of Economics
/Textbook for an Upgrading Module/
Fundamentals of Economics
/Textbook for an Upgrading Module/
Written by:
Zsuzsanna Bacsi
University of Pannonia, Georgikon Faculty Edited by:
Zsuzsanna Bacsi
Reviewed by:
József Molnár
St Stephen University, Gödöllő,Institute for Economic Analysis and Methodology
University of Debrecen, Centre for Agricultural and Applied Economic Sciences • Debrecen, 2013
© Zsuzsanna Bacsi, 2013
Manuscript finished: Auguszt, 31, 2013
University of Debrecen Faculty of Applied Economics and Rural
Development
University of Pannonia Georgikon Faculty
ISBN 978- 615-5183-88-1
UNIVERSITY OF DEBRECEN CENTRE FOR AGRICULTURAL AND APPLIED ECONOMIC SCIENCES
This publication is supported by the project numbered TÁMOP-4.1.2.A/1-11/1-2011-0029.
CONTENTS
Preface...6
1. The Scope, Problems and Concepts of Economics...7
1.1. Economy, Economic Decisions, Scarcity, Factors of Production...7
1.1.1. Principles and Methods of Economics...7
1.1.2. Factors of Production...10
1.2. The Basic Economic Questions, the Production Possibility Frontier...11
1.2.1. The Three Basic Economic Questions...11
1.2.2. The Production Possibility Frontier...12
1.2.3. Economic Coordination...13
1.3. Microeconomics and Macroeconomics...14
1.4. The Key Actors of the Economy: Households, Firms, Government...16
2. Basic Concepts of the Market...19
2.1. The Market, Key Factors and Basic Forms...19
2.2. Demand, Supply, Market Equilibrium and Its Graph, Market-Clearing Price ...20
2.2.1. Demand...20
2.2.2. Supply ...23
2.2.3. Equilibrium of Supply and Demand...26
2.3. Elasticity of Demand and Supply...28
3. The Demand Side of Output Markets – Elements of Consumer Behaviour ...31
3.1. Budget Constraints, the Budget Line...31
3.2. Consumer Preferences, Indifference Curves and Substitution...35
3.3. Utility, Utility Function, Marginal Utility...39
3.4. The Consumer’s Optimal Choice...41
3.5. The Impact of Changes in Incomes and Prices on the Consumer’s Optimal Choice.. .45
4. The Supply Side of the Product Market...49
4.1. Time in Microeconomics...50
4.2. Technical Relationships of Production...50
4.2.1. The Short-Run Production Function, Average Product, Marginal Product...50
4.2.2. Long-Run Technical Relationships of Production, Isoquants ...53
4.2.3. Returns to Scale, Economies of Scale...56
4.3. Costs of Production, Short-Run Cost Functions...58
4.4. Expenditures and Costs, Revenues and Profit...61
4.5. The Supply of a Competitive Firm, Profit Maximisation in Competitive Markets...64
4.6. Imperfect Competition...65
4.6.1. Monopoly, Oligopoly, Monopolistic Competition...66
4.6.2. Profit Maximising Behaviour of the Monopoly...67
5. The Market of the Factors of Production...73
5.1. Demand and Supply of the Factors of Production...73
5.2. The Labour Market...73
5.3. The Market of Capital Goods...75
5.3.1. The Market of Real Capital...75
5.3.2. The Financial Markets...76
5.4. The Land Market...78
5.5. The Entrepreneurial Skills...79
6. Market Imperfections, Market Failures...82
6.1. Differences of Private and Public Choices...82
6.2. The Concept of Public Goods, Demand and Supply...84
6.3. Externalities...86
6.3.1. The Concept and Categories of Externalities...86
6.3.2. Economic Theories on Externalities, the Internalisation of Externalities ...87
7. Tools and Concepts to Analyse the Macroeconomy...90
7.1. The Objectives, Problems and Tools of Macroeconomics...90
7.2. Basic Concepts of Macroeconomics ...92
7.2.1. Output, Consumption, Investment, Price Level, Inflation...92
7.2.2. Aggregate Demand, Aggregate Supply, Unemployment...94
7.3. Sectors of the Macroeconomy...95
8. Measuring the Performance of the Macroeconomy, the Flow of Incomes ...98
8.1. Basic Concepts of Measuring Macroeconomic Performance, the SNA...98
8.2. The Circular Flow of Incomes in the Macroeconomy, Equilibrium Conditions in the Four-Sector Model...102
9. The Goods Market and the Money Market, Aggregate Demand...107
9.1. Key Factors of Consumption and Investment ...107
9.1.1. Disposable Income and Household Consumption...107
9.1.2. The Consumption Function ...108
9.1.3. The Planned Investment ...110
9.2. Government Spending, Net Export, Equilibrium in the Goods Market...112
9.2.1. The Roles of G, X and IM...112
9.2.2. The Equilibrium of the Goods Market in the Four-Sector Model...113
9.3. A Functions of Money, Commodity Money, Fiat Money...114
9.4. Money Supply, Creation of Money in Contemporary Economy...117
9.5. Factors Determining the Demand for Money, The Money Demand Function, Equilibrium in the Money Market...118
9.6. The Keynesian Model of Macroeconomic Equilibrium, the Determination of Aggregate Demand...120
10. The Total Output of the Economy, the Labour Market and the Price Level...124
10.1. The Macroeconomic Production Function, Total Output and Employment...124
10.2. Elements of Labour Supply, the Relation to Real Wage...125
10.3. Relationship Between Labour Demand and Real Wage...128
10.4. Equilibrium in the Labour Market, Disequilibrium and Unemployment...129
10.5. Determination of Aggregate Supply and its Relation to the Labour Market...131
10.6. The Determination of the Price Level...133
10.7. Inflation – Concept, Measurement, Demand-side and Supply-side Inflation, the Price-Wage Spiral...134
11. Instruments of Economic Policy, Foreign Relations of an Economy ...138
11.1. The Justification for Government Intervention, Areas and Roles...138
11.2. Basic Concepts and Instruments of Fiscal and Monetary Policy...138
11.3. The Foreign Balance of Payments, Government Deficit and Debt...142
11.4. Understanding and Measuring Economic Growth, Possibilities for Promoting Growth...143
11.5. Business Cycles...146
References ...150
Glossary ...151
Preface
The present textbook is written for MSc students without sufficient preliminary training in economics, and its objective is to provide a brief summary of the economic
concepts necessary for their further studies. The material can be covered in a one-semester course of 14 weeks and 2 contact hours per week. The textbook assumes preliminary knowledge of basic mathematics – not more than what is taught in secondary schools, while the explanations facilitate the refreshment of the necessary mathematical skills, too.
The structure of the textbook follows the general build-up of introductory texts of economics, although in somewhat condensed form, to comply with volume restrictions. The first chapter discusses basic economic concepts, followed by the operations of the market (Chapter 2), then Chapter 3 and Chapter 4 explain the basic concepts and tools of microeconomics (consumer behaviour, producer decisions, production function, short-run costs, profit-maximising decisions), relying on marginal analysis. After that the specialities of factor markets (Chapter 5) and imperfect markets, market failures are discussed (Chapter 6).
The second part of the textbook – that is, Chapters 7 to 11 – overview the functioning of the economy in macro level. First the basic tools and concepts of macroeconomic analysis are explained, then Chapter 8 summarises the indicators of macroeconomic performance and incomes – GDP and related measures. Chapter 9 discusses the two main markets of the economy – the goods market and the money market, – and ends with the Keynesian model of macroeconomic equilibrium. Chapter 10 explains macroeconomic output and aggregate supply, covering production, employment, the labour market and unemployment. The end of the chapter deals with the equilibrium of aggregate demand and aggregate supply, the price level and the causes of inflation. The last chapter (Chapter 11) offers an explanantion for economic policy, relying on the macroeconomic tools and methods developed in the earlier chapters; the key concepts of fiscal and monetary policy are introduced, and some of the current policy issues – the current account, government deficit and national debt, economic growth, development and business cycles – are discussed.
Considering the volume limitations of the textbook it was not possible to discuss the covered topics in full depth – for this purpose many excellent texts are available, and generally used in the faculties of economics of universities not only in Hungary but throughout the world; many of these are listed at the end of the textbook, in the References section. Here our objective was to provide sufficient knowledge for the students of the textbook to understand the processes of the economy in which they live and work – as consumers, employees, or entrepreneurs, or decision makers in the public sector, or voters at parliamentary elections trying to influence economic decision-making; and at the same time, to acquire the skills and knowledge needed for their further business and management studies.
The terminology, definitions and concepts discussed here are based on a wide range of excellent textbooks, of which only the most important ones are included in the text itself and in References, to keep them readable, and concise. The textbook does not provide a full mathematical discussion of the topic, and the introduced mathematical formulae do not go beyond the basic secondary school level; instead of mathematical precision the emphasis was on interpretation and explanation of the economic processes discussed.
Chapter 1: The Scope, Problems and Concepts of Economics
1.1. Economy, Economic Decisions, Scarcity, Factors of Production
The majority of students entering university has no previous experience in economic studies. However, in everyday life, we encounter many problems and decisions for which the ability to understand how the economy functions is necessary. The tools and methods of economics give us help for this.
Why do we study economics at all? For many of the students attending a course in economics the answer is simple: because it is a compulsory course in the curriculum. The real explanation, however, was given in the former paragraph. Everyone benefits from understanding the operations of the markets, either as consumers, or producers of some goods.
The employees, workers try to sell their knowledge and skills at the labour market to firms, and then they want to spend the received wages or salaries in the market to buy some product or service. It is important to understand the way these markets are influenced by various factors of the economy, how they respond to external influences, because otherwise we are unable to make responsible decisions about when to buy a car, when to start saving for a house, and whether to keep savings in the bank, or buy a washing machine on credit. It is crucial to understand the opportunity cost of our decisions, that is, to know what we sacrifice to attain our aim. Besides, as members of the society, responsible citizens, we can regularly vote in elections about what kind of government we prefer to lead the country. The government directs economic policy, and if we understand the economic background of policy decisions, we have a chance to cast our vote for the economic policy we prefer (Mabry – Ulbrich, 1994). Thus as actors of the society and the economy, as conscious and well informed citizens we may make conscious decisions based on economic knowledge.
Economics is a basic discipline supporting many applied economic disciplines. It defines a set of concepts, rules and relationships. Business management, marketing, finance, agricultural economics, or economic policy cannot be studied without the foundations provided by the science of economics.
The science of economics – similar to mathematics – relies on logical reasoning and mathematical tools. At the same time it heavily builds upon sociology and history, as the object of its analysis is the same as of those, namely the behaviour and decisions made by human beings and social groups.
1.1.1. Principles and Methods of Economics
Economics teaches us to make decisions and choices. The individuals make countless decisions: whether to spend the next hour on studying or going to a restaurant;
whether to spend our money on a glass of Coke or of milk; whether to choose nursing or engineering as an occupation, whether to choose weightlifting, wrestling, or playing golf as our recreational activity. As a group, people make decisions through their elected governments about how to spend the tax revenues: whether to construct highways or dams, modernise national defense or build public housing. If all of the above are necessary, then how to share the available resources among them? This means that the individual and the society requires goods and services for maintaining life, and the lack of these creates
motivation to satisfy these needs, or wants. Wants are subjective feelings of deficiency, experienced by the individual or the community, motivating them to attain goods and services necessary to maintain life (Farkasné Fekete – Molnár, 2007). Economics deals with needs related to economic activities, and these needs are satisfied by acquiring goods. The process of satisfying needs or wants by acquiring goods is called consumption.
Wy do we have to make choices? Because resources required for producing goods and services are limited, as well as the resources we can use for purchasing and consuming them.
Resources, however, could be utilised for almost unlimited purposes. One of the most important limited resource is time. The day lasts 24 hours, the human life span is limited. The time spent on studying cannot be utilised for playing tennis or making a cup of coffee.
Agricultural land is also a limited resource, as well as coal, oil, the number of welding machines, concrete, and human labour, while their possible uses are unlimited. Simply there are not enough resources to produce all the cars, jeans, computers, televisions, or food needed by people.
Scarcity: The availability of resources is limited, while human needs to utilise these resources are unlimited.
As productive resources are scarce, it is necessary to make choices about their utilisation. Economics deals with choices and decisions under the conditions of scarcity. Thus the science of economics is the study of how people allocate scarce resources among competing uses to maximise their satisfaction.
Economics is the science of decisions and choices in the world of limited opportunities (Mabry – Ulbrich, 1994). The need to choose is explained by the scarcity of resources - and consequently, of goods -, while the possibility to choose is explained by the existence of alternative uses of these resources.
A common element of decisions made under the conditions of scarcity is the fact, that all choices involve a cost. Choosing one of the options we must give up something else, or each one can only partially be attained – while you are reading this book you are not going for a bike ride. As people want to achieve the best outcome, the greatest enjoyment or highest satisfaction, that is, they expect the maximum benefit from their choices in exchange of sacrificing the other alternatives, understanding the process of decision-making and the costs and sacrifices involved is very important. The benefit of the second best alternative forgone when making the best choice is called opportunity cost. (Mabry – Ulbrich, 1994; Case et al, 2009; Kopányi, 1993; Samuelson-Nordhaus, 1987).
Opportunity cost: The opportunity cost of using a resource is the value of the next best alternative forgone when using the resource for the best option. Thus, as the choosen activity is the best alternative, the opportunity cost is the forgone benefit of the second best alternative.
The science of economics is generally applied to the problems of the economy in its strict sense, such as production, markets, or exchange rates. Economics, therefore, is a social science, dealing with the alternative decisions people or groups of people make in production, distribution, exchange and consumption, as well as with the consequences of these choices. The science of economics studies how societies utilise scarce resources for producing valuable goods, and how they distribute these among various groups of the population (Samuelson – Nordhaus, 2004).
The economy is the complexity of interactions and processes related to the production, distribution, exchange and consumption of material goods and services. The economy closely interacts with the other spheres of society, including politics, culture, or ideology, while it is also separated from those. On the one hand economics provides the material foundations for the other spheres, while they also influence the functioning of the
economy. The sequence of economic activities begins with production and ends with final utilisation, that is, consumption (Farkasné Fekete – Molnár, 2007).
Human needs are satisfied by consuming goods. Goods, therefore, have useful attributes, that make them suitable for satisfying some needs, and the sum of these useful qualities is called utility. Some of the goods suitable for satisfying needs are freely available in nature, and can be used in their natural form (as sunlight, air, wild plants, wild animals), not requiring human labour to produce them. These goods are called free goods. Other goods are produced by human labour and economic activities, these are economic goods. Needs are most often satisfied by economic goods (Farkasné Fekete - Molnár, 2007).
Some goods satisfy individual needs, these are private goods, while others serve the needs of a group of people, or a community, and are called public (or collective) goods.
Therefore private goods are consumed individually, and when someone has consumed one unit of such goods, then noone else can also consume the same unit. Thus the consumers compete for consuming private goods (such as icecream, bread, clothes, etc.). Public goods, on the other hand, are consumed simultaneously by all the members of a community – a country or a village -, they are equally available for every consumer, meaning that either the whole community can consume them, or noone at all (examples of such goods are the public lights system or national defense). Thus noone can be excluded from their consumption (Farkasné Fekete - Molnár, 2007).
Economics focus mainly on the relationships and market mechanisms of producing, distribution and consuming private goods. However, to supply public goods for satisfying the needs of communities or society also requires the use of resources, making the production and distribution of public goods an important economic issue today. Resources freely available (therefore considered free goods) can no longer be neglected either when making economic choices, because due to the harmful effects of human activity on the environment these formerly unlimited resources have also become scarce. The excessive utilisation of natural resources by someone imposes a limitation on the availability of these resources for others, thus worsening their situation, although they are not directly involved in business transactions (this impact is called an external impact, or externality). Modern society experiences the increasing importance of public goods, and negative externalities generated by neglecting environmental and social aspects. Market mechanisms are inefficient in creating and allocating public goods, and in dealing with externalities, so the existence of public goods and externailites may be understood as market failures; the ability of the science of economics has been limited so far in handling these issues (see Chapter 6).
In a wider sense the methodology and logic of economics may be applied to many areas of human behaviour, including the problems of psychology, statistics, politology, management science, and operations research. Many human decisions involve limited resources while looking for the best possible alternative. For such decisions a few basic principles universally hold. Individuals pursue their self-interest, the decision-maker compares and assesses alternatives by his or her taste and value judgement, trying to find the one that leads to the greatest benefit for him/her. Efficiency means that the individuals utilise the available resources so that they can attain the greatest possible benefit, satisfaction, the best alternative among the available options. Decision-making individuals are assumed to choose rationally, that is, they choose the alternative which, according to available information, seems to offer the greatest satisfaction or benefit for them – for instance, when choosing a product to buy, we will choose the cheapest product of the same quality, because the same money would buy more units of it (Mabry – Ulbrich, 1994).
The individual bases the decisions on the logic of marginal analysis. In real life we relatively rarely face decisions of the ‘all-or-nothing’ type, and most of our decisions involve some incremental change: whether to consume a little more of a particular product (to have
another dinner in a restaurant, or go to the movies instead), to produce a little more from something (for instance, the baker may produce a little more of the baguettes than the usual amount), with the purpose of maximising benefit or profit. Marginal analysis compares the costs and benefits arising from an incremental change of production or consumption, to help to make the best choice.
Summing up, throughout this book we assume that the decision-making individual makes choices at the margin about allocating scarce resources among competing uses, considering the opportunity cost of alternatives, engaging in self-interested, rational, profit- maximizing behaviour (Mabry – Ulbrich, 1994).
Economists often base their decisions on simplified models that describe the main components of the decision problem. The first step in setting up a model is to clearly state the problem itself, then the model will be used to describe possible solutions for the problem. The following step is the evaluation and comparison of the various alternatives, with the aim of finding and implementing the best alternative. When building a model several asumptions are made with the aim of focusing the model on the key components of the situation, and neglecting less important factors. The analysis is then focused on these main factors, assuming that all the other factors remain unchanged. This assumption is called ‘ceteris paribus’ (in Latin: assuming all else unchanged).
Decisions made by these models may refer to the short run, which means that time is too short for one or some of the production factors to be changed. This is a limitation for the decision-maker, and the decision alternatives are assessed assuming that these factors of production are fixed. The long run, however, is a time period, which is long enough for any factor of production to be changed, so the decision makers may respond flexibly to economic incentives and take advantage of opportunities. The basic relationships described in models are often represented in graphs, or quantified in formulas, and statistically analysed, or compared to true data of the real world1 (Mabry – Ulbrich, 1994; Case et al, 2009).
1.1.2. Factors of Production
Economists classify scarce productive resources into five groups. Productive resources are: factors of production, including labour, natural resources (as land, or minerals), capital resources, enterpreneurial skills and information (Mabry – Ulbrich, 1994).
Time may also be considered a productive resource, but it is not a resource in itself but a necessity for using other resources, so it will be handled together with them.
1. Natural resources (A – Agricultural Land): Physical resources occurring in nature, that are used in production in their raw, natural form.
2. Labour (L –Labour): The human physical and mental skills used in production.
Human capital is considered an important component of labour. Human capital is the accumulated physical and mental skills acquired by education or experience. While labour, that is, the working capability of individuals, is a natural phenomenon of all human beings, and in this aspect it is similar to natural resources, the skills and knowledge acquired in education or experience are in many aspects similar to real capital.
1 It is assumed here, that readers are familiar with the basics of graphs, graphical representations of functions, and with the following terms: independent variable, dependent variable, positive and negative relationships, the slope of a line or a curve, increasing slope, decreasing slope. These terms are included in elementary mathematics courses taught in secondary schools.
3. Capital (K –das Kapital (in German)): Capital resources are productive resources created by an earlier production process, and utilised in a future production process to generate income. Within capital resources real capital includes all the physical resources produced as machines, tools, buildings. Money is also classified as capital resource, and it is called nominal capital, as a distinction from physical capital. The role of money in the production process is to buy all the other necessary factors of production. needed. Another capital resource is technology: the available knowledge of techniqued and processes of producing goods or services.
4. Enterprise, entrepreneurial skills (E - Enterprise, Entrepreneur): the scarce human ability to organise and operate other resources efficiently to produce desired goods and services. The entrepreneur is an individual who engages in enterprise, organising the utilisation of resources, taking risk, and innovating.
5. Information: Information about production, the economy and the environment are accessed by communication technology and some of them are utilised in the process of decision-making.
1.2. The Basic Economic Questions, the Production Possibility Frontier
1.2.1. The Three Basic Economic Questions
In the history of mankind all societies have had to answer three economic questions (Farkasné Fekete – Molnár, 2007; Mabry – Ulbrich, 1994; Samuelson-Nordhaus, 1987):
• What to produce?
• How to produce?
• Whom to produce for?
1. What to produce, and in what quantity?
Society must decide what to produce, and in what quantity and quality, whether consumer goods (food, clothes, weapons, etc.) or productive goods (machinery, tools, plantations, vehicles, roads, etc.) should be produced. Producing consumer goods increases the well-being of society in the present, while producing productive goods leads to the same result in the future. The individual producer also faces the same decision: what goods to produce considering the available limited productive resources. The produced goods must satisfy some existing – or evolving - demand in the economy, and the economy, or the producer must be able to produce them efficiently, at reasonable costs.
2. How to produce the goods?
The question of ‘how’ refers to the choice of technology, that is, the choice and application of one of the available mixes of resources. In a national economy it must be decided how to employ labour (in agriculture, manufacturing, service, trade, etc.), what materials and energy sources to use (oil, coal, solar power, or metals, plastics, etc.), how to combine them, that is, which technology option to choose (an environmentally damaging one or a less polluting one)? The individual producer can also choose a technology, considering the costs involved and the efficiency of resource utilisation.
3. Whom to produce these goods for?
The question ‘for whom to produce’ refers to the expected consumers of the various goods and services produced. For the economy as a whole the question refers to the distribution of produced goods and generated incomes among the individuals and various groups of society. For the individual entrepreneur or producer the question refers, in a slightly modified way, to the identification of the targeted consumers. The question of ‘for whom to produce’ is closely linked to the question of ‘what to produce’, the answers to them must be harmonised.
1.2.2. The Production Possibility Frontier
As explained, in a world of scarcity, choices must be made about the allocation of resources to possible uses. A baker may bake buns and croissants, but every day he/she must decide how much to produce of each. If all the available resources - e.g. the full capacity of ovens and other equipment needed for baking, all the labour force (number of hours worked), the raw materials (flour, yeast, salt) are used to bake buns, then production is specialised, and the maximum possible amount of buns can be calculated. On the other hand, the baker may decide to use a part of the available resources for producing buns, and the rest for baking croissants. Clearly, allocating a part of the resources to baking croissants, less remains for the production of buns, so the amount of buns produced will decrease. In other words, the decision about the amount of buns to be baked will determine the amount of croissants that can be produced using the resources left. Thus, for any amount of buns (assuming less than the absolute maximum amount) the baker can calculate the amount of croissants produced using all the remaining resources.
This process may be understood not only for two products of one enterprise, but also for two industries of an economy. The left panel of Figure 1.1 shows an expamle. The economy in the figure produces food and machines, using its productive resources at full capacity. The points A-B-C-D-E-F represent the possible amounts of food and machinery that can be produced together. The curve connecting the possible combinations of food and machinery is called Production Possibility Frontier (PPF): a curve showing the combinations of the maximum output of too goods that can be produced by fully using the available resources in an efficient way. Each point of the curve defines a combination of the two goods, and increasing the production of one of them will lead to a decrease in the other.
Such combinations of goods are called Pareto-efficient combinations (Farkasné Fekete – Molnár, 2007). Thus, the Production Possibility Frontier curve in the left panel of Figure 1.1 shows the Pareto-efficient food-machinery combinations. Clearly, increasing the amount of food from 0 tons to the possible maximum amount of 5 million tons, the amount of machinery must decrease; and as the amount of food increases, more and more units of machinery must be sacrificed for producing an additional unit (1 million ton) of food – in other words, the PPF curve is concave.
In the example a 1 million ton increase of food from 0 tons to 1 million tons requires giving up 5 thousand units of machinery (see points A and B). When we already have 3 million tons of food, producing an additional 1 million ton requires sacrificing 23 thousand units of machinery (points D and E, decreasing machinery output from 70 thousand units to 47 thousand units). The same is true when the production of machinery is increased. This means, that the more food we want to produce, the more machinery must be given up for an
additional ton of food. This is the principle of decreasing returns, or increasing relative costs (Farkasné Fekete – Molnár, 2007).
Figure 1.1: The production possibility frontier, and its growth
Source: Author’s own construction, based on Farkasné Fekete – Molnár (2007)
Point G in the left panel of Figure 1.1 lies below the PPF curve. Point G is not Pareto- efficient, because the amount of food can be increased without decreasing the machinery output, and the amount of machinery can also be increased without decreasing the output of food, so in point G some resources are unused. Point H, on the other hand, is unattainable with the current resource limits, because producing the amount of machinery represented by H, food output cannot be higher than in point D.
The right panel of Figure 1.1 shows the change in the production possibility frontier of a country or a national economy. When the production capacity – the amount of productive resources – of the country increases, the attainable output combinations also increase, and formerly unattainable combinations become attainable. Such an increase in the resources may be the increase in the number or skills of the labour force, the introduction of more machines and modern technology in the production processes.
1.2.3. Economic Coordination
Economic coordination is the harmonisation of the activities of economic agents.
Modern economies may be described by three basic types of economic coordination:
spontaneous market coordination, bureaucratic (centralised) coordination, and mixed coordination (Farkasné Fekete - Molnár, 2007).
Spontaneous market coordination is a typical attribute of market economies. In this economic system market actors are independent, equal in their market relationships, noone has significant power over the others. Their basic objective is to maximise their economic gains expressed in money. The organisation and coordination of economic processes is done by the market, no economic agent or organisation has economic power to restrict or control the actions of individuals or firms. The market agents are guided by market prices, these prices inform them and influence their behaviour. Money flows provide the most important information for the individuals’ decisions, through prices, costs, incomes, profit, and loss.
Bureaucratic (centralised) coordination is the attribute of command economies, where the economy is directed by central plans and decisions. Some economic agents are
subordinate to others, the government directs the organisation of the economy by commands and prohibitions. The government will plan the needed amounts of products and services, and then it commands producers to produce these amounts, allocating them the necessary resources. The government also decides about the prices that consumers pay for getting the products and services, and therefore it is also the government’s decision, how much an individual may consume of particular products. The implementation of central decisions are forced by law, the role of the market is negligible. Although theoretically it might be possible for a government to precisely forecast the demand of the economy and society for any particular product, and to plan efficient resource allocation according to this demand, in practice the system does not work, as is clear from the history of Eastern and Central Europe before 1990. The slow and rigid operation of central planning makes command economies not competitive enough among the rapid market changes. Modern economies can only temporarily return to command ruling, in times of natural disasters or wartime.
Contemporary developed economies are mixed economies, characterised by mixed economic coordination. In mixed economies the elements of both market and command economies are present, although the elements of the market play the key role. Government intervention is done mainly in the market, and it is usually aimed at correcting the market anomalies, or at substituting the market, or to prevent the emergence of situations that restrict market competition. Government intervention is usually justified when the market equilibrium leads to an outcome not acceptable for the society. The labour market is a good example, where the government sets a minimum wage that is usually higher than the market equilibrium. The justification for such an intervention is, that the market equilibrium wage is too low to provide a suitable standard of living for workers. Nevertheless, government intervention often fails to provide the optimum outcome expected by the society, as is seen in the relationship between rising minimum wages and unemployment.
1.3. Microeconomics and Macroeconomics
Economics include two great fields: microeconomics and macroeconomics.
Microeconomics is the branch of economics that is concerned with the behaviour of the individual decision-makers at specific markets, the basic entities of the economy; the individual market agents (consumers, households, enterprises) and market laws. It can analyse the price trends of running shoes, the impacts of taxes on petrol prices and petrol consumption, the impact of spring chills on the price of orange juice, and help us decide whether road construction is more efficient by many workers and only a few machines, or many powerful machines and only a few workers (Mabry – Ulbrich, 1994). Adam Smith is considered to be the founder of microeconomics (by his book The Wealth of Nations published in 1776).
On the other hand, macroeconomics is concerned with aggregates, that is, with the sum of transactions in the various markets. Macroeconomics analyses the economy as a whole, including total output (and not output of a particular product), aggregate price level (and not the price trends of one specific product), employment and unemployment in the economy (and not the labour demand of one particular firm, or the labour supply of an individual). The evolution of macroeconomics in its current form is attributed to the book General Theory of Employment, Interest and Money by John Maynard Keynes published in 1936.
In everyday life, as individual decision-makers we may be more involved in microeconomic decisions, while in newspapers and TV programmes dealing with economic policy the topics of macroeconomics are discussed: inflation, recession or growth, budget deficit, unemployment and employment. In our study of economics the fundamentals of both fields will be covered (Mabry – Ulbrich, 1994; Samuelson-Nordhaus, 1987).
But why should we be concerned about aggregates, why to analyse the economy as a whole separately from its parts? Having understood the behaviour of individual decision- makers in microeconomics, should it not be sufficient to simply ‘add up’ the results of microeconomics to explain the processes of the macroeconomy? The ‘fallacy of composition’
shows that the whole is different from the sum of its parts, and if a statement is true for the individual, it is not necessarily true for the sum of all individuals. If a producer slightly raises his/her output for sale (e.g. by 10 %), then the additional product will probably be sold at the same price as all the former units (because the extra output is negligible compared to the total supply in the market), and the producer receives higher revenues. Now if all the producers increase their output for sale by 10 %, this is a considerable increase in the total supply, and assuming unchanged consumer demand, it must be sold at lower prices. This may result in lower revenues for all the producers, even if higher amounts were sold. Although all of them expected a raise in the sales revenues, the result turned out to be the opposite. The individual decision-maker assumed a ‘ceteris paribus’ situation, expecting unchanged supply of the other producers. However, for the whole group of producers – that is, for the macro level – the
‘ceteris paribus’ condition is no longer true, meaning that the laws of microeconomics cannot be simply adapted to macroeconomics.
Besides microeconomics and macroeconomics the science of economics covers several other special areas. International economics deals with the interactions of national economies at macro level (analysing e.g. export, import, capital flows, currency exchange rates). The theory of economic systems - comparative economics - is concerned about national economies of different types, as market economies, command economies, and mixed economies, analysing the specific economic systems of particular countries. The history of economic theories describes the historical evolution of the science of economics, discussing the key features of schools and branches of economic theory.
Besides, several applied sciences are built upon the theoretical results of economics, such as business management, corporate finance, industrial organisations, trade and commerce, agricultural economics, and today new areas, as health economics and education economics have evolved, too. Economics itself relies on the methodologies developed by other sciences, e.g. mathematics, statistics, sociology and psychology. Economists base their theories on statistical data of the past. Econometrics provides important methods and tools for assessing the data and drawing simple, but statistically acceptable and true conclusions.
When analysing economic processes a clear distinction must be made between approaches involving facts and empirical evidence, and those involving value judgements and norms of fairness. The first approach is the realm of positive economics, while the second one is of normative economics. Positive economics intends to analyse properties and processes of the economy free of any value judgements and interests, restricting itself to figures and facts. The standpoint of a positive economist is: ‘this is the present, this will be the future’. Normative economics on the other hand, involves norms of fairness and ethical concepts, too. The normative economist says: ‘this is the present, this should be the future’.
The decision-maker’s choice is influenced by his/her norms and values, too. The issues raised by normative economics may be resolved by social and political debates, and not by economic analysis alone (Samuelson-Nordhaus, 1987).
1.4. The Key Actors of the Economy: Households, Firms, Government The key actors of the economy are economic units, organisations, institutions; these units interact in economic processes with each other, and with institutions that were set up to organise and regulate these interrelationships and processes. The organisational structure of a national economy comprises the following entities: households, firms, and the state (the government).
Households are the people of the country, their main role in the economy is consumption – they purchase and consume most of the goods that the firms produce. The second important role of households is to provide labour for the firms selling their working capacity in the market of productive resources. They spend the wages received in exchange of work on buying the products and services produced by the firms. Households may save a part of their income, and these savings, if deposited in banks, are provided as loans for others.
Households are also owners of a considerable amount of national wealth – in the form of houses, real estate and other durable goods, and they may also produce some goods for home consumption (occassionally selling small amounts, especially agricultural products).
Households are not the same as families, although they have much in common. A family is defined by economics and sociology as a group of people connected by biological relationships, while households are economic units. The household is the economic community of people living together, sharing their incomes, engaging in joint consumption decisions and sharing the cost of their economic activities (Farkasné Fekete – Molnár, 2007).
Firms, business units produce goods – products and services –, with the purpose of selling these goods in the market. For their activities they need productive resources, that they buy in the market of the factors of production. They earn their revenues by selling their output, and they have to pay the costs of productive resources needed for the production process. The difference of their revenues and costs gives their profit. In the rest of this book it is assumed that the key motivation for the firms’ behaviour is the intention to maximise their profits. The business units are characterised by independent decisions, separation from the other actors of the economy, the purpose of profit maximisation, risk taking, and the fact, that they mobilise their resources for attaining profit, and their success is measured by the market (Farkasné Fekete – Molnár, 2007). Usually the term ‘firm’ refers to some form of organisation, while a business unit covers all forms of firms, corporations, sole traders, family farms, who have one thing in common: they produce some goods for sale. In the rest of this book the term ‘firm’ will be used in a general sense for all forms of business units.
Government, and governmental institutions play important roles in modern societies, although their efficiency is constantly debated. The state (the government) is a special agent in contemporary economies, that represents public power actively influencing all economic relationships and processes. The government interventions have three key functions in the economy (Farkasné Fekete – Molnár, 2007; Samuelson-Nordhaus, 1987): to enhance the efficiency of the economy, to maintain macroeconomic stability, and to guarantee social justice, fairness and equity.
Review Questions 1) What does scarcity mean?
2) What is opportunity cost?
3) Describe the decision-making process of an individual as defined by the principles of economics.
4) What does the concept ’ceteris paribus’ mean?
5) Explain ‘short run’ and ‘long run’.
6) List and describe the factors of production.
7) What is the meaning of the production possibility frontier, how does the PPF curve looks like for fixed opportunity costs, for increasing, or decreasing relative costs?
8) What are the three basic economic questions?
9) What is economic coordination, what are the main types, and which one is typical for contemporary developed economies?
10) Describe the topics of microeconomics and macroeconomics.
11) Describe the roles and functions of firms, business entities in the economy.
12) Describe the main role of households in the economy.
13) Describe the role and main functions of the government, and government institutions in the economy.
Problems and Questions to Develop Competence 2
1) A student signed up with an internet provider for a fixed fee of 5000 HUF per month. This fee covers unlimited access to the world-wide web. During an average month last year the student was logged onto the web for 17 hours. What is the average cost of an hour of web time to the student? What is the marginal cost of an additional hour?
2) For each of the following situations identify the full cost of the activity – in terms of opportunity cost.
a. A worker earning an hourly wage of 2500 HUF decides to cut back to part-time work, to attend a college.
b. A student spends the night in a wild party, and stays out all night before his physics exam.
c. Alex’s father has a small grocery shop, and Alex works 40 hours a week here, without receiving wages.
3) A country has fixed quantities of productive resources, and uses these resources for producing two goods: bread and ovens. The following table shows the possible combinations of bread and ovens:
Bread (million kg) Ovens (thousands)
75 0
60 12
45 22
30 30
15 36
0 40
The figures above assume that the country owns a certain amount of ovens produced previously, that are available in the current period for baking bread.
2 Source: Case et al. (2009)
a. Using the figures in the table, graph the production possibility frontier. (Use the horizontal axis for the number of ovens.)
b. What happens to the opportunity cost of baking bread (measured in the number of ovens) if the quantity of bread baked increases?
c. If the country keeps producing both bread and ovens, what happens with the production possibility frontier over time? (Explain your answer!)
d. Now suppose that a new technology is introduced, and then every oven can produce twice as many kg of bread than before. Graph the new production possibility frontier.
e. Suppose that before the introduction of the new technology the country produced 22 ovens. After introducing the new technology the country produces 30 ovens. What is the impact of the new technology on the quantity of bread produced? (Give the amount of bread produced before and after the new technology was introduced.)
Chapter 2: Basic Concepts of the Market
2.1. The Market, Key Factors and Basic Forms
As it was described in the previous chapter, households, that is, people satisfy their many wants by purchasing goods – products and services. These goods are produced by firms, who use the labour of households in the production process. Thus, households will buy the products and services produced by firms, spending the income that they receive from these firms for their labour3.
These transactions take place in the market. The market is the location where the exchange of goods and services, or the sale of productive resources – such as labour – takes place. In the market of consumable goods – e.g. of food, clothes, CD-s – the buyers’ purchase intention, that is, their demand, is focused on the goods that can satisfy some of their wants, and the money that they can afford and want to spend on these goods has an important influence on their behaviour. Of course, they want to spend their income in a way, that provides the greatest level of satisfaction for them, that is, allows the purchase of the largest possible quantity of goods. Firms, however, intend to sell their products or services at the highest possible price, because the sales revenue covers partly the cost of buying productive resources for the next period, and partly their profit. For producers the sales revenue received in exchange of products and services is the source of their income. The relationship between sellers and buyers is established through the market mechanism. Thus, the term ‘market’ can be defined in the following way:
The market is the mechanism where buyers and sellers meet to carry out transactions, therefore the market consists of interactions of sellers and buyers, and its key elements are:
demand, supply, price and income.
It is worth noticing, that two types of markets exist actually: the market of consumer goods serve the households, they are the buyers, and the firms, the producers are the sellers.
The situation is just the opposite in the market of productive resources, in other words, of the factors of production, where the firms, the producers are the buyers, because they need these factors for production, while the households are the sellers, who want to earn income for their labour, or other, privately owned resources. The market of labour, as a productive resource is a good example for the above: the households offer their labour resource, in order to earn income necessary to maintain life. The labour sold by households is purchased by the firms and business organisations, as it is needed for their production process. The wage for which the labour is exchanged is the market price of labour, and it is paid by the firms to the households. This price, at the same time, generates the income for the seller of labour, and becomes a cost for the buyer (the firm), who must pay it from the revenues.
The market of consumer goods is called output market, while the market of productive resources (or, in other words, the market of factors of production) is called input market. The basic market mechanisms are the same in both markets, so these mechanisms will be presented in the example of the output market. The specialities of the input markets will be described in Chapter 5.
The role of the market is to allow buyers and sellers to interact, and the result of their bargaining process will define the price of the goods and the quantity sold. Demand is the buyers’ willingness and ability to purchase the goods, it shows the quantities the
3 Really, labour is not the only resource that households own; they can rent out land, buildings, or lend their savings to firms, companies.
buyers are able and willing to buy at different prices. Supply is the sellers’ willingness and ability to sell, showing the quantities the sellers are able and willing to sell at different prices. The price of the goods expresses the value that the buyers and the sellers attribute to the product, in terms of money. The sellers earn their income, as the difference of the price and the cost of production, while income for the consumers is their capability of purchasing the goods they want, or in other words, it is the consumers’
purchasing power. The money available for the consumer to spend on goods is called nominal income, while the amount of goods (products and services) that can be bought for this money is called real income. Because the price of the product or service is the source of income for the sellers, they try to increase it, by selling the goods at the highest possible price, to maximise their profit (which is the difference of the sales revenue and the costs of production). The buyers, on the other hand, want to buy the goods at the lowest possible price, because they want to use their limited (that, is, scarce) income to buy the largest possible quantities of goods (to satisfy their wants). Thus, buyers and sellers have opposing interests, the first want to attain high prices, the second low ones in the market exchange process. The market processes are shaped by the decisions of rational, self-interested individuals, but in spite of this, the market mechanism shows regular, predictable behaviour, where general laws prevail, that are called market automatisms.
2.2.Demand, Supply, Market Equilibrium and Its Graph, Market-Clearing Price 2.2.1. Demand
As it was explained above, demand describes the buyer’s behaviour in the market.
Demand shows the quantities of a particular good that the buyer is able and willing to buy at various prices (Kopányi,1993).
It is assumed that the buyer’s objective is to spend his/her income in the best possible way, that is, to maximise his/her level of satisfaction. Demand describes the quantity of the goods that the buyer intends to buy, and the buyer not only wants it, but is able to pay for this amount from his/her income. Individual demand is the demand of one individual, one consumer. Market demand of a particular good is the sum of the individual demands of all buyers present in the market.
Demand is determined by the price of the product, but many other factors influence it too. Other determinants are the income available for the consumer, the consumer’s tastes and habits (or preferences), the attributes of the product (its quality, usefulness), the prices of other products related to the demanded product (e.g. the price of substitute goods, that can be used interchangeably to the demanded good, or the price of complementary goods that are consumed together with the demanded good), as well as the consumer’s expectations about the future (e.g. expectations about increasing incomes or price changes). These factors influence both individual and market demand, while market demand is also influenced by the number of buyers present in the market. Table 2.1 summarises the above factors.
Table 2.1: Factors influencing the demand of a given product, beside its price
Factor Impact
The utility (usefulness) of
The key property of a product is its utility: it shows the ability of the product to satisfy some want for the consumer, in better or worse quality, higher or lower level.
the product If the producer improves the quality of a product, or changes its design, size, colour, the demand for the product will usually change. The utility of the product refers mainly to the objective properties of the product.
The consumer’s preferences
The preferences express the consumer’s relationship towards the product, his/her attitude, value judgement, or opinion about the utility of the product. Instead of the objective features of the product, the preferences describe the consumer’s subjective opinion about it. A food may be very healthy, but the consumer may not like it, or may not believe in its wholesomeness, or, just the contrary, the consumer may believe in the value of a product, although no objective proof exists about its usefulness. It is the main aim of advertisements and commercials to change consumer preferences.
The buyer’s income
With higher incomes the consumer is able, and usually willing to purchase larger amounts of the goods. The impact of decreasing incomes is just the opposite4. Income is a limiting factor over consumer demand.
Prices of other products
Consumers usually find many similar goods in the market that can be used as substitutes for each other. Various brands of milk, orange juice, or DVD players can serve nearly the same purpose and satisfy the same wants. The consumer may substitute the preferred product by another similar product, if the latter is sold at a cheaper (discounted) price, and this decreases the demand temporarily, or even permanently for the originally preferred product. Complementary goods, that is, when the product is usually consumed together with other goods, also influence the demand of a product. Cream for coffee is consumed together with coffee, and there is an interrelationship between the demand for cream and coffee. When the price of coffee increases, less coffee is bought, and the demand for cream also decreases.
The consumer’s expectations about the
future
If the buyers believe that the price of the goods they want to buy rise in the near future, then they may buy larger quantities today at the lower price, bringing ahead the purchases planned for the near future, thus the demand increases. If the buyers expect a price decrease in the near future, they may decide to postpone the present purchase, and the demand would decrease. When the consumers expect an increase in their income, they may start to consume more now, so the result is increased demand, but if they expect to lose their jobs, they would start to save their income for the hard times, and decrease their current demand.
Number of buyers
The total market demand is higher when more buyers are present in the market, while with lower number of consumers the demand is also lower. The increase in the number of buyers leads to increasing demand in the market, while decreasing numbers of buyers result in decreasing demand.
Source: Author’s own construction based on Samuelson-Nordhaus (1987).
Individual demand is influenced by many factors. Some of these are objective facts independent of the decision-making individual, others are subjective, closely related to the person. Every buyer forms his/her own opinion about the purchase, and decides about the quantity to buy at the given prices. Some consumers can and want to buy a particular product at very low prices, others will buy it even at high prices. The reservation price is the maximum price an individual buyer is willing to pay for one unit of the product. The
4 This is true for the so-called normal goods. Demand for inferior goods, however, behave in a different way.
When the consumer’s income rises, he/she stops buying these goods, and turns to more expensive goods of better quality; the increasing income leads to decreasing demand for inferior goods. Examples of inferior goods are cheap food, or cheap clothing of poor quality.
reservation price is different for each buyer, and this is the reason why some units of a product may be sold even at high prices, although more buyers can afford it at low prices.
Demand can be described in functional form. The demand function measures the demanded quantity of a product as a function of price, ceteris paribus, assuming that other factors remain constant.
The demand curve is the graphical representation of the demand function, in the coordinate system of price and demanded quantity. The price of the product is denoted by P (Price), the quantity demanded is denoted by Q (Quantity). The letter D denotes demand. The demand curve is downward-sloping, describing a negative relationship between the price and the demanded quantity of the product. With high prices the buyer can buy less of the product, assuming unchanged income, and there are fewer buyers in the market who can purchase the product at high prices (that is, whose reservation prices are higher that the actual price). With lower prices the consumers are able to buy more units of the product, and there are more buyers whose reservation prices are above the actual price.
The law of demand: when the price of a good increases, the quantity demanded will decrease, and when the price decreases, the quantity demanded will increase, ceteris paribus (assuming other things influencing the demand remain constant). A demand function can be constructed for the total market demand as well as for the individual demand. The latter is called individual demand function, and its graphical representation is called individual demand curve5.
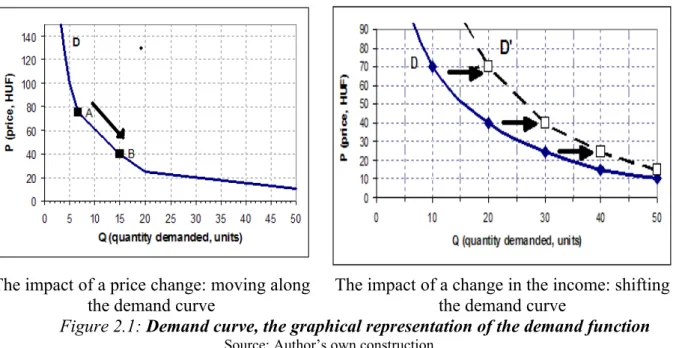
The impact of a price change: moving along the demand curve
The impact of a change in the income: shifting the demand curve
Figure 2.1: Demand curve, the graphical representation of the demand function
Source: Author’s own construction
As the left panel in Figure 2.1 shows, a price change leads to the change of the demanded quantity, at point A a higher price leads to a smaller quantity demanded, while at point B a lower price leads to a higher quantity demanded. Therefore, a change in the price leads to a movement along the demand curve. This is so, if the other determinants of demand remain unchanged. But what happens if some other factor changes? What is the impact of a
5 As it is stated in the definition of the demand curve and the demand function, the demanded quantity (Q) is expressed as the function of the price (P), so price should be the independent variable and quantity the dependent one. Then the price should be shown on the horizontal axis and quantity on the vertical axis. Following Alfred Marshall’s work, the opposite way has become the standard graphical representation, with price on the vertical axis, and quantity on the horizontal one. An explanation may be, that in perfectly competitive markets market agents decide about quantities, and the actual market price will evolve as the equilibrium of the demand and supply schedules.
change in the consumers’ income on the demand schedule? With this change the initial conditions assumed for the original demand function are no longer valid, the demand function itself will have to change, a new demand function will be defined.
The right panel of Figure 2.1 illustrates the change in the demand function itself, as a result of changing incomes. Suppose that the consumer’s income has increased. Then he/she can afford to spend more, and buy more of the product than before, at any price. Then at any price the quantity demanded is higher than before, so the demand curve shifts upwards, to the right, so instead of curve D the new demand curve becomes D’.
It is easy to see that the situation is the same when the consumer’s preferences change in favour of the product, or when the consumer expects a price rise in the future, or when the number of consumers increase. Naturally, a decrease in the consumer income, or a negative change in the consumer’s preferences, or a decrease in the number of consumers will lead to the opposite result, and the demand curve will shift downward to the left.
Summing up, the impact of price change, assuming no change in all the other factors, is a movement along the demand curve, while the impact of any other change is a shift of the demand curve itself.
Economic analyses often use linear demand functions. A linear demand function describes the relationship of price and quantity as: Q = a - b P, where Q and P are the demanded quantity and the price of the product, respectively, b shows the decrease in quantity at a unit price rise, and a shows the quantity demanded at P=0. The inverse demand function gives the price P as a function of the quantity demanded. With a linear demand function the inverse demand function is also linear. It is easy to see that for the above demand function the inverse demand function can be written as: P = (a/b) – (1/b) Q.
Q (units) P (HUF)
0 45
1000 40
2000 35
3000 30
4000 25
5000 20
6000 15
7000 10
8000 5
9000 0
Q = 9000 - 200 P
0 5 10 15 20 25 30 35 40 45 50
0 2000 4000 6000 8000 10000 Q
P
Figure 2.2: Example of a linear demand function
Source: Author’s own construction
In Figure 2.2 the equation for the linear demand function is Q = 9000 – 200 P and the inverse demand function can be written as P = 45 – 0,005 Q. The table shows that a price increase of 5 HUF decreases the demand by 1000 units, so a price rise of 1 HUF leads to a 200 unit decrease in the demand.
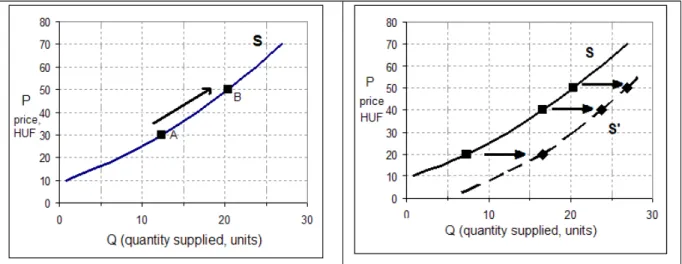
2.2.2. Supply
The supply of a commodity shows how much of this commodity the seller is able and willing to offer for sale at various prices (Kopányi, 1993).