University of Szeged Faculty of Science and Informatics
Doctoral School of Geosciences
Department of Physical Geography and Geoinformatics
PRIMARY AND SECONDARY SCHOOL STUDENTS’
GEOGRAPHICAL MISCONCEPTIONS
Theses of the doctoral (PhD) dissertation of
Anett K•d•r
Thesis supervisor Dr. Andrea Farsang DSc
Associate professor
Szeged 2019
INTRODUCTION AND AIMS
A deeper understanding of geographical misconceptions provides us, teachers, a new insight into the development of geographical knowledge, helps us to create a more student-centred point of view on instruction, thus contributes to improving the quality of our students' geographical knowledge. While the number of international research related to geographical misconceptions is growing rapidly, Hungarian geographical misconception research is lagging behind other natural science subjects. At the same time, the results of Hungarian and foreign research confirm that it is our responsibility, as teachers, to reveal the preliminary knowledge and misconceptions of our students, so that we can choose the best possible methods to address misconceptions, and help students to form proper, relevant, and useful geographical knowledge. It includes being able to differentiate between the contents of the curriculum, giving special focus on the parts that are more difficult to understand, and choosing teaching methods and materials that facilitate our students' understanding of different geographical phenomena.
The study of misconceptions is most closely connected with the research of conceptual change, which refers to different models of knowledge acquisition. Conceptual change, which can happen spontaneously and or be induced by education, is characterized by quantitative and qualitative changes alike. When the main nodes of a student's conceptual system remain the same, but the amount of the relating information grows, we speak of quantitative change. Qualitative change refers to the change of the main nodes of the conceptual system, which leads to the overall transformation of the students' theoretical framework.
The development of a correct conceptual system is the result of a meaningful learning process in which students obtain transferable knowledge that can be used in their everyday life, in their future work, or even in other professional or scientific fields.
A misconception refers to an incorrect concept that is permanently and deeply embedded in the conceptual system of children or adults, is incompatible with currently accepted scientific views, and is often resistant to teaching (Korom, 2002). If conceptual change does not happen, misconceptions may persist, or even intensify, and, therefore, they become a real problem because later on they can hinder meaningful learning and the development of proper critical thinking. In the framework of my research, I distinguished five major, specific groups of misconceptions: 1) vernacular misconceptions, 2) preconceptions, 3) cultural misconceptions, 4) popular misconceptions, and 5) conceptual misunderstandings or conceptual
misconceptions.
My doctoral research was based on a cross-sectional analysis of the misconceptions of two geographical themes: 1) climate and climate change, and 2) the internal structure of the Earth and its characteristic processes. The basic reason for selecting these two topics was the significant results of their relating international studies. Thus the results of a similar research in Hungary would provide an excellent opportunity for the comparison and evaluation of geographical misconceptions, and, in addition, it could serve as a pioneer of Hungarian geographical misconception research.
The aims of my doctoral research were as follows:
1. A presentation of the misconceptions related to the two selected themes of my dissertation as identified by international research.
2. In the absence of standardised and widely accepted methodological recommendations, the elaboration of the general, methodological guidelines for a measuring instrument that can help to identify students' misconceptions, and provides data that are also suitable for further qualitative and quantitative analyses.
3. The identification and cross-sectional analysis of geographical misconceptions relating to climate and climate change, and the internal structure of the Earth and its characteristic processes among Hungarian students.
4. The comparison of the found misconceptions with those identified by international literature.
5. An analysis of the relationship between misconceptions, curriculum content, and age-specific characteristics in order to determine if the quality and quantity of the geographical content of the curriculum are harmonised with the students' cognitive development, and at what age misconceptions are likely to disappear or solidify.
6. The analysis of the distribution of misconceptions by using the following variables: gender, Geography marks, attitude toward Geography, importance of the topic, participation in specialised Geography colasses in senior high school (11thgrade).
7. An analysis of the relationship between geographical content knowledge and the distribution of misconceptions with the help of an assessment test.
8. The exploration of the relationship between misconceptions and the sources of geographical information.
METHODS Sampling
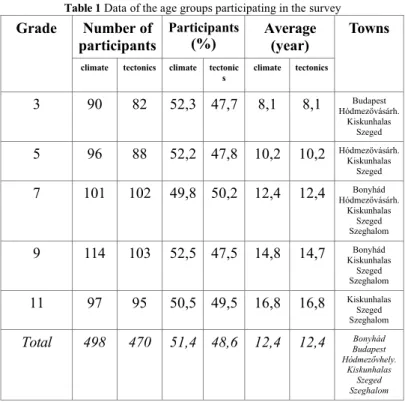
Data were collected from 968 primary and secondary school students in six primary and five secondary schools, altogether in 6 Hungarian towns (Bonyh€d, Budapest, H•dmezőv€s€rhely, Kiskunhalas, Szeged, Szeghalom). The sample was purposive in that goal to identify the geographical misconceptions of five different age groups (Table 1), and to compare the found misconceptions on the basis of similar principles.
Table 1Data of the age groups participating in the survey
Number of participants
Participants (%)
Average (year) Grade
climate tectonics climate tectonic s
climate tectonics
Towns
3 90 82 52,3 47,7 8,1 8,1 H•dmezőv€s€rh.Budapest
Kiskunhalas Szeged
5 96 88 52,2 47,8 10,2 10,2 H€dmezőv‚s‚rh.
Kiskunhalas Szeged
7 101 102 49,8 50,2 12,4 12,4 H•dmezőv€s€rh. Bonyh€d
Kiskunhalas Szeged Szeghalom
9 114 103 52,5 47,5 14,8 14,7 Kiskunhalas Bonyh€d
Szeged Szeghalom
11 97 95 50,5 49,5 16,8 16,8 Kiskunhalas
Szeged Szeghalom
Total 498 470 51,4 48,6 12,4 12,4 Bonyh€d Budapest
H•dmezővhely.
Kiskunhalas Szeged Szeghalom
The number of students per age group was similar to each other, and there was no difference between the ratio of the genders in any of the age groups. In schools where I was unable to personally participate in having the questionnaires filled in, the contact teacher was provided with a detailed guide on the completion of the survey.
The survey
My research was designed as a cross-sectional study that made it possible to compare different age groups according to the same criteria.
Based on the literature data I had reviewed, I developed a combined questionnaire method that allowed both qualitative and quantitative evaluation after data collection. The final diagnostic tool was developed based on the results of the 2011-2012 pilot survey. The survey consisted of three parts, supplemented with an assessment test in 9thand 11thgrades.
To ensure the validity of the survey, I used methods triangulation.
The identification of misconceptions was done by using different but interconnected tasks, including a word-association test and open-ended questions, the latter of which was supplemented with drawing tasks.
Comparing the associations, the answers, and the drawings provided a more precise and surer way of misconception identification. Each of the age groups had to fill in a background information questionnaire too. The assessment test of the oldest age groups (ninth and eleventh graders) was a true-false alternative choice test prepared on the basis of the misconceptions identified by international studies.
The word association test contained six-six stimulus words which were as follows: global warming, greenhouse effect, solar radiation, ozone layer, carbon dioxide, polar and inland ice sheets for the topic of climate and climate change; the internal structure of the Earth, mountain formation, tectonic plate, volcano, earthquake, and plate tectonics for the topic of the internal structure of the Earth and its characteristic processes.
The students were asked to answer six-six open-ended questions, some of which were also supplemented by drawing tasks. The questions of the climate and climate change topic were as follows:
1. Why is it warmer in the daytime than at night?
2. Why is it warmer in summer than in winter?
3. Who feels warmer on an average early summer day in Hungary: the person in picture A or the person in picture B? Why? (With illustration)
4. Who feels colder at an average early summer night in Hungary: the person in picture A or the person in picture B? Why? (With illustration
5. Draw and explain how the Sun warms the Earth.
6. We can hear a lot of news about the rapid melting of the polar ice sheets as well as inland glaciers. What causes these phenomena and what effects can be expected?
The questions of the internal structure of the Earth and its characteristic processes topic were as follows:
1. What causes earthquakes?
2. In Jules Verne' novel Journey to the Centre of the Earth, the characters reach the centre of the Earth through a volcanic pipe. Is it possible? Why?
3. Draw and explain how a volcanic eruption takes place.
4. Why are the west coast of Africa and the east coast of South America similar to each other? (Illustrated with a sketch map)
5. Draw and explain mountain formation.
6. If we could travel to the centre of the Earth with a special lift, what would we see during our journey? Draw and explain.
The background information questionnaire focused on collecting the following data: male/female ratio, age, attitude towards Geography, importance of the research topic, Geography mark received at end of the last semester or academic year, ranking of information sources.
The assessment test of 9th and 11th graders included 15 misconceptions about the respective themess and their scientifically correct pair in random order. The students were asked to indicate the correct statements.
Methods of data evaluation
In order to ensure further corroboration of the results, I also used a variety of methods to evaluate the data.
The following methods were used to analyse the word associations: 1) content analysis; 2) the Garskof-Houston relationship coefficient (RC = relatedness coefficient) of the associations; the frequency distribution of the associations by creating word clouds.
During the content analysis of each age group's word associations, I identified those associations which might have referred to misconceptions, and ranked them according to their frequency. I compared this ranking with the misconceptions found in the students' answers to the open-ended questions to determine if they really referred to misconceptions. I used IBM-SPSS Statistics (version 22) and OpenOffice 3.0.0 to process the data.
By calculating the Garskof-Houston relationship coefficient (RC), I determined the strength of the relationship between the stimulus words and their common associations. I calculated the relationship coefficients separately for each participant and every possible stimulus word pairs. Then
I calculated the average RC of the whole group for each stimulus word pair.
I represented the group-level RCs by preparing graphs that illustrate the strength between the stimulus words and their common associations as well as their age-related changes. I used OpenOffice 3.0.0 to create the graphs.
I visualized the word associations by employing Wordle, which is an online Java application (Java 2D Api). This software converts the associations into word clouds on the basis of frequency distribution. The more frequent a word or phrase is, the larger its font size becomes. The method ensured a visible depiction of the students’ conceptual network at the time of the survey.
I categorised the answers to the open-ended questions by using a method developed by Abraham and his colleagues (1992) (Table 2).
Table 2The comprehension level categories of the answers given to the open-ended questions (based on Abraham et al., 1992)
Level of comprehension Scoring criteria Score
No answer Blank space.
“I don’t know.”
“I don’t understand.”
0
No comprehension Repeating the question.
Irrelevant answer.
Experience-based answer.
1
Misconception The answer is illogical and contains and scientifically incorrect.
2
Partial comprehension with misconception
The answer indicates partial comprehension, but it also contains misconception(s).
3
Partial comprehension The answer includes at least one item of the correct answer but not all of them.
4
Full comprehension The answer includes all items of the correct items.
5
I determined the specific nature of misconceptions during the content analysis, and then I compared the misconceptions of the different age groups. The detailed content analysis of the responses also aimed at supporting my theory that some scientifically incorrect word associations might be misconceptions.
In the statistical analyses, 2- and 3-score responses were treated as one variable. In order to compare the misconceptions of the two themes, I compared the average number of misconceptions per student by using t-tests
and Oneway ANOVA to determine whether there was a significant difference between the examined age groups in terms of the misconceptions of the two topics. Differences between age groups were analyzed in detail with Post Hoc Tests.
The assessment test of 9thand 11thgraders consisted of thirty true- false items. The participants were divided into 5 groups based on the test scores they had achieved. I applied Oneway ANOVA, Post Hoc Tests, and t- tests to determine if there is a relationship between the test results and the average distribution of misconceptions per student by age group and topic.
The differences between the data collected by the background information questionnaire (gender, age, subject marks, attitude toward Geography, importance of the topic, participation in special Geography classes in 11thgrade, sources of information) and misconceptions were also determined by using IBM SPSS Statistics. I analysed each background variable separately in relation to the average distribution of misconceptions per student. In order to perform the analyses, I applied Chi-Square Tests, Crosstabs, Oneway ANOVA, and t-tests.
RESULTS AND THESES
1. By using the combined questionnaire method based on methods triangulation, the resulting answers provided corroborative data, the geographical misconceptions of the students could be identified well, and they also proved to be suitable for comparing the answers of the different age groups based on the same criteria.
i. The applied methods triangulation provided corroborative results. The word-association test and the open-ended questions combined with drawing tasks complemented each other very well. Some of the misconceptions identified in the answers to the open-ended questions had already surfaced in the word associations. Thus the word association method is suitable for preliminary, diagnostic assessment. Student drawings and the relating explanations also supported the existence of certain misconceptions.
ii. Methods triangulation made it possible to compare the characteristic misconceptions of the different age groups based on the same principles.
iii. Some of the methods used in the data evaluation, such as the content analysis of word associations, word clouds, and drawings, can be used in schools to identify misconceptions as well; they are very informative for further classroom work.
2. I found that by analysing word associations with different methods, the quantitative and qualitative changes in the conceptual system of the age groups can be monitored well, and the possible misconceptions of students can also be predicted.
i. Age-specific changes were characterised by the quantitative enrichment of the word associations. Concerning both themes, climate and climate change, and the internal structure of the earth and its characteristic processes, 3rd and 5thgraders wrote significantly less word associations than the older age groups.
In the climate and climate change topic, 7th graders wrote the highest number of word associations, which is a significant result compared to the two younger grades. As for the internal structure of the Earth and its characteristic processes, 9th graders wrote most word associations, even more than 7th
graders.
ii. The qualitative changes of the word associations can also be observed well: the older students are, the more extensive and scientifically correct their geographical vocabulary becomes.
iii. The detailed content analysis of the word associations provided a comprehensive picture of the areas where misconceptions could be expected.
iv. The word clouds visualised the students' conceptual system at the time of the survey. Concepts identified as misconceptions appeared less frequently in dominant font sizes in the word clouds. It indicates that the students' geographical knowledge was generally correct.
v. The graphs, created on the basis on the values of the Garskof- Houston relationship coefficients, depicted the strength of the relationship between the main nodes of each age group's conceptual system, and its the age-specific development. The graphs showed a gradual strengthening of the relationship between the stimulus words, indicating a gradual consolidation of the geographical knowledge at group level.
vi. The in-depth analysis of the responses to open-ended questions confirmed that some associations had already surfaced in the associations too.
3. I identified the most common misconceptions of climate and climate change, and the internal structure of the Earth and its characteristic processes.
i. I found that the misconceptions of the two topics are in line with the misconceptions identified by international research.
ii. The most common misconceptions about climate and climate change are as follows:
▪ due to ozone layer depletion and/or the "ozone hole", greenhouse effect, and thus global warming are intensifying;
▪ the ozone layer is responsible for global climate change;
▪ greenhouse effect is caused by pollutants which form a well-separable layer in the atmosphere;
▪ greenhouse effect is caused by carbon dioxide which forms a well-separable layer in the atmosphere;
▪ the Sun is orbits the Earth;
▪ it is colder at night when the sky is cloudy, because the
Moon cannot warm the Earth;
▪ the Earth is nearer the Sun when it is summer in the Northern Hemisphere, that is why summers are warmer.
iii. The most common misconceptions about the internal structure of the Earth and its characteristic processes are as follows:
▪ confusing the concepts of “lava” and “magma“;
▪ the internal structure of the Earth consists of horizontal layers;
▪ the Earth’s core is composed of either lava or magma;
▪ volcanoes are directly connected with the Earth’s core;
▪ the Earth’s core causes volcanic eruptions;
▪ continents drift instead of tectonic plates;
▪ mountains are formed by a process called “upfolding” (a vernacular misconception);
▪ confusing geologic times scale and relating major events.
4. By categorising the identified misconceptions into the appropriate specific misconception group, I found that the misconceptions of the different age groups are distinctive in nature, even if the formulated answers refer to the same misconception.
i. The responses of the students indicated that their knowledge was dominated by concepts learnt at school. The formation of preconceptions at a younger age is a natural process during conceptual development, but if preconceptions remain intact and do not change into a scientifically correct concept, they become conceptual misconceptions at older age, and it indicates a failure of conceptual change.
ii. Concerning the misconceptions of both topics, the misconceptions of 3rdand 5thgraders were primarily identified as preconceptions, because they were taught about the studied geographic processes in detail later, in Grades 7 and 9, in the course of school education. Therefore, the nature of the misconceptions changed significantly only later, from Grade 7 onwards, as a result of school instruction reflecting curriculum content, and became conceptual misconceptions.
iii. The ratio of vernacular misconceptions ("upfolding") was significantly higher in the topic of the internal structure of the Earth and its characteristic processes than the ones relating to climate and climate change.
iv. None of the topics were characterised by the high proportion
of popular and cultural misconceptions, they only occurred occasionally and usually isolated.
5. There was a significant difference (F(4)=4.728, p=0.001) between the age groups in relation to the theme of climate and climate change in terms of the average number of misconceptions per student.
i. The average distribution of misconceptions per student was the highest among 5th graders; the difference was statistically significant compared to the results of 3rdand 9thgraders.
ii. The average distribution of misconceptions per student was the lowest among 9th graders; the difference was statistically significant compared to the results of 3rd graders. The vast majority of the answers of 3rd grade students were based on their everyday experiences.
iii. The percentage distribution of misconceptions compared to all answers varies between 15.1% (9th graders) and 23% (5th graders). Concerning Grades 3 and 5, the proportion of misconceptions is still slightly higher than that of those answers which indicate partial and full comprehension. Also, the proportions of responses based on everyday experience are extremely high in these two age groups. From Grade 7 onwards, the proportion of misconceptions decreases and the proportions of partial and full comprehension begin to increase. 9th graders demonstrate the highest level of comprehension (both partial and total) and the lowest percentage proportion of misconceptions, while the level of 11th grade students' comprehension is slightly lower than that of 9thgraders.
6. There was a significant difference (F(4)=9.411, p=0.000) between the age groups in relation to the topic of the internal structure of the Earth and its characteristic processes in terms of the average number of misconceptions per student.
i. The average distribution of misconceptions per student was the lowest among 9th grade students; the difference was statistically significant compared to the results of each age groups.
ii. The average distribution of misconceptions per student was the highest among 5th graders; the difference was statistically significant compared to all age groups but 7th graders.
Concerning the average distribution of misconceptions per student, only 3rd graders had fewer misconceptions than 9th graders, which is due to the fact that 3rd graders usually scored 0 for their answers, i.e. they did not give answer the open- ended questions in most of the cases.
iii. The percentage distribution of misconceptions compared to all answers varies between 151.7% (Grade 9 students) and 28.5%
(Grade 5 students). Similarly to the topic of climate and climate change, the lowest proportion of misconceptions characterises 9th graders, while the highest proportion of misconceptions characterises 5thgraders.
7. I found that the occurrence of geographical misconceptions is independent of the two themes researched; their development is influenced by the joint interaction of the age-specific cognitive development of the students and grade-specific curriculum content.
i. Misconceptions occurred in relation to both topics irrespective of the fact whether the geographical phenomena examined (such as the difference between daytime and night time temperatures) could be experienced more directly or not, and their overall proportion, concerning both topics and each age group, did not fall below 10% even among 11thgrade students.
ii. The average number of misconceptions per student was the highest among 5th graders, and it was the lowest among 9th graders. However, the distribution was independent of the topics with the exception of 5th grade students' answers in relation to the topic of the inner structure of the Earth and its characteristic processes, where there was a statistically significant difference relating to the average number of misconceptions per student (t(153.402)=-1.994, p=0.048). This result indicates the validity of the statement found in international literature that misconceptions can develop at any age independently of the topic, and even teaching cannot necessarily change them.
iii. If the instruction of certain geographical phenomena (e.g.
some astronomical phenomena, plate tectonic processes, greenhouse effect, ozone layer) takes place before the cognitive development of a given age group allows full comprehension, i.e. before the age of 10-12 years (Grades 5 and 6), misconceptions are more likely to develop. It is also
proved by the fact that certain misconceptions are still persistent among 11th graders, and their proportion is high.
Before the age of 10-12, neither students' attention, nor their learning strategies and problem-solving skills are generally not as developed as those of older students. As a result, if a particular concept is wrongly incorporated into the conceptual system of learners at a younger age because they are not able to understand it properly, and a false image of the concept solidifies in their knowledge system, then conceptual change does not happen, and the misconception may persist for a long time in the students' conceptual system.
8. Almost every student had misconceptions independently of gender, and the occurrence of misconceptions was not influenced either by school grade or participation in special Geography classes. Although, based on the results of 9th and 11th graders' assessment tests, I concluded that the more secure, accurate, and of better quality a student's knowledge was, the fewer misconceptions they had, but only if the learning and instruction of more complex geographical phenomena took place at the right time, which is determined by age specific characteristics.
i. There was no significant difference between males and females with regard to the average distribution of misconceptions per student, and it did not change with age either. The results were in line with the results of international and Hungarian research.
ii. Analysing the results of both topics, I found a significant difference between the Geography marks received at the end of the previous school year and the average distribution of misconceptions per student. It meant that students with a better mark in Geography had significantly more misconceptions in general than students with poorer marks. The explanation for the seeming contradiction is that school marks evaluate students' overall geographical knowledge (and the evaluation criteria are heavily school- and teacher-dependent), not only for the two themes studied.
iii. The better 9th and 11th graders performed on the assessment test, the fewer misconceptions they had in general, but the difference was not significant.
iv. There was no significant difference between the average
distribution of misconceptions per student and the variable stating whether an 11th grader attended special Geography classes or not.
9. The development of misconceptions is influenced by personal attitudes toward Geography, but my research did not reveal how these attitudes are related to misconception formation.
i. I found significant differences between the average distribution of misconceptions per student and the variables stating whether a student likes Geography, or they consider the any of the research themes important. The more a student liked Geography, and the more important one considered any of the themes, the more misconceptions they had in general.
This seeming contradiction indicates that personal attitudes influence the formation of misconceptions, but its mechanism is not revealed by my research.
10. I found that the formation of misconceptions depends on the sources of geographical information, but not significantly, and misconception formation is influenced by the interaction of information sources, age-specific cognitive abilities, and grade- specific curriculum content.
i. There was no significant difference between the sources of geographical information and the average distribution of misconceptions per student in any of the age groups. I found the only significant difference between the teacher’s explanation variable and the average distribution of misconceptions per student (F(5)=2, 299, p=0,044) concerning all participants of the climate and climate change theme.
According to this result, the more important students ranked the teacher’s explanation concerning climate and climate change, the fewer misconceptions they had in general.
ii. Although research participants ranked the formal sources of geographical information more important, it does not necessarily mean that school instruction resulted in the formation of fewer misconceptions in the conceptual system of the students.
In the framework of my doctoral research I employed both qualitative and quantitative educational research methods, and the acquired data allowed a detailed evaluation of my results. I came to the conclusion
that misconceptions should not be identified only as a problem, but as an opportunity to help students develop a correct conceptual system in the course of learning and instruction. The development of a correct conceptual system is the result of active and meaningful learning and instruction, which allow students to obtain transferable knowledge that can be used in their everyday life, in their future work, and in other professional or scientific fields. However, if conceptual change does not happen, misconceptions may persist, or even intensify, and then they become a real problem, as they may later hinder meaningful learning and the development of proper critical thinking.
REFERENCES
Abraham M. R., Grzybowski E. B., Renner J. W. and Marek E. A. (1992):
Understandings and misunderstandings of eighth graders of five chemistry concepts found in textbooks. Journal of Research in Science Teaching, 29/2.
pp. 105-120.
Korom E. (2002): Az iskolai tud€s †s a h†tk‡znapi tapasztalat ellentmond€sai: term†szettudom€nyos t†vk†pzetek. In: Csap• Benő (szerk.):
Az iskolai tud€s. Budapest, Osiris Kiad•, pp. 139-167.
PUBLICATIONS RELATING TO THE DOCTORAL DISSERTATION
Articles in academic journals
K•d•r A., Farsang A., Guly€s ˆ. (2018): ˆltal€nos †s k‡z†piskol€s di€kok
†ghajlati folyamatokhoz kapcsol•d• t†vk†pzeteinek ‡sszehasonl‰t•
elemz†se. Fƒldrajzi Kƒzlem„nyek, 142:3. pp. 219-234.
K•d•r A., Farsang A. (2018): A l€va a F‡ld magj€b•l sz€rmazik, vagy m†gsem? N†h€ny lemeztektonik€hoz kapcsol•d• t†vk†pzet ‡sszehasonl‰t•
elemz†se. GeoMetodika, 2:1. pp. 5-24.
K•d•r A., Farsang A. (2017): Comparing the Plate-tectonics-related Misconceptions of High School Students and University Undergraduates.
Review of International Geographical Education Online, 7:1. pp. 24-47. IF:
0,55 (2017)
K•d•r A., Farsang A., ˆbrah€m E. (2015): Tudom€nyos-fantasztikus filmek hat€sa a tanul•k f‡ldrajzi ismeretrendszer†re. Fƒldrajzi Kƒzlem„nyek, 139:4. pp. 302-317.
Dud€s E., Farsang A., K•d•r A.(2012): M†gis forog a F‡ld? T†vk†pzetek a f‡ldrajzban: Szakirodalmi kitekintő. A Fƒldrajz Tan…t€sa – M•dszertani Foly•irat, 20:3. pp. 8-20.
Other publications relating to the doctoral dissertation
K•d•r A., Gubler M., Bal€zs B. †s Farsang A. (2018): Az †ghajlatv€ltoz€s helyi k‡vetkezm†nyeinek oktat€sa magyar †s sv€jci p†ld€k alapj€n. In:
Fazekas I., Kiss E. †s L€z€r I. (szerk.): IX. Magyar Fƒldrajzi Konferencia előad€sainak ƒsszefoglal•i. Debrecen, Magyarorsz€g: MTA DTB F‡ldtudom€nyi Szakbizotts€g (2018). p. 35.
K•d•r A. †s Farsang A. (2018): ˆltal€nos †s k‡z†piskol€s di€kok lemeztektonik€val †s †ghajlatv€ltoz€ssal kapcsolatos t†vk†pzeteinek
‡sszehasonl‰t• vizsg€lata. In: Fazekas I., Kiss E. †s L€z€r I. (szerk.): IX.
Magyar Fƒldrajzi Konferencia előad€sainak ƒsszefoglal•i. Debrecen, Magyarorsz€g: MTA DTB F‡ldtudom€nyi Szakbizotts€g (2018). p. 32.
K•d•r A. †s Farsang A. (2018): How do Hungarian Students perceive our climate? A comparative analysis of climate-related misconceptions.
Geophysical Research Abstracts 20, EGU2018-18823-2. p. 1.
K•d•r A. †s Farsang A. (2016): ˆltal€nos †s k‡z†piskol€s di€kok f‡ldrajzi t†vk†pzeteinek ‡sszehasonl‰t• vizsg€lata. In: Pajt•kn† Tari I. (szerk.):
Magyar Fƒldrajzi Napok 2016: Absztraktkƒtet (VIII. Magyar F‡ldrajzi Konferencia, XVI. Geogr€fus Doktoranduszok Orsz€gos Konferenci€ja, Oktat€sm•dszertani †s F‡ldrajztan€ri Konferencia). Budapest: Magyar F‡ldrajzi T€rsas€g. pp. 153-154.
K•d•r A. †s Farsang A. (2015): Comparing the geographical misconceptions of high school students and university undergraduates. In:
Hungarian Geographical Society (szerk.): EUGEO Budapest 2015:
congress programme and abstracts. Budapest, Magyar F‡ldrajzi T€rsas€g.
p. 263.
K•d•r A. †s Farsang A. (2014): Egyetemi hallgat•k f‡ldrajzzal kapcsolatos t†vk†pzeteinek ‡sszehasonl‰t• elemz†se. In: K•r•di T., Sansumn† Moln€r J., Sisk€n† Szilasi B. †s Dobos E. (szerk.): VII. Magyar Fƒldrajzi Konferencia kiadv€nya. Miskolc, ME F‡ldrajz-Geoinformatika Int†zet. p.
799.
K•d•r A. (2013): Mapping geographical misconceptions: A comparative analysis. In: JURE 2013 Programme Book: Responsible Teaching and Sustainable Learning. MŠnchen, Technische Universit‹t MŠnchen, N†metorsz€g. p. 74.
K•d•r A. †s Farsang A. (2012): ˆltal€nos †s k‡z†piskol€s tanul•k f‡ldrajz tant€rgyhoz k‡thető t†vk†pzetei. In: Blanka V. (szerk.): Kock€zat – Konfliktus – Kih…v€s: A VI. Magyar Fƒldrajzi Konferencia, a MERIEXWA nyit•konferencia „s a Geogr€fus Doktoranduszok Orsz€gos Konferenci€j€nak absztrakt kƒtete. Szeged, SZTE TTIK Term†szeti F‡ldrajzi †s Geoinformatikai Tansz†k. p. 255.
K•d•r A.†s Farsang A. (2012): ˆltal€nos †s k‡z†piskol€s tanul•k f‡ldrajz tant€rgyhoz k‡thető t†vk†pzetei. In: Ny€ri D. (szerk.): Kock€zat – Konfliktus – Kih…v€s: A VI. Magyar Fƒldrajzi Konferencia, a MERIEXWA nyit•konferencia „s a Geogr€fus Doktoranduszok Orsz€gos Konferenci€j€nak Tanulm€nykƒtete. Szeged, SZTE TTIK Term†szeti F‡ldrajzi †s Geoinformatikai Tansz†k. pp. 339-353.
K•d•r A. (2012): Mapping Geographical Misconceptions among Hungarian Schoolchildren. In: JURE 2012 Programme Book: A Learning Odyssey: Exploring New Horizons in Learning and Instruction.
Regensburg, Universit‹t Regensburg, N†metorsz€g. pp. 75-76.
MTMT ID: 10029431