Eva Berde1 – Muyassar Kurbanova2
Üzbegisztán demográfiai osztaléka.
Mit tanulhatunk Dél-Korea példájából?
The demographic dividend in Uzbekistan.
What should we learn from the South Korean case?
3Üzbegisztán válaszút előtt áll mind az ország gazdasági, műszaki, mind demográfiai fejlődése vonatkozásában. Még érezhető az első demográfiai osztalék fejlődést elősegítő hatása, de már látszik, hogy ezek az előnyök hamarosan kimerülnek. Új fizikai és humán tőkeberuházások szükségesek ahhoz, hogy folytatódjon a gazdasági növekedés, és emelkedjen az ország polgárainak életszínvonala. A legfontosabb kérdés az, hogy Üzbegisztán hogyan tudja hasznosítani az első demográfiai osztalékból származó előnyöket. Ahhoz, hogy előre becsülhessük a jövőben elképzelhető gazdasági pályákat, Üzbegisztán fejlődését a Koreai Köztársaság fejlődésével hasonlítottuk össze. A Koreai Köztársaság és Üzbegisztán sok szempontból hasonló múlttal rendelkeznek, és kultúrájuk is számos rokon vonást tartalmaz. Mindkét ország rendkívül szegény volt, de Korea ma már a Föld leggazdagabb országai közé verekedte fel magát. Korea példája megmutatja, hogy a jól megtervezett és megfelelően végrehajtott demográfiai és gazdasági intézkedések nagyon felerősítik a gazdasági növekedést az első demográfiai osztalék érvényesülése idején. Az első demográfiai osztalék biztosította lehetőségeket hibakorrekciós modellünk is igazolja.
Ezzel a modellel az egy főre jutó GDP és több gazdasági és demográfiai változó közti hosszú és rövid távú kapcsolatokat vizsgáljuk, mind Korea, mind Üzbegisztán vonatkozásában
Uzbekistan is currently on a crossroads in terms of economic, demographic and technological progress. The positive economic effects of the first demographic dividend can still be felt, however, it is already visible that this advantage will soon disappear. Investment for economic stimulation and human capital can establish further economic growth and welfare. The main questions are if and how Uzbekistan’s economy can use this opportunity.
To predict the future economic path taken by Uzbekistan, it might be beneficial to compare critical stages of its economic path to that of other countries already over their demographic development and in the aging stage. This paper compares the demographic development paths of the Republic of Korea and Uzbekistan. These two countries have a similar history, their culture resembles each other, they both used to be very poor, but Korea nowadays is among the richest countries of the world. The example of Korea shows that well planned and
1 Professor at Corvinus University of Budapest
2 PhD student at Corvinus University of Budapest
relevant demographic policies can boost economic growth in developing countries which are in the first demographic dividend stage. These examples could serve as valuable lessons for the Uzbek economy, and other similar countries as well. The opportunity what the first demographic dividend provides is confirmed with our vector error correction model as well. Our model analyzes the short and long-run relationships between GDP per capita and a variety of economic and demographic indicators, both for Korea and Uzbekistan.
Keywords: demographic dividend, economic growth, age structural transition, education, employment
Introduction
Achieving economic growth while a population is aging requires setting the right demog- raphic policy. Most developed countries are facing the problem of aging, while, with very few exceptions in developing countries the working-age population is increasing due to the decline of the fertility rate. According to the World Bank, in developed countries, human resources comprise 68% to 76% of all national wealth (World Bank, 2018), which indicates that they are the main factors for economic development. Today in the world there are about 1.8 billion people aged 10 to 24, 90% of them live in developing countries (UNPFA, 2013).
1.8 billion is the largest the number of young people has ever been. As the United Nations Population Fund (UNFPA, 2014) highlighted, this number will grow until 2070, and the most significant part of this increase will happen in the least developed countries (UNFPA, 2014).
This condition provides an opportunity for the demographic dividend. However, this demog- raphic bonus will not last forever, as the growing life expectancy and decreasing fertility rates of these countries will cause a problem of aging in the future which leads to financing prob- lems of older people and a slower economic growth. Uzbekistan is one of the countries that currently goes through a demographic transition with decreasing fertility and mortality rates over the last three decades.
In this paper, we show the link between Uzbekistan's demographic change and economic development. Uzbekistan still enjoys the positive trends of the first demographic dividend.
However, it seems that this window opportunity might soon close. Fertility rates are falling and if these rates permanently approach the level of Japan, China, or the Republic of Korea, the situation is expected to worsen. In Japan, China, and Korea the opportunity given by the first demographic dividend has closed following the extremely low fertility rate and the increase in life expectancy. Therefore, the relative number of older people to the working-age population, who need to be supported by the society, has increased. Despite their aging problems, the East Asian countries have had a valuable positive experience from the demographic dividend. The demographic transition occurred during the 1950s until the 1970s and lasted for a shorter period than in other countries. It is argued that the economic outcome of the demographic dividend depends on government policy (Mason, 2005). Without a complementary economic policy, it is hard to gain economic benefits from the increasing working-age population. Governments who came up with the best policies to exploit the first dividend decided to invest in youth develop- ment, to develop infrastructure, and promote the participation of the female labor force, all of which led to a significant economic growth. From 1965 to 1990, the GDP per capita of the East Asian countries rose by 6.1% in average yearly (Eastwood&Lipton, 2012) and a 1.37%-1.87%
growth was due to changing in the age structure (Bloom&Williamson, 1998). Other calculations claim that the role of the demographic dividend in the total growth reached from 25% to 40%
in the case of the so-called East Asian tigers. Among the East Asian countries, South Korea is a prime example for boosting its demographic dividend. In this paper, Uzbekistan is compared to the Republic of Korea, as these two countries have many historic similarities. Both countries were formerly part of an empire or an empire-like country, as Korea was ruled by the Empire of Japan until the end of the Second World War and Uzbekistan was a part of the Soviet Union (and formerly the Russian Empire) until it was dismantled in 1990. Moreover, both countries had very high fertility rates, similar family traditions, and comparable role of women in the society (Chang, 2003), which are common starting points.
In the early 1960’s Korea had a low economic development and its per capita income was around 100$ while its population growth was 3% annually. This caused problems such as unemployment, job shortages, and poverty up to the point where almost 40% of the whole population suffered from poverty (Kim, 1991). During the demographic shift, the fertility rate declined to 2 children per women in 1983 and the labor force increased by 2.7% which caused roughly one third of the economic growth (Mason, 2002; Bloom et al, 2003). Through proper economic planning the country increased its per capita GDP to 26761$ by 2018 (adjusted to constant 2010 price levels, US$), which is 28 times higher than in 1960 (World Bank, 2020), and shifted from a poor agrarian country to an industrial high-income country (Lee&Lee, 2013). These achievements make their experience valuable for the countries in a stage of demographic transition.
Many countries went through a demographic transition with declining mortality and fertil- ity rates, while others are currently in this process (Bongaarts 2008; United Nations 2012), like Uzbekistan. Nowadays, Uzbekistan has a moderate level of dependency ratio and a decreas- ing level of birth rate, which is estimated to reach its minimum point in 2030, and the work- ing-age population is estimated to peak in 2048 (UNICEF, 2018). This tendency requires using the demographic window of opportunity as soon as possible before it disappears. To exploit this demographic opportunity, it is beneficial to learn from other countries. Although there is no universal formula for exploiting the demographic dividend, Uzbekistan can adapt the experience of other countries who managed to successfully tackle the problem of high skilled labor shortage and the high level of immigration caused by unemployment.
Due to the similarities in their history, and because of the very high success of Korean devel- opment, we take the Korean Republic as a benchmark for Uzbekistan. In this paper, we present a development path and the potential of this development in the context of the demographic changes in Uzbekistan. Korea has achieved a remarkable economic growth, and in terms of its main economic and demographic indicators, present-day Uzbekistan resembles Korea of the early 1980s. In this way, Uzbekistan has an excellent example when planning its future economic path, which if followed properly, would greatly accelerate Uzbekistan's economic development.
Of course, Uzbekistan should also learn to avoid the pitfalls Korea has failed to avoid when fol- lowing the path of demographic dividends, thinking mainly of the extremely high level of aging.
In the first part of our paper after the introduction, a brief literature review is provided on the economic impact of aging and on studies that discuss how to avoid negative impacts. Then, in the third section, we summarize the development of Uzbekistan and Korea. The main macroe- conomic indicators of aging are also listed there. In section four we show our model calculations.
We quantify the per capita GDP growth of Uzbekistan and Korea and use the Korean equation
as a baseline estimation. Finally, in the fifth section, a conclusion is drawn from the development paths and a summary is given to show the reasons why the growth rate of Uzbekistan is slower than the Korean.
Literature review
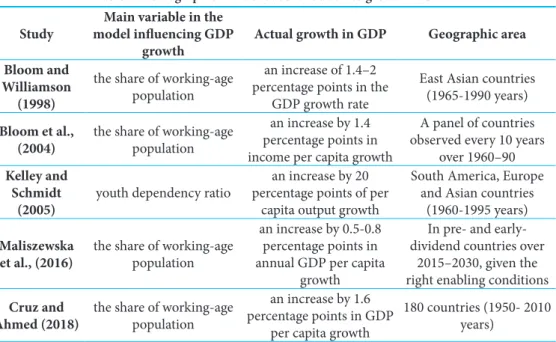
The demographic dividend provides an opportunity to achieve economic growth due to chan- ging the age structure of the country. It occurs when in a country the share of the labor force increases, while the fertility and mortality rates and the number of the dependents decreases (Gupta, 2014; Turbat 2017; Lee&Mason 2006), especially the child dependency ratio (Turbat 2017). The first demographic dividend (DD) is used, when the share of the working-age popu- lation (covers people aged 15 to 64) is increasing in the total population. An increase in the working-age population (WAP) results in the decrease of the child dependency (the ratio of people aged 0-14 and the working-age population) and the old age dependency ratios (the ratio of people aged 65+ and the working-age population). Countries with the greatest demographic opportunity for development are those entering a period in which the working-age population has good health (Bloom et al., 2004), an access to a quality education, decent opportunities for employment, and a lower proportion of young dependents. A smaller number of children per household generally leads to larger investments per child (Joshi & Schultz, 2007, Turbat 2017) and family welfare, provides more freedom for women to enter the formal workforce (Bailey, 2006), which later leads to an increased income (Lee&Mason, 2006) and labor supply per capita (Bloom et al., 2009) and more household savings for old age (UNFPA, Gupta, 2014). The latter is known as one of the components of the so-called second demographic dividend (Lee&Mason, 2006, Cruz&Ahmed, 2018). The second demographic dividend can provide a further source for growth for a country once the first demographic dividend has already been exploited. Going back to the first demographic dividend it is proven in several studies that there is a positive relationship between the increasing share of the working-age population and GDP per capita growth. In the table (1) we summarize some of the most important papers dealing with this relationship using econometric models. In the first column the reference of the papers are given, the second column, contains the most important demographic variable in the model influencing GDP growth, the third column shows the level of the GDP growth, and the last column contains the geographic area for which calculations were done.
As table (1) shows, the demographic transition has played an important, positive role in sustainable economic development (Bloom et al., 2010; Lee&Mason, 2010; Mason, 2001, 2005;
Mason&Lee, 2007) and the degree of success between national population dynamics and global economic growth varied by countries and depended on the demographic and economic policy chosen. The East Asian countries gained benefits from the demographic dividend through making large investments in education, establishing policies and institutional environments to support domestic entrepreneurs and to encourage foreign capital inflows to the country (Eastwood&Lipton, 2012), and formulating and implementing state-led macroeconomic poli- cies, especially social polices (Groth et al., 2019), which effected development positively. By int- roducing obligatory barriers in having many children and investing into human capital, China accelerated its economic growth through the demographic dividend from 1980 until 2010 (Wei&Zheng, et al, 2010).
Table 1. Demographic Dividend: contribution to growth in GDP Study Main variable in the
model influencing GDP
growth Actual growth in GDP Geographic area Bloom and
Williamson (1998)
the share of working-age population
an increase of 1.4–2 percentage points in the
GDP growth rate
East Asian countries (1965-1990 years) Bloom et al.,
(2004) the share of working-age population
an increase by 1.4 percentage points in income per capita growth
A panel of countries observed every 10 years
over 1960–90 Kelley and
Schmidt
(2005) youth dependency ratio an increase by 20 percentage points of per
capita output growth
South America, Europe and Asian countries
(1960-1995 years) Maliszewska
et al., (2016) the share of working-age population
an increase by 0.5-0.8 percentage points in annual GDP per capita
growth
In pre- and early- dividend countries over
2015–2030, given the right enabling conditions Cruz and
Ahmed (2018) the share of working-age population
an increase by 1.6 percentage points in GDP
per capita growth
180 countries (1950- 2010 years)
Source: Author’s’ collection from the cited papers
Sung Yeung Kwack and Young Sun Lee (2006) used neo-classical models of growth to analyze the Korean development from 1971 to 2002 and they emphasized the role of human capital and R&D. Today, Korea experiences a rising share of older-age population and a falling proportion of the younger-age population, due to which the growth rate of GDP per capita is expected to decrease. To avoid this negative effect it is required from the Korean government to encourage measures in order to reverse the negative trend in birth rates among young couples, to invest even more in education and R&D, and encourage people to stay active on the job market longer (Kwack&Lee, 2006).
To gain from the demographic windows of opportunity requires a proper demographic pol- icy, including human capital investment into children and youth potential, especially increasing the quality of early childhood development (Elagno, et al, 2015), and the number of students in primary, secondary, and tertiary education (UNICEF, 2018), promoting youth entrepreneur- ship, competence, and employment, and providing an opportunity to acquire new and impor- tant skills. These are necessary steps that should be done by every country in the stage of a demographic transition, including Uzbekistan. Even the 100% literacy rate (World Bank, 2018) of Uzbekistan needs to be accompanied by more investments in tertiary education, lifelong learning, and professional trainings in order to successfully increase the country’s possibility to develop further (Sidorenko, 2016).
Analyzing the components of demographic development
Demographic development of Uzbekistan:
Today, Uzbekistan is the most populated country in Central Asia with 33 million inhabi- tants, which makes up almost half of the total population in the region. Before gaining inde- pendence from the Soviet Union in 1990, the total population of Uzbekistan was 20.5 mil- lion, which increased by 60% until 2018. In the 1990-2018 period, the average annual popu- lation growth rate in Uzbekistan decreased from 2.8-3.0% to 1.2-1.3%, mainly due to the fluctuation of the birth rates, but the difference between the number of newly born babies and deaths in the population was always positive. The number of active people (aged 15-64) grew from 10.1 million to 18.8 million from 1991 to 2018 (World Bank, 2020). Currently, the demographic situation of the republic is characterized by a moderately expanded popu- lation growth, which is due to a change in the reproductive behavior of the population. As a result of the growth of urban population and the increasing mean age of marriage, the total fertility rate of the country fell from 4.1 births per woman in 1991 to 2.4 births in 2018.
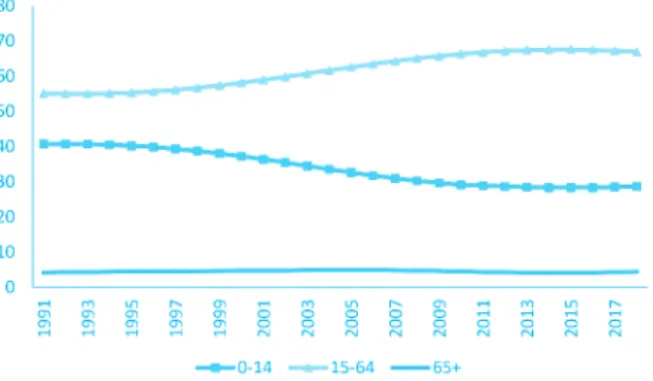
Besides, the infant mortality rate went down and reached 19.1 infant deaths per 1000 live births, while it was 59.3 in 1991. Obviously, with a higher standard of living and improved medical services and nutrition, such a declining trend was also observed in other mortality indicators, such as crude death rate and the mortality rate of children under 5. Accordingly, life expectancy at birth showed a positive trend, it was 66.4 years in 1991, but became 71.3 years in 2018 (World Bank, 2020). All these tendencies have caused the share of children in the population to fall and the share of the working-age population to rise, mainly owing to the high birth rate in past years (see figure 1 below).
Figure 1. The share of age groups in the population of Uzbekistan, %
Source: World development indicators, World bank
The proportion of children (aged 0-15) decreased from 40.7% in 1991 to 28.6% in 2018. A decline in the fertility rate is usually accompanied by demographic aging, however, this is currently still almost invisible in Uzbekistan. The share of the retirement age population increased slightly (4.1% in 1991 to 4.5 % in 2018). As a result, the share of the working-age population (aged 15-64)
had an increasing trend and in 2018 this ratio was 66.8% (World Bank, 2020). The growing number of working age people puts a pressure on the job market, but due to the shortage of jobs, the total number of unemployed people is increasing, especially it is higher among younger people. In 1991 youth unemployment was 3.48% which reached 9.72% in 2018. Unfortunately, the educational level of younger people does not meet the demand of the labor market because of limited access to higher education. This has a negative effect on the country’s development.
Korea faced a very similar problem with low capacity of higher education at the beginning of the 1980’s (Schmid, 2013).
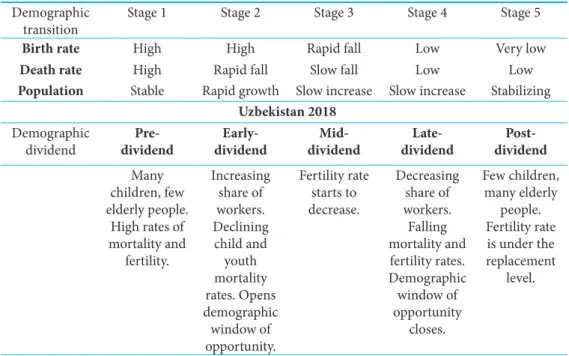
Table 2 summarizes the demographic conditions of Uzbekistan in the light of the catego- rization of the demographic growth of societies, so it allows us to see in which demographic state Uzbekistan currently is. The increasing number of the total population, high birth rate and decrease of the death rate are the key factors of stage two or the so-called early-dividend, which means an opened demographic window of opportunity and as Uzbekistan currently has a declining fertility rate, it stands in between the second and the third stages that provides an advantageous situation to benefit from this demographic transition.
Table 2. Uzbekistan in a phase of demographic transition and demographic dividend Demographic
transition Stage 1 Stage 2 Stage 3 Stage 4 Stage 5
Birth rate High High Rapid fall Low Very low
Death rate High Rapid fall Slow fall Low Low
Population Stable Rapid growth Slow increase Slow increase Stabilizing Uzbekistan 2018
Demographic
dividend Pre-
dividend Early-
dividend Mid-
dividend Late-
dividend Post- dividend Many
children, few elderly people.
High rates of mortality and fertility.
Increasing share of workers.
Declining child and youth mortality rates. Opens demographic window of opportunity.
Fertility rate starts to decrease.
Decreasing share of workers.
Falling mortality and fertility rates.
Demographic window of opportunity
closes.
Few children, many elderly
people.
Fertility rate is under the replacement
level.
Source: Made by author based on UNICEF, 2018
Comparing the demographic and economic development of Uzbekistan and Korea:
To predict the future economic path of Uzbekistan, it is beneficial to compare the critical sta- ges of the economic and demographic development path of the Korean economy to the Uzbek
economy. When we conclude, we must not forget that Korea now is in the aging demographic stage. Analyzing economic indicators of both countries allow us to draw the conclusion that Uzbekistan’s current economic condition resembles Korea’s indicators after the Asian crisis of 1997. Korea developed quickly before the crisis, the average growth rate of real GDP between 1981 and 1996 was 9.3%, which fell to 3.7% during the 2003-2014 period (Whang et. al, 2015).
The Korean development path was so impressive that as a result, Korea was recharacterized as a developed country (Lee&Lee, 2013). Uzbekistan’s average annual GDP growth rate was 8% from 2005 until 2015 (Malikov et.el, 2016). The structure of an economy influences how employment is shared across the sectors, which changed dramatically in Korea. Agriculture had 58.4% of the total employment in 1965, and only 5% in 2018, whereas in the service sector the share more than doubled with 31.2% in 1965 and 70.4% in 2018 (Lee&Lee, 2013, World Bank, 2020). There is no visible change in Uzbekistan, in 2018 when 33.6% of all employees still worked in agricul- ture. Similar employment shares were observed in Korea in the 1980’s.
Table 3. Economic and demographic indicators of Korea
year GDP growth (annual %) GDP per capita growth (annual %) Population growth (annual %) Population, total (mln.) Fertility rate, total (births per woman) Mortality rate, infant (per 1,000 live births) Age de- pendency ratio (% of working-age population) Population ages 15-64 (% of total popu- lation)
1969 14.5 11.9 2.26 31.5 4.47 50.2 84.5 54.1
1971 10.4 8.2 1.97 32.8 4.54 44.3 81.08 55.2
1973 14.8 12.8 1.76 34.1 4.07 39.8 76.8 56.5
1975 7.8 6.06 1.68 35.2 3.43 36.5 72.1 58.08
1977 12.2 10.5 1.55 36.4 2.99 33.7 67.7 59.6
1779 8.6 6.9 1.51 37.5 2.9 30.9 63.1 61.2
1981 7.1 5.5 1.56 38.7 2.57 27.7 59.1 62.8
Economic and demographic indicators of Uzbekistan
year GDP growth (annual %) GDP per capita growth (annual %) Population growth (annual %) Population, total (mln.) Fertility rate, total (births per woman) Mortality rate, infant (per 1,000 live births) Age dependency ratio (% of working-age population) Population ages 15-64 (% of total population)
2006 7.4 6.1 1.22 26.4 2.39 40 57.5 63.4
2008 9 7.2 1.6 27.3 2.63 35.8 53.7 65.04
2010 8.4 5.4 2.82 28.5 2.34 31.8 50.6 66.3
2012 8.1 6.5 1.73 29.7 2.19 28.1 49.01 67.1
2014 7.1 5.3 1.73 30.7 2.4 24.6 47.9 67.5
2016 6.09 4.2 1.68 31.8 2.4 21.5 48.2 67.4
2018 5.1 3.3 1.47 32.9 2.2 19.1 49.4 66.8
Source: Authors calculation based on World development indicators
The comparison of the main demographic indicators showed that currently Uzbekistan’s con- ditions mostly resemble those of Korea in the 1969-1981 period. In 1971 the total population
of Korea was almost 33 million with a 1.8% population growth. This is almost identical to Uzbekistan’s population growth in 2018. A similar pattern can be seen in the two countries’
fertility rates. In Korea in the 1960s, the fertility rate was 6.1 children per woman and decrea- sed rapidly by 1981 to 2.57 children and this decline continued until today. The fertility rate of Korea in 2018 was 1.05, while Uzbekistan’s fertility rate in the same year was 2.45, however, it is expected to fall further (UNICEF, 2018). The working age population in Uzbekistan was 18.12 million in 2018 and it is still expected to increase further. An increase in the number of the active population (aged 15-64) puts pressure on the government to create new jobs, otherwise, this boom can end up in social problems.
While the GDP per capita increased in Korea, the education level also increased, and partly this was the cause of the GDP growth (Lee&Lee, 2013). The Korean case shows how educa- tion could exploit the opportunity provided by the first demographic dividend. In Uzbekistan, despite positive changes have been made to improve education, there still are challenges that should be tackled. First, the low rate of participation of preschoolers to early childhood edu- cation. Despite by 2018 almost 30% of children had the chance to go to preschool, while it was only 25% in 2016 (UNICEF, 2020 and Stat Uzbekistan, 2020), it is still a very low number if we compare it with the Korean 89.01% of the same year. In the meantime, the female labor force participation rate in Korea increased from 35.4% in 1964 to 43.1% in 1986 and to 52.7 in 2018.
In Uzbekistan, the female participation rate was a little higher 53.8% in 2018 (UNICEF, 2018) but this is more of a heritage from the Soviet era, and not a good indicator of effective use of human workforce, because in Uzbekistan women work mainly in less prestigious jobs, while in Korea females supposed to have higher positions more often.
In Uzbekistan, all girls have access to primary education, but this tendency does not keep up to tertiary education, contrary to the Korean practice. In Uzbekistan early marriage of girls is still typical, which hinders girls from entering higher education. The enrolment rate of females in tertiary education in Korea was 82.8% in 2017, while in Uzbekistan it was 8.2% in 2018 (World Bank, 2019). Besides, not every child can continue their studies at a higher educational institu- tion due to higher costs. Only children from wealthy families can pay for extracurricular training courses which increase the chance of admittance to a university, while with the regular school curriculum and quality it is hard to be admitted to a university without paying the tuition fee.
Wealthy families can afford the tuition fee, so their children have access to higher education even if they cannot obtain good results on the enrollment exam. The higher education coverage of school graduates in Uzbekistan (access to higher education) is still low, but this indicator has increased from 9% in 1992 to 20% recently in 2018 and some further increase can be expected, as this indicator was 67.6% in 2018 in Korea (UNESCO, 2019). As the Korean case shows, increas- ing enrollment in the higher education is inevitable for a country if it wants to use the window of opportunity of the first demographic dividend.
Estimation of per capita GDPs by a vector error correction model
After describing the economic and demographic situation in Uzbekistan, and the compari- son with Korea, we construct equations which explain the GDP per capita growth with some economic and demographic indicators to analyze whether the growth of the working-age population creates an advantage for the economic development of the country. We apply a
vector error correction model (VECM) to estimate a long-run equilibrium and short-run relationships among the variables following the methodology of Rizk (2019), which was based on long run Cobb–Douglas production function. The VECM model is one of the widely used econometric methods permitting long-term components of variables to maintain long-term equilibrium relationships with short-term components (Ahmad et. el, 2006). The VECM uses the following basic equation:
∆X=
Σ
pj =1Гj∆Xt-1+ПXt-p+μ+ε (1)In equation (1) Δ means first difference, П is a matrix of constant coefficients, X is a vector and it consists of information on both the short and long-run adjustments to changes in X through Г and П estimates, t-1 represents the lagged by one year values.
Our empirical data is taken from the World Development Indicators, and our estimation is carried out over the period of 1970-2018 for Korea and 1991-2018 for Uzbekistan, after obtain- ing independence from the USSR. For Korea, the analyzed time frame is 48 years, which is longer than the one for Uzbekistan. The lack of data for a longer period may cause difficulties to get pre- cise results in the case of Uzbekistan but with a cautious explanation of the results, they still give some important insight into what happened during the analyzed period. To get robust results, the logarithms of the variables are used. The model consists of five variables: log GDP per capita (a measure of gross domestic product divided by midyear population, adjusted to constant 2010 price levels – LGDPC); the share of working-age population (aged 15-64 – LWAP); the pro- portion of the elderly population (65 and over – LPOP65); the gross enrolment rate in tertiary education (it is calculated as the ratio of tertiary enrolment to the population of the relevant age group – LTER) and Gross domestic savings (% of GDP – LGDS). The equation estimated on the GDP per capita is as follow:
∆LGDPCt=δ0+δ1∆LWAPt-1+δ2∆LPOP65t-1+δ3∆LTERt-1+δ4∆LGDSt-1+εt (2)
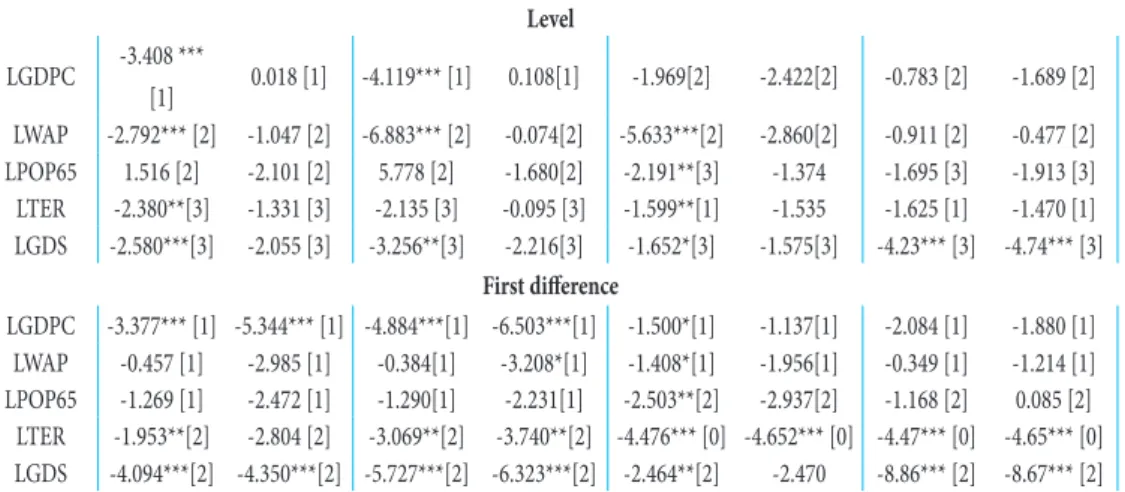
Our model requires variables to be integrated at the same order. Table 4 gives information about the two most popular test methods, the augmented Dickey–Fuller (ADF) test (Dickey and Fuller, 1979) and the Philips–Perron test. We include an intercept and a deterministic trend in these tests to estimate whether the variables are stationary or non-stationary and to ensure that no spurious results were found. The lag selection is chosen according to the Schwarz Information Criterion. According to the test results, in the case of Korea, all variab- les are stationary at the first difference except for the share of working-age population (it is stationary at the level and at the first difference according to PP test) and elderly population.
In the case of Uzbekistan, the null hypothesis can be rejected at the first difference for all the variables according to the ADF test, which means that there can be long-term cointegration relationship between the variables.
Table 4. Tests of Stationarity
Korea Uzbekistan
ADF [k] PP [k] ADF [k] PP [k]
Model 1 Model 2 Model 1 Model 2 Model 1 Model 2 Model 1 Model 2
Level LGDPC -3.408 ***
[1] 0.018 [1] -4.119*** [1] 0.108[1] -1.969[2] -2.422[2] -0.783 [2] -1.689 [2]
LWAP -2.792*** [2] -1.047 [2] -6.883*** [2] -0.074[2] -5.633***[2] -2.860[2] -0.911 [2] -0.477 [2]
LPOP65 1.516 [2] -2.101 [2] 5.778 [2] -1.680[2] -2.191**[3] -1.374 -1.695 [3] -1.913 [3]
LTER -2.380**[3] -1.331 [3] -2.135 [3] -0.095 [3] -1.599**[1] -1.535 -1.625 [1] -1.470 [1]
LGDS -2.580***[3] -2.055 [3] -3.256**[3] -2.216[3] -1.652*[3] -1.575[3] -4.23*** [3] -4.74*** [3]
First difference
LGDPC -3.377*** [1] -5.344*** [1] -4.884***[1] -6.503***[1] -1.500*[1] -1.137[1] -2.084 [1] -1.880 [1]
LWAP -0.457 [1] -2.985 [1] -0.384[1] -3.208*[1] -1.408*[1] -1.956[1] -0.349 [1] -1.214 [1]
LPOP65 -1.269 [1] -2.472 [1] -1.290[1] -2.231[1] -2.503**[2] -2.937[2] -1.168 [2] 0.085 [2]
LTER -1.953**[2] -2.804 [2] -3.069**[2] -3.740**[2] -4.476*** [0] -4.652*** [0] -4.47*** [0] -4.65*** [0]
LGDS -4.094***[2] -4.350***[2] -5.727***[2] -6.323***[2] -2.464**[2] -2.470 -8.86*** [2] -8.67*** [2]
*Model (1) with constant and no deterministic trend, Model (2) with constant and deterministic trend To determine the cointegration ranks, we follow Johansen (1988) and Johansen and Juselius (1990, JJ 1990 furthermore). Table 5 summarizes the results of the cointegration analysis for both Trace statistic and Max-Eigen statistic tests, which were done according to the optimal lag selec- tion giving a maximum lag of two for the variables of both Korea and Uzbekistan (we used the Schwartz Information Criterion). The JJ (1990) Trace test and the Max-Eigen statistics indicate that there are cointegrated relations and rejects the null-hypothesis (table 5), which means that there exists a long-run relationship between the variables.
Table 5. Johansen test results No. of
cointegrating
vectors Eigenvalue Trace
Statistic Critical
Value (0.05) Eigenvalue Trace
Statistic Critical Value (0.05)
Korea Uzbekistan
1: Trace test
None - 99.497 68.52 . 241.7952 68.52
At most 1 0.53 63.04 47.21 0.99162 117.4797 47.21
At most 2 0.49 31.18 29.68 0.91796 52.4654 29.68
At most 3 0.4 7.10 15.41 0.68593 22.3540 15.41
At most 4 0.13 0.46 3.76 0.45836 6.4121 3.76
2: Max-Eigen Statistics
None - 36.45 33.46 . 124.3155 33.46
At most 1 0.53 31.86 27.07 0.99162 65.0143 27.07
At most 2 0.49 24.08 20.97 0.91796 30.1114 20.97
At most 3 0.4 6.63 14.07 0.68593 15.9419 14.07
At most 4 0.13 0.46 3.76 0.45836 6.4121 3.76
Notes: H0: There is no cointegrating equation; H1: There is a cointegrating equation.
In this case, we reject the null hypothesis of the Trace test and Max-eigenvalue indicates the existence of cointegration equation(s).
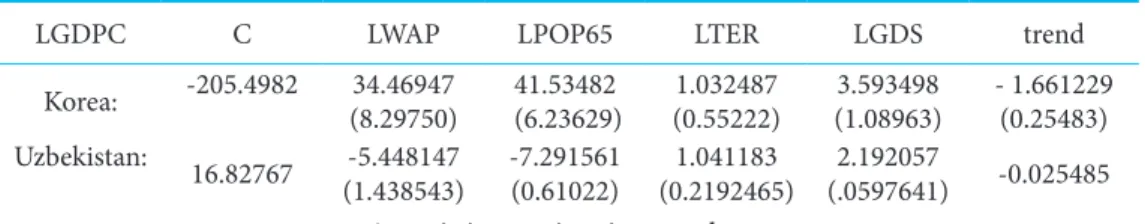
We proceed with the estimation of the VECM model for each variable, as this model provides a correction term which influences the relationship between variables in a long-run equilibrium and short-run parameters. According to our results, as seen in table 6, we can infer that in the case of Uzbekistan, the share of working age population has a negative effect on the GDP per capita and all variables are significant. This calculation highlights that the increasing share of working age population can be a disadvantageous for Uzbekistan, as the country might not be able to cope with the increase of working-age people. This result must be taken cautiously, due to the relatively short time series period.
However, as we have discussed in the second part of this paper, tertiary education enrolment rate is not a proper way to take advantage of the increasing working age population, which can be one of the few causes affecting GDP per capita growth negatively. Moreover, it can be explained that in the case of an increasing working-age population there is a need to create more jobs, but without an appropriate level of education, the future workforce will not satisfy the demand of the knowledge-based economy. This fact leads to a further increase of the unemployment rate. With a high unemployment rate, countries can barely support people aged 65 and above.
Moreover, the share of older people is expecting to grow, further worsening the situation. Unlike in Uzbekistan, in South Korea, the share of the working-age population has a positive effect on the GDP per capita. These results show that Korea gained from the opportunity of the demo- graphic dividend, while for Uzbekistan this opportunity could be a disadvantage.
Table 6. The estimated long-run relationships
LGDPC C LWAP LPOP65 LTER LGDS trend
Korea: -205.4982 34.46947
(8.29750) 41.53482
(6.23629) 1.032487
(0.55222) 3.593498
(1.08963) - 1.661229 (0.25483) Uzbekistan: 16.82767 -5.448147 (1.438543) -7.291561
(0.61022) 1.041183
(0.2192465) 2.192057
(.0597641) -0.025485
*t-statistics are given in parentheses
The error correction term is derived from a long-run cointegration relation. Table 7 highlights that in the case of Korea the error correction term (ECTt–1) is negative and significant in the real GDP per capita equation. This means that a long-run relationship exists between GDP per capita and the dependent variables and in the long run, this relationship shows a 3.6% annual adjustment to disequilibrium. Moreover, tertiary education has a negative effect and savings have a positive effect on GDP per capita growth in the short run at a 1% significance level. They seem to explain GDP per capita well, but other variables do not seem to contribute to the GDP per capita in the short-run.
Table 7. Vector error correction model (VECM) for Korea
Error Correction: D(LGDP) D(LSAVING) D(LOLD) D(LWAP) D(LTERTIARY) ECTt–1 -0.037696 -0.018848 -0.003395 0.000223 -0.029282
(0.00881) (0.02487) (0.00084) (0.00057) (0.01662) D(LGDP(-1)) 0.079170 -0.198948 0.004802 0.002975 -0.156008
(0.13515) (0.38166) (0.01291) (0.00881) (0.25508) D(LSAVING(-1)) 0.128516 0.194990 0.000803 0.004364 -0.077560 (0.05749) (0.16234) (0.00549) (0.00375) (0.10850) D(LOLD(-1)) -1.512427 -3.245251 0.781511 -0.064111 -3.257852 (0.72106) (2.03620) (0.06888) (0.04702) (1.36087) D(LWAP(-1)) 4.393409 0.687725 -0.103590 0.837722 1.856860 (1.28293) (3.62288) (0.12256) (0.08367) (2.42130) D(LTERTIARY(-1)) -0.362976 -0.122831 -0.015158 0.004680 0.256641 (0.08921) (0.25191) (0.00852) (0.00582) (0.16836)
C 0.087535 0.126008 0.008163 0.002083 0.136784
(0.02855) (0.08061) (0.00273) (0.00186) (0.05387) R-squared 0.537324 0.155065 0.936421 0.916503 0.538548
Vector error correction model (VECM) for Uzbekistan
Error Correction: D(LGDP) D(LSAVING) D(LOLD) D(LWAP) D(LTERTIARY) ECTt–1 -.0043673 -.8278474 .0027847 -.0007536 -.0294461
.0610929 .0450863 .0027077 .0003641 .0363749 D(LGDP(-1)) .4124949 .2142379 -.0202771 -.0026916 -.2564743
.2554885 .1885494 .0113235 .0015229 .1521189 D(LSAVING(-1)) .0256702 .306631 -.0028376 .0009426 .0191607
.0851832 .0628648 .0037754 .0005077 .0507184 D(LOLD(-1)) -3.035327 -9.187487 .9480313 -.0212997 -.5141907
2.853842 2.106123 .1264846 .0170106 1.699189 D(LWAP(-1)) 4.950701 -56.57199 -.20323 .9108329 -3.863739
7.529435 5.55669 .3337108 .0448799 4.483056 D(LTERTIARY(-1)) .0042699 .2483953 -.0014696 .0002986 -.2113172
.3825122 .2822923 .0169533 .00228 .2277493
C .0303437 .0224611 -.0013935 .0030881 -.042269 .0926063 .0683431 .0041044 .000552 .0551382
R-squared 0.5438 0.9666 0.9280 0.9957 0.3675
In the case of Uzbekistan, the error correction term is negative and significant, which means that these variables influence GDP per capita in the long-run, but none of the variables are significant which show that there are no causal effects of our variables in the short run. These results suggest that Uzbekistan should form a demographic policy to reap the advantages of the demographic dividend in the long run. Uzbekistan faces challenges on the labor market, with an increasing unemployment rate and lack of a skilled labor force, while the number of working age popula- tion increases. These challenges in Uzbekistan’s economy will most likely diminish or even stop the benefits from the window of demographic opportunity.
Conclusions
This paper provides an opportunity to get a basic overview of the demographic dividend on eco- nomic growth by comparing two countries, one who had already used the demographic window of opportunity very effectively (Korea), and another which is at the doorstep of this opportu- nity (Uzbekistan). Our empirical results confirm that the increasing working age population correlates positively with GDP per capita in the case of Korea, while it correlates negatively in the case of Uzbekistan, indicating that this window of opportunity might be disadvantageous for Uzbekistan. Moreover, our results show that in the case of Korea, a long-run relationship exists between GDP per capita and some demographic and economic variables used as depen- dent variables. Tertiary education and savings affect GDP per capita in the short-run and have a strong explanatory power to GDP per capita. In the case of Uzbekistan, both working-age population and population aged 65 and above have a negative effect on the GDP per capita in the long-run. This result is related to the challenges that an increasing unemployment rate and a limit in higher education decreases the size of the skilled labour force and decreases the rate of women participating in the labour market. These problems do not allow the absorption of the new influx of working-age population to the job market productively. In order to avoid the negative consequences and to not end up letting the demographic dividend period pass without any gains, we suggest to analyze what Korea did, and using it as a benchmark for Uzbekistan: first of all, Uzbekistan should create labour opportunities for the increasing working-age population and invest into younger people to increase the quality and quantity of their education. Here, especially tertiary education plays an important role to increase the highly skilled labor force in a knowledge-based economy. Moreover, a higher gender equity could boost more effective pro- duction as well. By the help of appropriate policies, women must be encouraged to get a better education and professional skills. All these factors together could highly increase the opportu- nity what the first demographic dividend provides to Uzbekistan.
References
Bailey, M. J. (2006). More power to the pill: the impact of contraceptive freedom on women's lifecycle labor supply. Quarterly Journal of Economics, 121(1), 289−320.
Blacker, C. P. (1947). Stages in population growth. The Eugenics Review, 39(3), 88.
Bloom, D. E., Canning, D., & Sevilla, J. (2004). The effect of health on economic growth: a production function approach. World Development, 32(1), 1−13.
Bloom, D. E., Canning, D., & Fink, G. (2010). Implications of population ageing for economic growth. Oxford review of economic policy, 26(4), 583-612.
Bloom, D. E., Canning, D., Fink, G., Finlay, J. E. (2009). Fertility, female labor force participation, and the demographic dividend. Journal of Economic growth, 14(2), 79-101.
Bloom, D. E., Williamson, J. G. (1998). Demographic transitions and economic miracles in emerging Asia. World Bank Economic Review, 12(3), 419−455.
Bongaarts, J. (2008). Fertility transitions in developing countries: Progress or stagnation? Studies in Family Planning, 39, 105–110.
Chang, K. S. (2003). The state and families in South Korea’s compressed fertility transition: A time for policy reversal. Journal of Population and Social Security (Population), 1, 596-610.
Chesnais, J.-C.(1992):The Demographic Transition: Stages, Patterns, and Economic Im-plications.
Oxford University Press.
Chepel S. V., Ibragimova N. M. (2016). Economic Growth and Accessibility of Higher Education:
Hypotheses, Channels, Interrelations and its Importance for Developing Countries. Scientific journal of human capital and professional education (Научный журнал: Человеческий капитал и профессиональное образование), 4, 4-17.
Cho, U., & Koo, H. (1983). Economic Development and women's work in a newly industrializing country: the case of Korea. Development and Change, 14(4), 515-531.
Cruz, M., & Ahmed, S. A. (2018). On the impact of demographic change on economic growth and poverty. World Development, 105, 95-106.
Eastwood, R., & Lipton, M. (2012). The demographic dividend: retrospect and prospect.
Economic Affairs, 32(1), 26-30.
Elango, S., García, J. L., Heckman, J. J., & Hojman, A. (2015). Early childhood education. In Economics of Means-Tested Transfer Programs in the United States, Volume 2 (pp. 235-297).
University of Chicago Press.
Gribble, J. N., & Bremner, J. (2012). Achieving a demographic dividend. Population Bulletin, 67(2).
Groth, H., May, J. F., & Turbat, V. (2019). Policies needed to capture a demographic dividend in Sub-Saharan Africa. Canadian Studies in Population, 46(1), 61-72.
Gupta, M. D. (2014). State of World Population 2014: The Power of 1.8 Billion: Adolescents, Youth and the Transformation of the Future. UNFPA.
Howe, N., Jackson, R., & Nakashima, K. (2007). The aging of Korea. Demographics and retirement policy in the Land of the Morning Calm.
Hyo-Chae, L., & Hyoung, C. (1977). Fertility and women's labor force participation in Korea.
Korea journal, 17(7), 12-34.
Joshi, S., & Schultz, P. (2007). Family planning as an investment in development: evaluation of a program's consequences in Matlab, Bangladesh. Economic growth center working paper, Vol. 951.
Kim, K. S. (1991). The Korean miracle (1962-1980) revisited: Myths and realities in strategy and development. Helen Kellogg Institute for International Studies, University of Notre Dame.
Kelley, A. C., & Schmidt, R. M. (2005). Evolution of recent economic-demographic modeling: A synthesis. Journal of Population Economics, 18(2), 275-300.
Kwack, S. Y., & Lee, Y. S. (2006). Analyzing the Korea's growth experience: The application of R&D and human capital based growth models with demography. Journal of Asian Economics, 17(5), 818-831.
Kwon, Y. I. (2004). Early childhood education in Korea: Discrepancy between national kindergarten curriculum and practices. Educational Review, 56(3), 297-312.
Lange, G. M., Wodon, Q., & Carey, K. (Eds.). (2018). The changing wealth of nations 2018:
Building a sustainable future. The World Bank.
Lee, R., & Mason, A. (2006). What is the demographic dividend? Finance & Development, 43(3), 16–17.
Lee, R., & Mason, A. (2010). Fertility, human capital, and economic growth over the demographic transition. European Journal of Population/Revue européenne de Démographie, 26(2), 159-182.
Lee, Y. Y., & Lee, S. S. Y. (2013). Policy implications for inclusive growth in the Republic of Korea.
Korea and the World Economy, 14(3), 607-651.
Lutz, W., Cuaresma, J. C., Kebede, E., Prskawetz, A., Sanderson, W. C., & Striessnig, E. (2019).
Education rather than age structure brings demographic dividend. Proceedings of the National Academy of Sciences, 116(26), 12798-12803.
North, D. C., Wallis, J. J., & Weingast, B. R. (2009). Violence and social orders: A conceptual framework for interpreting recorded human history. Cambridge University Press.
Malikov, N., Qineti, A., & Pulatov, A. (2016). Agriculture and economic development in Uzbekistan. International Scientific Days.
Maliszewska, M., Ahmed, S. A., Cruz, M., & Winters, A. (2016). Cashing in the demographic dividend.
Mason, A. (2005, August). Demographic transition and demographic dividends in developed and developing countries. In United Nations expert group meeting on social and economic implications of changing population age structures (Vol. 31).
Mason, A., & Kinugasa, T. (2008). East Asian economic development: two demographic dividends. Journal of Asian economics, 19(5-6), 389-399.
Mason, A., & Lee, R. (2006). Reform and support systems for the elderly in developing countries:Capturing the second demographic dividend. Genus, 62(2), 11–35.
Mason, A., & Lee, R. (2011). Population aging and the generational economy: key findings.
Population aging and the generational economy: A global perspective, 3-31.
McMullen, M., Elicker, J., Wang, J., Erdiller, Z., Lee, S. M., Lin, C. H., & Sun, P. Y. (2005). Comparing beliefs about appropriate practice among early childhood education and care professionals from the US, China, Taiwan, Korea and Turkey. Early childhood research quarterly, 20(4), 451-464.
McNay, K. (2003). Women's changing roles in the context of the demographic transition. Background paper for UNESCO’s Education For All Global Monitoring Report, 4.
Ministry of Education. (2003, May 16). Korean educational statistics. Retrieved July 1, 2004. From http://www.moe.go.kr/en/etc/statistics.html.
OECD (2019), Education at a Glance Database, https://www.oecd-ilibrary.org/education/
education-at-a-glance-Park, Y. J. (1990). Korean Patterns of Women's Labor Force Participation During the Period, 1960-1980. Korea journal of population and development, 71-90.
Rizk, R. (2019). Does demographic transition matter for economic growth? Evidence from Egypt.
The Journal of North African Studies, 24(6), 1012-1035.
Schmid, G. (2013). Youth Unemployment in Korea: From a German and Transitional Labour Market Point of View (No. 63). IZA Policy Paper.
Schwekendiek, D., & Baten, J. (2019). Height development of men and women from China, South Korea, and Taiwan during the rapid economic transformation period of the 1960s–1980s.
Economics & Human Biology, 34, 169-180.
Shin, C. S., & Shaw, I. (2003). Social policy in South Korea: cultural and structural factors in the emergence of welfare. Social Policy & Administration, 37(4), 328-341.
Sidorenko, A. (2016). Challenges and opportunities of population ageing in the CIS+ countries.
International Journal on Ageing in Developing Countries, 1(1), 20-39.
Song, H. (1996). Reversal of Korean brain drain: 1960s-1980s. International Scientific Migrations, 010022327-27
Turbat, V. (2017). The demographic dividend: a potential surplus generated by a demographic
transition. In H. Groth & J. F. May (Eds.), Africa’s population: in search of a demographic dividend (pp. 181–195). Cham: Springer.
UIS Statistics, Graduates from tertiary education, both sexes male and female (number), 2017.
UNICEF, (2018). Generation 2030 Uzbekistan. Investing in children and young people to reap the demographic dividend. United Nations, New York.
UNICEF, (2019). Building a better future: A child-sensitive social protection system for Uzbekistan. UNICEF Uzbekistan
UNICEF Data, ‘Early childhood education’, Uzbekistan Data, accessed March 2020.
United Nations. (2014). World population prospects: The 2012 revision. Department of Economic and Social Affairs, Population Division. New York: United Nations.
United Nations Fund for Population Activities. (2013). Adolescent and youth demographics: A brief overview.
Wei, Z., & Hao, R. (2010). Demographic structure and economic growth: Evidence from China.
Journal of Comparative Economics, 38(4), 472-491.
Whang, U., Moon, S., Ahn, T., Kim, S. B., & Kim, J. (2015). Why did Korean domestic demand slow down after the Asian financial crisis?. KIEP Research Paper No. Policy Analysis-15-01.
World Bank. (2018). Adult Literacy Rate. Data. Accessed 20 March 2018 from: http://data.
worldbank. org/indicator/SE.ADT.LITR.ZS
World Bank Data, “School Enrollment, Tertiary (% Gross)”, accessed March 2020.
World Bank (2020), World development indicators, accessed March 2020, available at https://data.
worldbank.org/indicator
Zuber, A., Blickenstorfer, C., & Groth, H. (2017). Governance, transparency, and the rule of law.
In H. Groth & J. F. May (Eds.), Africa’s population: in search of a demographic dividend (pp.
367–384). Cham:Springer.