Non-linear heart rate dynamics during and after three controlled exercise intensities in healthy men
J. NARANJO-ORELLANA
1p, C. NIETO-JIM ENEZ
2and J.F. RUSO- ALVAREZ
11Universidad Pablo de Olavide, Sevilla, Spain
2Universidad del Desarrollo, Santiago, Chile
Received: September 26, 2019 • Accepted: August 17, 2020 Published online: December 24, 2020
© 2020 Akademiai Kiado, Budapest
ABSTRACT
We aimed to analyse the complexity and fractal nature of heartbeat during constant exercise, at three different intensities, and recovery.
Fourteen healthy men underwent 4 separate sessions. The first session was an incremental treadmill test to determine ventilatory thresholds (VT1 and VT2) and maximal aerobic speed (MAS). Each subject ran at VT1 and VT2 speeds and MAS (second, third and fourth day). The duration of VT1 and VT2 loads were selected in such a way that the product intensity-duration (training load) was the same. Sample Entropy (SampEn) and slope of Detrended Fluctuation Analysis (DFAa1) were measured during the whole session.
DFAa1 declines with exercise, being less in the VT1 trial than in the other two.
SampEn shows no significant change during exercise. The three tests induce the same decline in SampEn, but at the highest intensity (MAS) tends to decline during the exercise itself, whereas at lower intensities (VT1, VT2) the decline is delayed (10 min of recovery). Subsequently, SampEn at VT1 gradually recovers, whereas at VT2 and MAS it remains stable during recovery.
In conclusion, exercise produces a loss of heartbeat complexity, but not fractal nature, during recovery and it depends on intensity.
KEYWORDS
complexity, nonlinear dynamics, entropy, fractal nature, heartbeat
pCorresponding author. E-mail: jnarore@upo.es
INTRODUCTION
Heart rate variability (HRV) is a tool that has become widely used in recent years in the field of physical activity and sports [1, 2]. A large body of research has used measures pertaining to the time domain or the frequency domain, but there are much less of those who study heart rate from the perspective of its complex dynamics [3, 4].
The non-linear measures most frequently found in the bibliography related with sports are Detrended Fluctuations Analysis (DFA) and entropy.
DFA allows researchers to quantify long-term correlation properties in non-stationary physiological time series [5–7]. It involves integrating the time series and dividing the new series into segments of equal length,‘n’(defined by the number of beats included in the segment). The tendency for each segment is calculated along with the fluctuation of the tendency for that lengthn:F(n). By repeating the procedure for different segment lengths, the value ofF(n) grows with n, so that it is possible to establish a linear relationship, in a logarithmic scale. The exponent of this scale (the slope of the straight line that best fits the linear relationship in logarithmic scales) is termedaand allows the fractal structure of the series to be characterised.
There are at least two straight lines with different slopes and, therefore, two exponents. The first corresponds to small segment lengths, with few heartbeats and therefore characterises short-term behaviour. The second is associated with larger segment lengths and characterises long-term behaviour. They are labelled, respectively,a1 anda2 [8].
Entropy quantifies the irregularity of a system, therefore the more predictable a series, the lower the entropy value. The first entropy algorithm used with physiological series was the Approximate Entropy (ApEn) [9]. Richman and Moorman [10] described a new algorithm called Sample En- tropy (SampEn) to correct some drawbacks of ApEn. SampEn does not make self-comparisons of vectors, thus reducing bias and therefore it is less dependent on data length. Recently, a new al- gorithm has been proposed for calculating SampEn; it is called Local SampEn [11].
The values of DFAa1 increase during recovery following different types of exercise [12–15], as well as in stimulation tests of the sympathetic system, such as the Head-Up Tilt Test [16].
Furthermore, Tulppo [14] found a decline in the values of DFAa1 following completion of an 8-week training session, which was more intense in the group with a higher training volume. In relation to the intensity of the effort, Hautala et al. [17] found an increase in DFAa1 during an incremental exercise to reach 40% of VO2max, with a linear reduction from 40% until the end of the exercise. However, during constant loads DFAa1 is greater than at rest at low intensity, it is the same as at rest during exercise at moderate intensity and it is lower at high intensity exercise [17, 18].
The acute response of SampEn following the completion of different types of physical tasks entails a decline in its value [12, 13, 15, 16, 19, 20]. Heffernan et al. [21] showed that following a 6-week training programme, baseline SampEn measures increased significantly, returning to initial values following a 4-week period of detraining. A decrease in SampEn has also been reported during the exposure to 3.600 m [22].
However, the existing studies have been carried out in very different situations and with very varied designs; hence we cannot establish a clear relationship between the type and/or magni- tude of the response and the intensity and/or duration of the exercise. On the other hand, some studies suggest that the changes in DFAa1 and SampEn could depend on the duration of RR intervals [23, 24].
Therefore, the purpose of this study was to analyse the acute response of the DFAa1 slope and SampEn during exercise and along the first 30 min of recovery, all during a constant treadmill exercise at three different intensities determined individually from a previous effort test. In this way, it will be possible to correlate the responses of both parameters with exactly measured workloads.
MATERIAL AND METHODS
Participants
A total of 14 men (students of Sports Sciences from our University) took part in this study, all of whom were healthy, physically active (but not athletes) and non-smokers (age 20.93±1.38 years;
weight 75.34±10.07 kg; height 178.04±5.83 cm; VO2max49.33±3.93 ml kg1min1).
Following the general indications of the Task Force [28] for heart rate variability records, all the subjects were asked not to drink alcohol or caffeinated beverages, and to abstain from physical activity during the 24 h prior to each test.
Each subject was given a questionnaire to ensure that they were not receiving treatments or suffering from cardiovascular or any other type of disorder that might alter the state of the autonomic nervous system. All the subjects were informed of the procedure that would be followed, and they gave their written consent to take part in the experiment. The Local Ethics Board approved the study, which followed all the principles expressed in the Declaration of Helsinki.
Study design
The experiment lasted for a total of 2 weeks, with 4 separate sessions with 48–72 h intervals in between, taking place at approximately the same time of day (±2 h) under stable environmental conditions (temperature between 22 and 248C and humidity between 50 and 60%).
At the first session height and weight measurements were taken and an incremental and maximal cardiopulmonary stress test was conducted on an ErgoRun Medical 8 treadmill (Daum Electronic; Furth, Germany) following a step protocol with an initial speed of 7 km/h and a slope€ of 1%, for 3 min, and increases of 1 km/h each minute until exhaustion. The test was carried out using Breezesuite CPX ergospirometric testing equipment (Medical Graphics; St. Paul, Min- nesota, USA) calibrated prior to each measurement. The ventilation data were obtained breath by breath using a differential pressure-based flow meter and the inspiratory and expiratory fractions of O2 and CO2based on a galvanic cell and infrared analyser respectively.
For the purposes of this study, once each test was completed, the position of the ventilatory thresholds (VT1 and VT2) was determined according to the“three phase model”proposed by Skinner and McLellan [25] and using the techniques of ventilatory equivalents proposed by Reinhard et al. [26].
The speed corresponding to each threshold was recorded. Furthermore, VO2maxas well as the Maximal Aerobic Speed (MAS) were determined. The main criteria to determine VO2max was the presence of a‘plateau’in the VO2curve at the end of the test; when this‘plateau’did not exist, a heart rate 95% of theoretical value and a RER (respiratory exchange ratio) up to 1.15 were simultaneously required. MAS were determined as that in which VO2maxwas reached.
At the second session, a time of 20 min was arbitrarily selected to run at VT1 speed, constantly and with no prior warm-up, given the low intensity. At the third session, each subject ran at VT2 speed, constantly for a time established to ensure that the product of intensity per duration was the same as for VT1. In this way we ensured that the external training load (TL) was exactly the same [27]. This test was preceded by a 5 min warm-up at 60% of MAS for each of the subjects.
At the fourth session, a time-to-exhaustion (TTE) test was carried out for Maximal Aerobic Speed (MAS). This speed was achieved gradually over 2 min, with 90 s at 70% of MAS followed by a further 30 s at 80% of MAS.
At each session, training load was calculated as the product of intensity (speed) by volume (time) [27]. By expressing speed in km/h and time in hours, TL is expressed as the distance covered in km.
The order of the sessions was not randomized to avoid the possible effects of the hardest loads on the lightest one in some cases and not in others. Therefore, it was decided to carry out all tests in the same order from least to greatest intensity.
HRV collection
At sessions 2, 3 and 4, a V800 Polar heart rate monitor was fitted onto the subjects, with an H10 HR Sensor thoracic band (Polar Inc., Kempele, Finland) from 8 min prior to the test to 30 min after the test was completed, to record HRV measurements. All the pre and post exercise measurements were taken with the subject in a seated position and in a calm and quiet envi- ronment. Hence, in all the sessions, the subject had to sit down immediately after finishing the test (with no active cool down) in order to measure their recovery.
The RR time series were downloaded using the Polar FlowSync application (version 2.6.2) to be analysed using Kubios HRV software (Version 2.1, University of Eastern Finland, Kuopio, Finland).
At each session, the last 5 min of the rest and exercise records were taken. In the case of the 30-min recovery period, measurements were divided into 5-min slots (rec10, rec15, rec20, rec25, rec30). HRV was not quantified the first 5 min of recovery because of the loss of time series stability derived from the sudden change between the end of the exercise and the start of re- covery [7]. Each record was analysed previously to detect the possible presence of artefacts and anomalous beats [28], applying the correspondingfilters if required.
Two non-linear variables were analysed: the first slope of the DFA, known asa1 [5, 7], and the SampEn proposed by Richman and Moorman [10]. The second slope of the DFA (a2) was not analysed given that it is a long-term correlation measure, and it does not correspond in a short record.
DFA
The method of detrended fluctuation analysis was first proposed by Peng et al. [6], who pre- sented a detailed description of the algorithm and its application to physiologic signals [7].
SampEn
The SampEn is defined as the negative natural average logarithm of the conditional probability that two sequences, which are similar formpoints, remain similar when the number of points is increased tomþ1. Chen et al. [29] describe the calculation algorithm.
Statistical analysis
A descriptive study was carried out; therefore all the data are presented by their average values and standard deviations.
An analysis of variance for repeated measures (two-way ANOVA) was performed to contrast the temporary changes in all measurements at different intensities of exercise. To do this, Box M test was applied to contrast the equality of variances and then, intensity-time contrast tests were performed both multivariate (Pillai trace and Wilks Lambda) and univariate (Mauchly Sphe- ricity and Greenhouse–Geisser). The Games–Howell procedure was used as a post-hoc test.
Subsequently, to obtain more information on the differences in the temporal evolution of the variables, an ANOVA of one factor was performed for the three intensities. To do this, the Kolmogorov–Smirnov test was used to verify the normality of the distributions obtained, and then, the Levene Test was applied to verify equality of variances. The Games–Howell procedure was used again as a post-hoc test.
The effect size between the three intensities was also calculated for all measurements. For this, Cohen’s d was used considering the following ranges for effects: no effect (<0.2); small (0.21–0.49); medium (0.5–0.79) and great (0.8 or higher) [30]. The level of significance was set at P< 0.05. The SPSS programme version 15.0 for Windows (SPSS Inc., Chicago, IL) was used for all calculations.
RESULTS
The VT1 test was conducted at an average velocity of 10.29±1.44 km/h with a duration of 0.33 h. The VT2 test took place at an average velocity of 13.71±0.89 km/h with an average duration of 0.22±0.05 h. Finally, the TTE test was conducted at an average velocity of 16.29±1.1 km/h with an average duration of 0.11±0.03 h.
For DFAa1, both multivariate and univariate contrast tests showed that the three data sets (VT1, VT2 and MAS) were different along the time (P< 0.001), and that there was a strong interaction between the time evolution and the intensity of exercise (P< 0.001).
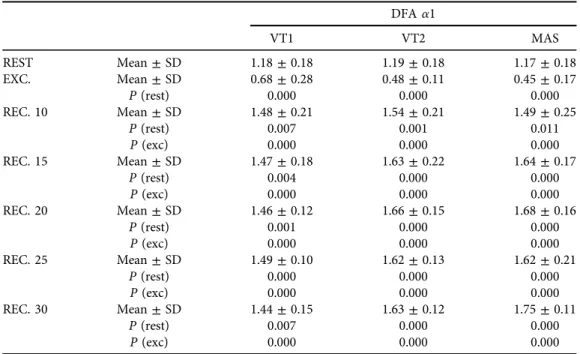
Table 1shows the values of DFAa1 measured at rest, during the last 5 min of exercise and over the course of recovery. The p values are given, comparing each situation with the rest and the values of recovery with those of rest and exercise.
There were no significant differences in the rest values of DFA a1.
Compared to the rest values at different intensities, a significant decline was observed in DFAa1 (P< 0.0001) during exercise. Throughout the entire period of recovery measured, at all three levels of intensity, the values of DFA a1 increased showing significant differences with both rest and exercise. Data reveal differences between VT1 and the other two intensities after 15 min of recovery, just as during exercise (Fig. 1).
The drop in DFA a1 observed during exercise was lower for VT1 than for the other two intensities (P< 0.01). Likewise, the increase observed during recovery was also lower for VT1 than for the other two situations (P< 0.05). In all cases, the effect size was large with Cohen dvalues greater than 0.8 (Table 2).
Concerning SampEn, both multivariate and univariate contrast tests showed again that the three data sets (VT1, VT2 and MAS) were different a long time (P< 0.001) and that there was a strong interaction between the time evolution and the intensity of exercise (P< 0.001).Table 3
Fig. 1.Evolution of DFAa1 slope values in the 3 tests. VT1 (first ventilatory threshold); VT2 (second ventilatory threshold); MAS (maximal aerobic speed); Exc: exercise; Rec: recovery. The differences observed between the three intensities are indicated in each of the measurements: NS: Non-significant; (*)P< 0.05;
(**)P< 0.01; (***)P< 0.001
Table 1.Values of DFAa1 measured at rest, in the last 5’of exercise and throughout the recovery.Pvalues compare each situation with the rest and the values of recovery with those of rest and exercise
DFAa1
VT1 VT2 MAS
REST Mean±SD 1.18±0.18 1.19±0.18 1.17±0.18
EXC. Mean±SD 0.68±0.28 0.48±0.11 0.45±0.17
P(rest) 0.000 0.000 0.000
REC. 10 Mean±SD 1.48±0.21 1.54±0.21 1.49±0.25
P(rest) 0.007 0.001 0.011
P(exc) 0.000 0.000 0.000
REC. 15 Mean±SD 1.47±0.18 1.63±0.22 1.64±0.17
P(rest) 0.004 0.000 0.000
P(exc) 0.000 0.000 0.000
REC. 20 Mean±SD 1.46±0.12 1.66±0.15 1.68±0.16
P(rest) 0.001 0.000 0.000
P(exc) 0.000 0.000 0.000
REC. 25 Mean±SD 1.49±0.10 1.62±0.13 1.62±0.21
P(rest) 0.000 0.000 0.000
P(exc) 0.000 0.000 0.000
REC. 30 Mean±SD 1.44±0.15 1.63±0.12 1.75±0.11
P(rest) 0.007 0.000 0.000
P(exc) 0.000 0.000 0.000
Notes: Exc, exercise; Rec, recovery; VT1,first ventilatory threshold; VT2, second ventilatory threshold;
MAS, maximal aerobic speed.
Table 2.Values of effect size (d) between VT1, VT2 and MAS fora1 and SampEn at rest, in the last 5’of exercise and throughout the recovery. Ranges: no effect (<0.2); small (0.21–0.49); medium (0.5–0.79) and
large (0.8 or higher) Effect size (dCohen)
Alpha 1 SampEn
VT1/VT2 VT1/MAS VT2/MAS VT1/VT2 VT1/MAS VT2/MAS
REST 0.04 0.09 0.13 0.00 0.28 0.24
EXC 1.00 1.02 0.26 0.21 1.82 1.92
REC 10 0.29 0.01 0.25 0.72 0.26 0.39
REC 15 0.83 0.99 0.05 0.81 0.54 0.22
REC 20 1.49 1.56 0.14 1.37 1.02 0.12
REC 25 1.15 0.81 0.05 1.21 1.58 0.46
REC 30 1.42 2.36 1.00 1.48 2.31 0.76
Notes: SampEn, Sample Entropy; Exc, exercise; Rec, recovery; VT1,first ventilatory threshold; VT2, second ventilatory threshold; MAS, maximal aerobic speed.
Table 3.Values of SampEn measured at rest, in the last 5’of exercise and throughout the recovery.Pvalues compare each situation with the rest and the values of recovery with those of rest and exercise
SampEn
VT1 VT2 MAS
REST Mean±SD 1.53±0.21 1.53±0.31 1.44±0.38
EXC. Mean±SD 1.78±0.48 1.89±0.55 1.04±0.34
P(rest) 0.588 0.394 0.082
REC. 10 Mean±SD 1.02±0.24 0.82±0.31 0.94±0.32
P(rest) 0.000 0.000 0.015
P(exc) 0.001 0.000 0.988
REC. 15 Mean±SD 1.03±0.21 0.86±0.21 0.91±0.24
P(rest) 0.000 0.000 0.003
P(exc) 0.001 0.000 0.898
REC. 20 Mean±SD 1.10±0.19 0.84±0.19 0.86±0.27
P(rest) 0.000 0.000 0.002
P(exc) 0.003 0.000 0.747
REC. 25 Mean±SD 1.16±0.21 0.89±0.24 0.77±0.28
P(rest) 0.002 0.000 0.000
P(exc) 0.008 0.000 0.306
REC. 30 Mean±SD 1.14±0.17 0.87±0.20 0.72±0.20
P(rest) 0.000 0.000 0.000
P(exc) 0.006 0.000 0.075
Notes: SampEn, Sample Entropy; Exc, exercise; Rec, recovery; VT1,first ventilatory threshold; VT2, second ventilatory threshold; MAS, maximal aerobic speed.
The bold value signifies the values with large effect (d> 0.8).
shows that there were no significant differences between rest and exercise at any of the three intensity levels.
However,Fig. 2shows a difference: exercise SampEn values at VT1 and VT2 were equal and not different from rest, but exercise SampEn at MAS was significantly lower than those at VT1 and VT2 (P< 0.001) and its difference with rest SampEn was not significant (P 5 0.08) but effect size was very large (d 51.12).
At VT1 and VT2 intensities, there were significant differences throughout recovery, both with rest and with exercise. At MAS intensity (TTE test), there were significant differences between all recovery values and rest, but not with exercise.Fig. 2 shows that there was a sig- nificant difference in exercise between MAS and the other two intensities. However, after 20 min of recovery, VT1 displays significant differences from the other two intensities.
DISCUSSION
The main findings of this study are that: (i) exercise produces a loss of correlation properties (DFAa1) in heart-beat, the magnitude of which depends on the intensity of effort; and (ii) heart beat complexity (SampEn) falls after exercise and its values are still low after 30 min of recovery, although the lower the intensity of the exercise, the faster the recovery.
In relation with changes in DFA, thea1 slope presents a substantial decline with exercise, which depends on the intensity of exercise (Fig. 1). During recovery, a very significant rise is observed in thefirst 10 min, up to higher values than at rest, which is the same for all three intensities. From that point onwards, the evolution differs depending on intensity. At VT1, it stabilises until after 30 min have passed, whereas at greater intensities (VT2 and MAS) it continues to rise. These results coincide with the findings of Millar et al. [12], who report a similar behaviour in the value of DFAa1 after completion of one (a151.14) or four Wingate Fig. 2.Evolution of SampEn values in the 3 tests. VT1 (first ventilatory threshold); VT2 (second ventilatory threshold); MAS (maximal aerobic speed); Exc: exercise; Rec: recovery. The differences observed between the three intensities are indicated in each of the measurements: NS: Non-significant; (*)P< 0.05; (**)P<
0.01; (***)P< 0.001
tests (a1 51.32), taking into account that their subjects begin with a DFA a1 value of 0.85.
Equally, Perkins et al. [13] also found higher values of DFAa1 than the‘at rest’values following completion of 2 different types of exercises (HIT and resistance), always with higher values in HIT (a151.5) compared with resistance training (a151.37). However, these changes are not statistically significant in their study, with subjects starting with a DFAa1 value of 1.25.
Tulppo et al. [16], on the contrary, found that DFAa1 values increased from 1 to 1.37 when carrying out low intensity activities (walking at 4 km/h for 30 min). These authors report that this change in DFAa1 is the same as observed in a Head-Up Tilt Test when a tilt of 608is reached. The same authors reported in a subsequent study [14] that DFAa1 values decreased after 8 weeks of training, with greater descents observed at higher training volumes. However, these measurements were taken at different times of day and not as a direct response following exercise. Hautala et al. [17] reported a drop in DFA a1 similar to ours at the end of an in- cremental exercise. They also reported that DFAa1 increased to values close to 1.4 after an atropine infusion. Casties et al. [18] described a fall in DFAa1 in 7 cyclists during exercise at 90% intensity, and a subsequent rise in values during recovery (50 min), although without significantly exceeding resting values. Platisa et al. [23] report a similar response in both young and healthy subjects and in older subjects during an incremental exercise and after 15 min of recovery. In all cases, these authorsfind a correlation between DFA values and RR intervals [23, 24].
Therefore, our DFAa1 data (Table 1) are fairly coherent with the studies published about this variable in relation to exercise, and it seems to be confirmed that this variable increases following exercise, proportionally to the intensity thereof [12, 13].
However, our data show two aspects different from the rest of the bibliography. One is that the increase in DFA observed at the beginning of recovery is virtually identical for all intensities (Table 1;Fig. 1). The other is that the values reached throughout the recovery are significantly higher than those at rest.
A recent review about DFA changes with exercise [3] makes it clear that this decrease in DFA a1 to values around 0.5 is a common response. In this sense, the authors compile an explanation for this behaviour in the context of an Exercise Physiology based on complex models, consid- ering that the nonlinearfluctuations of the heartbeat would be the result of complex dynamic relationships between humoural, haemodynamic and electrophysiological variables.
Concerning the behaviour of DFA during recovery, Perkins et al. [13] note the possibility that it is a positive effect of exercise on the fractal and complex dynamics of cardiac output.
However, the values attained in this study, and in other previous ones, are within the limits of what would correspond to a series with a strong tendency towards periodicity (a1≥1.5) and, therefore, with high correlation values [7].
Since this effect has also been observed during parasympathetic suppression by atropine infusion [17], the most reasonable explanation for this apparent tendency to periodicity would be the effect of sympathetic influence, parasympathetic inhibition or both. In short, an auto- nomic imbalance is in favour of the sympathetic. Since the magnitude of this effect is greater with high exercise intensity, we think that it could be used as an indicator of the impact that a specific load can have on a subject.
This increase in DFA a1 observed during recovery indicates an increase in the correlation properties between the data, which would indicate greater periodicity in the output, which is coherent with the information provided by entropy, as seen below.
In the case of SampEn, we observe different behaviours depending on the exercise (Fig. 2).
Firstly, at VT1 and VT2 intensities, the value of exercise SampEn is maintained (there is an increase that does not present significant differences), whereas at MAS it falls during exercise.
This decline is highly significant with regard to the exercise values at VT1 and VT2 (P< 0.001) but it is not significant regarding the‘at rest’value (P50.08) (Table 3), although the effect size was very large (d51.12). At the start of recovery (10 min), the value at MAS is maintained, and the values at VT1 and VT2 decline to the same level. In other words, the three types of exercise have provoked the same decline in SampEn, with the difference that exercise at the highest intensity (MAS) tends to reduce it during exercise itself, whereas at lower intensities, the decline is delayed, occurring after 10 min of recovery. After that, SampEn at VT1 gradually recovers so that, after minute 20, it is clearly different from the other two intensities (P< 0.01) and with very large effect size (Table 2). However, in the case of VT2 and MAS, the values of SampEn remain stable during the recovery period.
Our recovery results coincide with the findings of various authors [12, 13, 20], who report post-exercise entropies that are significantly lower than the‘at rest’ values, even following ex- ercise [19]. As far as we know, no previous study has measured entropies during exercise, with the exception of Tulppo et al. [16] who measured approximate entropy (ApEn) and found that it rose during gentle exercise (walking at 4 km/h for 30 min) and Platisa et al. [24] who reported that SampEn did not change from rest to the end of an incremental exercise both in trained and untrained subjects.
The SampEn values measured at rest in our subjects are similar to those reported by Platisa et al. [24], but they are below the values previously reported for athletic popu- lation [31].
Exercise induces a loss of cardiac complexity, highlighted by a decline in SampEn values observed during the period of immediate recovery. However, in our data, as in those found in previous papers [12, 13, 16, 20], SampEn does not even come closer to the value of 0.5, which would indicate that a series has been carried out with abnormal periodicity [10, 32]. This means that, although there is a loss in complexity and, therefore, in the tendency towards periodicity of the signal, it remains within the range of values accepted as normal. These values begin to recover somewhat more rapidly in low intensity exercise (Fig. 2), but in no case is complete recovery achieved in thefirst 30 min.
Although our data measured during exercise do not present any significant variations regarding to the‘at rest’data, it is obvious that the values obtained are clearly different from one another depending on intensity.
In conclusion, physical exercise induces not only a loss of heartbeat complexity, but also a stronger fractal correlation, which depends on the intensity of that exercise. This loss of complexity is clearly appreciable during the period of immediate recovery and translates into a decline in SampEn and an increase in the DFAa1 slope. After 30 min of recovery, neither of the two variables returned to its initial values at any of the intensities explored. The SampEn and DFAa1 values measured during exercise allow differentiating the intensity of the exercise: (i) the fall in DFA is lower at lower intensities; (ii) SampEn falls during exercise at high intensities and does not change at medium or low intensities.
Conflict of interest:The authors reported no potential conflict of interest.
REFERENCES
1. Orri JC, Hughes EM, Mistry DG, Scala A. Assessment of heart rate variability after maximal exercise in trained postmenopausal women. Physiol Res 2018; 67: 703–9.
2. Rave G, Fortrat JO, Dawson B, Carre F, Dupont G, Saeidi A, et al. Heart rate recovery and heart rate variability: use and relevance in European professional soccer. Int J Perform Anal Sport 2018; 18: 168–83.
3. Gronwald T, Hoos O. Correlation properties of heart rate variability during endurance exercise: a systematic review. Ann Noninvasive Electrocardiol 2020; 25: e12697.https://doi.org/10.1111/anec.12697.
4. Shaffer F, Ginsberg JP. An overview of heart rate variability metrics and norms. Front Public Health 2017; 5:
1–17.
5. Kantelhardt JW, Zschiegner SA, Koscielny-Bunde E, Havlin S, Bunde A, Stanley HE. Multifractal detrended fluctuation analysis of nonstationary time series. Physica A 2002; 316: 87–114.
6. Peng CK, Buldyred SV, Havlin S, Simons M, Stanley HE, Goldberger AL. Mosaic organization of DNA nucleotides. Phys Rev E 1994; 49: 1685–9.
7. Peng CK, Havlin S, Stanley HE, Goldberger AL. Quantification of scaling exponents and crossover phe- nomena in nonstationary heartbeat time series. Chaos 1995; 5: 82–7.
8. Goldberger AL, Amaral LAN, Glass L, Hausdorff JM, Ivanov PCH, Mark RG, et al. Components of a new research resource for complex physiologic signals. Circulation 2000; 101: e215–20. [Circulation Electronic Pages;http://circ.ahajournals.org/content/101/23/e215.full].
9. Pincus SM. Approximate entropy as a measure of system complexity. Proc Natl Acad Sci 1991; 88: 2297–301.
10. Richman JS, Moorman JR. Physiological time-series analysis using approximate entropy and sample entropy.
Am J Physiol Circ Physiol 2000; 278: H2039–49.
11. Porta A, Bari V, De Maria B, Cairo B, Vaini E, Malacarne M, et al. On the relevance of computing a local version of sample entropy in cardiovascular control analysis. IEEE Trans Biomed Eng 2019; 66(3):623–31.
12. Millar PJ, Rakobowchuk M, Mccartney N, Macdonald MJ. Heart rate variability and nonlinear analysis of heart rate dynamics following single and multiple Wingate bouts. Appl Physiol Nutr Metab 2009; 34: 875–83.
13. Perkins SE, Jelinek HF, Al-Aubaidy HA, De Jong B. Immediate and long term effects of endurance and high intensity interval exercise on linear and nonlinear heart rate variability. J Sci Med Sport 2017; 20: 312–6.
14. Tulppo MP, Hughson RL, M€akikallio TH, Airaksinen KEJ, Sepp€anen T, Huikuri HV. Effects of exercise and passive head-up tilt on fractal and complexity properties of heart rate dynamics. Am J Physiol Circ Physiol 2001; 280: H1081–7.
15. Tulppo MP, Kiviniemi AM, Hautala AJ, Kallio M, Sepp€anen T, M€akikallio TH, et al. Physiological back- ground of the loss of fractal heart rate dynamics. Circulation 2005; 112: 314–9.
16. Tulppo MP, Hautala AJ, M€akikallio TH, Laukkanen RT, Nissil€a S, Hughson RL, et al. Effects of aerobic training on heart rate dynamics in sedentary subjects. J Appl Physiol 2003; 95: 364–72.
17. Hautala AJ, M€akikallio TH, Sepp€anen T, Huikuri HV, Tulppo MP. Short-term correlation properties of R-R interval dynamics at different exercise intensity levels. Clin Physiol Funct Imaging 2003; 23: 215–23.
18. Casties F, Mottet D, Le Gallais D. Non-Linear analyses of heart rate variability during heavy exercise and recovery in cyclists. Int J Sports Med 2006; 27: 780–5.
19. Heffernan KS, Sosnoff JJ, Jae SY, Gates GJ, Fernhall B. Acute resistance exercise reduces heart rate complexity and increases QTc interval. Int J Sports Med 2008; 29: 289–93.
20. Javorka M,Zila I, Balh arek T, Javorka K. Heart rate recovery after exercise: Relations to heart rate variability and coplexity. Braz J Med Biol Res 2002; 35: 991–1000.
21. Heffernan KS, Fahs CA, Shinsako KK, Jae SY, Fernhall B. Heart rate recovery and heart rate complexity following resistance exercise training and detraining in young men. Am J Physiol Circ Physiol 2007; 293:
H3180–6.
22. Zhang D, She J, Yang J, Yu M. Linear and nonlinear dynamics of heart rate variability in the process of exposure to 3600 m in 10 min. Australas Phys Eng Sci Med 2015; 38: 263–70.
23. Platisa MM, Gal V. Correlation properties of heartbeat dynamics. Eur Biophys J 2008; 37: 1247–52.
24. Platisa MM, Mazic S, Nestorovic Z, Gal V. Complexity of heartbeat interval series in young healthy trained and untrained men. Physiol Meas 2008; 29: 439–50.
25. Skinner JS, Mclellan TH. The transition from aerobic to anaerobic metabolism. Res Q Exerc Sport 1980; 51:
234–48.
26. Reinhard U, M€uller PH, Schm€ulling RM. Determination of anaerobic threshold by the ventilation equivalent in normal individuals. Respiration 1979; 38: 36–42.
27. Halson SL. Monitoring training load to understand fatigue in athletes. Sports Med 2014; 44: 139–47.
28. Task Force of the European Society of Cardiology and the North American Society of Pacing and Electro- physiology. Heart rate variability: standards of measurement, physiological interpretation, and clinical use.
Eur Heart J 1996; 17: 354–81.
29. Chen W, Zhuang J, Yu W, Wang Z. Measuring complexity using FuzzyEn, ApEn, and SampEn. Med Eng Phys 2009; 31: 61–8.
30. Cohen J. Statistical power analysis for the behavioral sciences. 2nd ed. Mahwah, NJ: Erlbaum Associates; 1998.
31. Naranjo J, De La Cruz B, Sarabia E, De Hoyo M, Dominguez-Cobo S. Heart rate variability: a follow-up in elite soccer players throughout the season. Int J Sports Med 2015; 36: 881–6.
32. Costa M, Goldberger AL, Peng CK. Multiscale entropy analysis of complex physiologic time series. Phys Rev Lett 2002; 89: 1–4.