Regional Export Efficiency in the Market of Football Players
KRISZTINA ANDRÁS, Ph.D. ZSOLT HAVRAN
A
SSOCIATEP
ROFESSORP
HD
STUDENTe-mail:krisztina.andras@uni-corvinus.hu e-mail: zsolt.havran@uni-corvinus.hu
SUMMARY
The aim of this paper is to interpret and examine the exportefficiency of professional football clubs in the Central Eastern European (CEE) regionwithin the international players’ market. Some clubs in these countries realize higher and higher revenues from transfer activity, which can be interpreted as export of football clubs. The study investigates correlations between sport success and transfer revenues. CEE clubs produce nearly 100 million EUR profit annually, but there are huge differences between countries and clubs. Championships are also divided: those clubs participating in international tournaments have a powerful advantage compared to the other clubs.
Keywords: Global sport; professional football; transfer market; export; Central Eastern European region Journal of Economic Literature (JEL) code: L83, R11
I NTRODUCTION , R ESEARCH QUESTION
The aim of the paper is to interpret and examine the exportefficiency of the CEE region professional football clubs in the international players‟ market. Export efficiency means the ratio of total revenue on transfer market compared to the size of country and GDP. Professional football players in the Top Leagues (England, Spain, Germany, France, Italy)or in Western Europe are a commonly discussed topic in relevant literature but there are very few articles about football in Eastern Europe. However, many players from CEE countries play in Top Leagues or in Western Europe.
FIFPro (International Federation of Professional Footballers) Black Book Eastern Europe (2012) examines the problems of professional footballers in Central Europe and Eastern Europe. Among other things, the study determines that of “the 3,357 professional footballers who cooperated in this study, 41.4% do not have their salaries paid on time. 5.5% of all players have to wait more than 6 months to receive their salary” (p. 5.. Furthermore 15.6% of players has been forced to train alone because the club wanted to end the contract or players did not agree to sign a new contract with the club. It is also a serious problem that
“11.9% of respondents are saying that they had been approached with the idea of fixing the result of a match and more than twice of them (23.6%) are also aware of match fixing that took place in their league” (p. 10.)To conclude:
the market of football players is a very complex one where processes are often blurry and data reliability is low.
However, it is known that exporting players is an escape route both for the clubs and the footballers. In the past few years clubs in the region have become more successful; they are participating more often in international tournaments and
as a result the export of players has increased as well.
Naturally there is a mutual connection between the two phenomena, since the better a club performs internationally the more visibility the players get, and the more players it can export the higher the revenues are. In the same way higher revenues provide the opportunity to build better teams and improve youthtraining systems, which enables the clubs again to further develop.
Our main goal was to measure the export performance of football clubs. The performance can be evaluated from both a professional and financial point of view, therefore we collected data of the international achievements of the discussed leagues from the past 5-10 years and we tried to quantify the financial performance as well. Central-Eastern Europe is our research area, hence we were evaluating the whole region and the differences among countries both on the level of clubs and leagues.
We examined nine countries from Central-Eastern Europe: Bulgaria, Croatia, the Czech Republic, Hungary, Poland, Romania, Serbia, Slovakia and Slovenia. Common characteristics of them are the followings: post-socialistic history (similar tradition, economy, culture, external environment) and EUmembership or candidate membersof the EU (Serbia).
The main business revenues of the football companies are the following: ticket and season-ticket revenues (consumer market), revenues on player transfers (players‟
market), revenues generated from broadcasting rights (broadcasting rights market), and revenues from commercial rights: sponsorship revenues (sponsorship market) and merchandising revenues (merchandising market). This paper mainly concentrates on the players‟ market, but naturally the changes in the players‟ market have an impact on any other market. For example the number of stars in a team can increase the interest of media companies. On one hand, stars enhance the consumer‟s identification and strengthen fan
loyalty, and on the other hand, stars are the product of the media and play an important role in its businesses (more media attention leads to consumer, more sponsor and related revenues)(András 2003).
It is a specialty of the region that a lot of publicly available financial data cannot be accepted unconditionally, since the operations of companies and sport organizations are not completely transparent. The reported revenues connected to football are either close to zero or they lack credibility. Of the five markets it is the players‟ market where the transactions are more traceable, which is one of the reasons why we chose it for examination. The data was gathered from the internationally acknowledged website transfermarkt.de. Our presumption that transfers with higher amount mean international transactions became verified after collecting data, as the financial value of national transfers was very low.
In this paper firstly we aim to present the related literature (sport, players‟ market, export, etc.) and the available data on the CEE region that can be found in various publications. Secondly, we evaluate the professional performance of CEE leagues and clubs and thirdly, we examine the exportefficiency of football players.In the international sport management literature we have no found former investigations with a focus on CEEfootball. The research could be of practical use for CEEclubs (strategy- making, transfers, youth sport) and for National Associations (support of clubs, regulation of players‟
market, etc.).
The hypotheses of the paper:
H1: The CEE region has a weak efficiency in European Football (sport and financial failure)
H2: There is a large difference among the clubs of the CEE region (in terms of both sport and financial results)
H3: There are few clubs in some countries which are very effective (sport success and transfer revenues)
L ITERATURE REVIEW
To investigate the transfer market of CEE region we have to describe the main points and markets of professional football, internationalization of sport business and characteristics of the players‟ market.
Interpretation of business globalization and professional sport
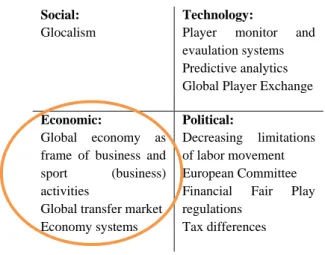
Strategies of leading companies in different competitive industries are very often characterized by the ability to adapt fast to changed circumstances. Survival of the fittest is a mechanism not just in evolution, but also in those professional sports where sport companies are service providers in the competitive show business. It is important to think through what factors drive the operations of these companies nowadays. Using STEP (Social-Technology- Economic-Political) analysis, it has been concluded that the three biggest challenges from the economic point of view (András, 2011) are: (1) the global economy as the framework of the (sport) business (Chikán, 2010), (2) the economic recession (industry-level crisis, nation-state and regionalist constraints), and (3) the changing economic systems (Czakó, 2012).
Social:
Glocalism
Technology:
Player monitor and evaulation systems Predictive analytics Global Player Exchange Economic:
Global economy as frame of business and sport (business) activities
Global transfer market Economy systems
Political:
Decreasing limitations of labor movement European Committee Financial Fair Play regulations
Tax differences
Figure 1. STEP analysis on market of professional sportmen; Source: András & Havran (2014) The connection between professional sport and globalization is not a new topic. Defining globalization from business perspective based on Chikán (2008), leaders of professional sport companies in decision-making situations take into consideration opportunities from all over the world.
Though today these decisions are most likely to remain between the borders of Europe, we will not need to wait long to see those borders enlarge, taking for instance the changed roles of Japan and the USA in the industry. These countries founded theirs own system of soccerleagues without any former traditions.
As Chikán (2008) defines economical globalisation from the business perspective, it is the decision makers who are in the center, since whether the decision is about their input or output markets they are evaluating their opportunities on a global level. Similarly, the markets of professional sport are global, too (András, 2004), although to different extents (Andráset al., 2012).
What is a global sport?
There are several sports mentioned as global sports both in Hungarian and international literature. What made these sports (football, basketball, hockey and Formula 1) global is typically their popularity and their compatibility with the media. It is worth mapping those factors which enable a sport to become global. A few of these can be traced back to the immanent characteristics of a sport, to its historical background. During the emergence of modern sport, geographical expansion and establishing monopolistic structures and international alliances to coordinate the unification of the rules of different sports were very important milestones. Business globalisation aims for standardization (Demeter, 2010), which is also an important element in sports, realized in the form of unified game rules.
Another enabling factor is the existence of popular international events, tournaments which by generating broadcasts make the market of media consumption global, hence these events can be followed all over the world. The tournaments of professional football (both on club and national levels), thanks to their geographical spread, offer access to regional and global markets.
Table 1
Competitions of professional football according to geographical expansivity
National Regional Global
National teams
European Championship
qualifications and final
World Cup qualifications
and final
Clubs
national championships,
cups
Champions League and European
League
FIFA Inter Club World
Cup
Source: elaborated by the authors
Nowadays the Internet offers many more new opportunities. Companies with a clear marketing agenda can reach markets of larger geographical extent. Based on Chikán (2003), András (2004) interprets the sponsorship on local, area, national, regional and global level in regards of the market of sponsors. The globality of the players‟ market is well known. Even in the previous closed economical systems international transfers were not rare at all and today nationalization of players is becoming more and more common. Different collaborations (from simple contracts to foreign investments) between sport companies are now part of the everyday routine of professional sport (András
&Jandó, 2012).
The global transfer market
Due to the media, media capability and international competitions, professional football is clearly a global sport.
The players‟ market is a special labour market, where basically a personal right with special value of property is the subject of the agreement: the disposition about the playing licence for a given period (maximum 5 years in the EU) (András, 2003).
This right with value of property is very closely linked to the person of the player and includes all his abilities, both physical and mental, related to his sporting activities.
Therefore, it is not transferable or vendible, but like a licenceagreement, the disposition of the playing licence is transferable. After the conclusion of the contract, the right of disposition falls back to the athlete. During the term of a contract, the football company can transfer the right of disposition to another football company in exchange for compensation (called a transfer fee). The ownership of his own playing right provides the player with an additional revenue force to his salary, which is the signing bonus.
Nowadays, at the time of transferring the disposal of his playing licence to the football company of his club, the player transfers the right of using his image rights (i.e. in merchandising) – typically for extra compensation – as well.
Questions concerning insurance form an important part of player contracts, as injuries and accidents can cause severe losses to both parties (András, 2003).
A summary of the main characteristics of the players‟
market (András, 2004) can be seen in Table 2.
Table 2
Main characteristics of the players’ market;
Source: András (2003)
The transfer of a player is a double transaction from the point of view of the buying club: it means labour force recruitment and also an investment in a value of property (intangible assets).
Further specifics of the players‟ market (András et.al, 2000) are:
- Time-limited market (open twice a year) - The longevity of a professional football career is limited (15-20 years without injury)
- Stars are hardly substitutable; an exceptional labor force
- During the span of a running contract, there is a fee to be paid in the case the player wants to leave
- Special working times (weekends) - Fixed-term contracts (maximum 5 years
in the EU).
There is a labor contract between players and sports organisation in compliance with the regulations of FIFA (Fédération Internationale de Football Association –the international football association) and UEFA (the Union of European Football Associations). The player market movement of a player with a valid contract between two sports organizations is called a transfer. In most of the cases1, the signing football company pays a transfer fee as compensation to the releasing one.The appearance of the transfer fee - one of the specialities of the market – can be explained by two reasons. First, clubs (typically still operating as social clubs) focusing on player development can be compensated by it. Secondly, even bigger sports companies can consider the trade of players as a lucrative investment due to the transfer fees. That draws attention to another speciality: signing a player is not only the recruitment of a member of the labor force, but it can take the form of a serious investment decision.
The framework of globalism influences professional football, too, hence the sport companies behind the clubs can be characterized as organizations operating in international environment (Czakó, 2010). Media broadcasts and the professional system of tournaments and championships are also signs of an international characteristic. Their leaders have to coordinate operations in many countries.
András (et. al. 2000) categorized countries on the basis of their role on the European players market of football. The transfer balance (the difference of transfer revenues and transfer expenditures) and the transfer volume are the dimensions of the categorization.This shows the importance of the clubs of the given country on the international players market. The transfer volume was calculated as the average of the gross transfer revenues and transfer costs. If the transfer has a positive balance, then the given country is a net seller, while in case of a negative transfer balance, the country plays a net buyer role. Figure 2 shows the results of their research.
Negative balance Positive balance
High volume
“Purchasers”
England, Spain, Germany Italy Russia
“Traders”
Portugal, Netherland France
Low volume “Small customers”
Turkey, Ukraine, Greece
“Suppliers”
Scandinavians, post-socialist countries Figure 2. “International ways” of soccer players:
categorization of countries in the European transfer market, Source: Szabados, 2012
A higher quality game presumes higher transfer volumes. The top countries in terms of sporting results and economic strength of their clubs can choose from the broadest range of talented players. Their activity on the players‟ market confirms that. The connection can be interpreted in the opposite way, too: a country with high
1 Except for cases where the contract between player and sports organisation includes a clause that the club renounces any transfer fees.
transfer volume has presumably a high quality football game.
The investigation of the question of whether there are trends in player movements between countries on the players‟ market of football, presents interesting results.
András et al. (2000) investigated three countries in detail:
Italy, England and Germany. Nowadays we see Spain and Russia as “Purchasers”. The leagues of CEEregion have a relatively small value in the transfer market but the balance is mainly positive.
Some research (for example Rothenbuecher et al., 2010 p.4.) shows a positive relationship between net transfer balance and team performances. In leagues where clubs spent more money for new players, clubs can achieve better on-field performance. The number of players with outstanding abilities (who can influence the outcome of match) is limited and players are limited resources of football clubs.
A UEFA studyshows astrong correlation between sport success (UEFAranking of clubs) and revenues (UEFA, 2008 p. 49.). Another UEFA study (2009, p. 74.) shows a similar correlation between sport success (rank in national league) and expenditure on personnel. There is a huge difference between clubs of top leagues and we can conclude that to reach a better sport result, clubs need to invest much more in wage costs.
Based on the above-mentioned reasons we can conclude that for CEE clubs it is worth focusing on youthtraining systems. In addition to ensuring their own success, there is also the effect of increased revenues. Thanks to international performance their players can get visibility and they can realize huge profits on transfers.
M ETHODOLOGY
In the first part of the research we describe the relevant parts of published studies about sport success and financial results of leagues and clubs of the examined region. In the second part of this chapter we present the results of our own research. To prepare the first part we used data from uefa.com and the studies of relevant organizations shown inTable 3.
Table 3
Summary of examined studies
UEFA CIES Football
Observatory KEA-CDES
Club Licensing Benchmarking Report Financial Year 2008, 2009, 2010, 2011, 2012
Annual Review of the European
football players‟ labour market 2011 and
2012 - extract
The Economic and Legal Aspects of Transfers of Players 2013
Bechmarking Report on the clubs qualified and licensed to compete
in the UEFA competition season
2013/14
Demographic Study 2013 and 2014 -
extract
Source: elaborated by the authors
In the second part of our investigation we carried out primary research about the transfer results of CEE clubs.
The research used data of the reliable statistical source transfermarkt.de and we followed realized transfers on uefa.com. One limitation of the research that Transfermarkt.de gives only estimations (because almost every transfer is a business secret), but there is no other reliable and public database and Transfermarkt.de uses similar methods so data are comparable. We collected data about transfers (number of transfers, amount of revenue, expenditures, profit/loss) by leagues and clubs from
2009/2010 to 2013/2014. We summarized the sport success of clubs using data from uefa.com.
R ESULTS AND DISCUSSION
First of all we could looked at the sport success of CentralEasternEuropean clubs in international championships. Table 4 shows the UEFA rankings (Weighted calculation from results of clubs in EL and CL in last 5 years.
)
of CEEleagues (uefa.com)Table 4
UEFA rankings of CEE leagues
UEFA
ranking 19 20 21 22 25 27 28 29 34
League Czech Poland Croatia Romania Slovakia Serbia Bulgaria Hungary Slovenia Source: uefa.com
The league of theCzech Republic has the best position in the region, and the Polish, the Croatian and the Romanian leagues are close to it. Four countries have a slightly weaker position and Slovenia has the worst place in this ranking.
This ranking is important because the clubs of the countries which are in better place can start EL or CL in better position.
From all 9 examined countries 4 clubs each can participate in the two international cups of UEFA (UEFA2013, p 11) from different qualification levels. In the Champions League (CL) all of them start from the second qualifying round (eufa.com), while in the European League (EL) the Czech cup winner has its first match in the third
round, all other clubs start from the first or second round.
What‟s more, some clubs can join the European League from Champions League qualification (uefa.com).
Table 5 shows how many clubs of the region made it to the group stage and the best 16 in UEFA cups (CL, EL) in the last 10 years. 342 clubs in the region participated within 10 years and only 26.9% of them got into the group stage.
Altogether 8 clubs were able to remain among the best 16 teams, which is slightly more than 2% of the participants.
Romanian and Czech clubs outperform the others in the CEE region, since around half of them qualify for the group
stage in some international league.
Table 5
Sport efficiency of clubs (2010–2014) - 1
League Total Group Stage
Group
stage % Best 16 Best 16%
Romanian 48 25 52.08% 4 8.33%
Czech 41 19 46.34% 2 4.88%
Croatian 35 10 28.57% 0 0.00%
Serbian 38 10 26.32% 1 2.63%
Bulgarian 39 9 23.08% 1 2.56%
Polish 38 8 21.05% 0 0.00%
Hungarian 34 5 14.71% 0 0.00%
Slovakian 34 4 11.76% 0 0.00%
Slovenian 35 2 5.71% 0 0.00%
Total CEE: 342 92 26.90% 8 2.34%
Source: elaborated by the authors using data from UEFA (2013), p. 13 .
From any of the Top 5, or from the Portuguese (39 out of 59 teams) or Russian (31 out of 48 teams) championships more clubs got into the best 16 (in CL or EL) in the last 10
years than from the CEE championships altogether. See Table 5.
Figures 3and 4 show the international performance of CEE countries in the last 5 years (2010-2014).
Figures 3. and 4. Sport efficiency of clubs (2010–2014) - 2 Source: elaborated by the authors with data from uefa.com The figuressum up the CL and EL participants at the
group stage, while Table 6 shows which clubs got into the best 32 and best 16 in the European League.
Table 6
Sport soccess of CEE clubs in the European League from 2010 to 2014 after Group Stage
European League Best 32 Best 16
2014
Ludogorec Razgrad, Viktoria
Plzeň, NK Maribor, Slovan
Liberec
Ludogorec Razgrad, Viktoria
Plzeň
2013
Viktoria Plzeň, Steaua București,
BATE Bariszav, CFR Cluj, Sparta
Praha
Viktoria Plzeň, Steaua București
2012
Steaua București, Viktoria Plzeň, Wisła Kraków, Legia Warszawa
-
2011 Sparta Praha, Lech Poznań
-
2010 Unirea Urziceni -
Source: elaborated by the authors with data from uefa.com We can see from the improving trend of the CEE region regarding participation in international cups. One of the main reasons behind this trend is the 2009 changes in UEFA regulations: with the establishment of a “champions route”
the non-champion clubs of big leagues do not play with the teams of these countries, furthermore the ones finishing the CL in the last qualifying round can continue to play in the EL from a very eminent position.
It is worth highlighting that there was only one team in the last 10 years who made it to the group stage in the Champions League: Sparta Praha in 2004 (they lost against AC Milan 4-1).
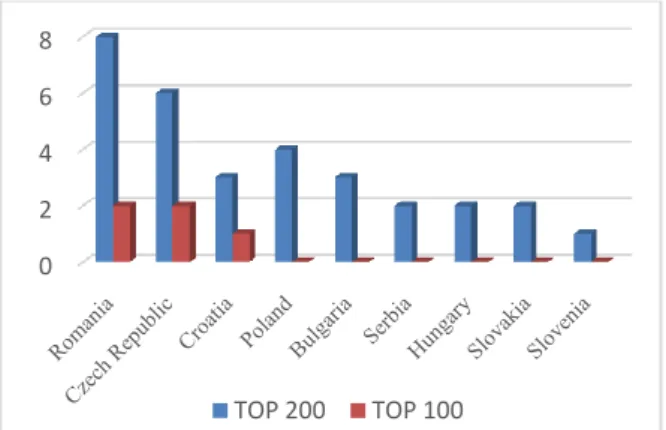
Looking at the positions of clubs internationally we can see (Figure 5) that the Romanian and Czech clubs represent the region to the highest extent among the best 100 and 200 teams. Naturally, this is in line with the UEFA rankings regarding the championships.In the best 100 there are only 5 clubs from the region. Besides the clubs of Romania and Czech Republic we can find one Croatian club.
Figure 5. Number of CEE clubs in the top 100 and top 200 clubs, by UEFA ranking
Source: elaborated by the authors using data from uefa.com It is an interesting fact from UEFA statistics (UEFA, 2013) that among those clubs who played the most CL and/or EL matches in the last 10 years Steaua Bucarest possesses the eminent 6th place (right before Bayern Munchen). We have to add that in the statistics they took into account the qualifying rounds too, and it also helped Steaua Bucarest that they managed to play well in the EL, which is significantly easier than the CL.UEFA gives 75%
of the performancerevenues to CL participating clubs in 2013-2015,19% goes to ELparticipants and the remaining 6% to non-participants (for solidarity), which more or less maintains the status quo of the clubs (UEFA, 2013).
According to UEFA estimations the internationally active clubs of different championships can be categorized as inTable 7 (based on revenues).
02 46 108 12
Number of clubs in CL and EL in last 5 years
Number of clubs in CL Number of clubs in EL
0 2 4 6 8
TOP 200 TOP 100 0
2 4 6
2010 2011 2012 2013 2014
Results in European League after group matches
Best 16 Best 32
Table 7
Distribution of CEE clubs by club revenue
Country 10-50 M EUR 1-10 M
EUR 0-1 M EUR
Poland 1 3 0
Czech Rep. 1 3 0
Croatia 1 2 1
Bulgaria 0 4 0
Hungary 0 4 0
Romania 0 4 0
Slovenia 0 4 0
Slovakia 0 3 1
Serbia 0 2 2
Source: elaborated by the authors using data from UEFA (2013), p. 13
Three clubs have revenues higher than 10 M EUR and 29 clubs are between 1 and 10 M EUR in CEE. This means that a small percentage of UEFA money comes to the region (since there few CL and EL participants), but at the same time for those clubs who do get in to these leagues it is a chance to stand out from the region because they get high revenues compared to their average budget (in the 2012/2013 seasonthe UEFA paid 8.6 M euros for getting into the CL group stage – uefa.com). Within the region there are quite large differences. Figure 6 shows the concentration of teams coming from the same league with regards to their revenues (UEFA,). These amounts have crucial importance, since they can be examined as verifiable and accurate market revenues.
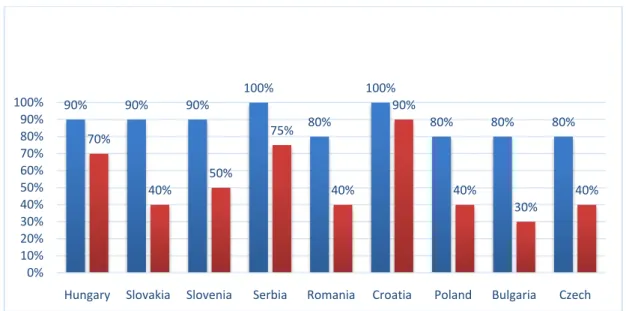
Figure 6. Concentration of club success: Percentage of national titles won by the three most successful teams and by one team in CEE region from 2004/2005 to 2013/2014
Source: elaborated by the authors using data from uefa.com Looking at the teams participating in international
leagues we can see that the Hungarian, Romanian, Bulgarian, Serbian, Slovenian and Slovakian clubshave similar incomes, while there are significant differences among the Polish, Czech and Croatian clubs (UEFA 2013 p.
38.). This means that successful teams remain very hard to beat in these championships. The following graph showing the concentration of the last 10 years leads us to the same conclusion.
In every country the three most successful clubs won 80- 100% of the championships and the most successful one won at least every third in the last 10 years. As a result, it becomes very hard for new clubs to get to the frontline and get the chance to participate in the Champions League, to increase revenues and to be able to export players on the international market.
The 2013 UEFA report (UEFA, 2013) highlights 3 teams from the region: Legia Warsaw, Lech Poznan (Poland) and Partizan (Serbia). They had over 3 M EUR profits from exporting players. According to the report transfers meant 22% of the overall revenue in Polish clubs,
and 21% of revenue in the case of Serbian clubs.If we examine the revenue ratio of transfers, Partizan takes the third place with 60%, Lech Poznan is over 5.40%, and Warsaw is above 8.20%.
As we mentioned before, clubs of the region do not have significant revenue from merchandising market and data are not actually verifiable about the amounts gained from other sources revenue (sponsors, consumers). The low revenues coming from other markets can also be explained by the small number of spectators in the region: if there are no consumers there are no sponsorship, merchandising or commercial revenues either.
According to the data collected by UEFA (2012) the average and aggregated numbers of spectators are both quite low. Only Poland, Romania and the Czech Republic were involved in their data collection, since the other countries lag behind even the English fourth division. (As a comparison the average of the German second division is above 17000 while the Dutch first division is above 19000).
90% 90% 90%
100%
80%
100%
80% 80% 80%
70%
40%
50%
75%
40%
90%
40%
30%
40%
0%
10%
20%
30%
40%
50%
60%
70%
80%
90%
100%
Hungary Slovakia Slovenia Serbia Romania Croatia Poland Bulgaria Czech
Table 8
Number of spectators at club matches in three countries (2012/2013 season)
League
Average number
of spectators
Number of clubs
Number of matches
Total number
of spectators
Poland 8,409 16 240 1,830,615
Romania 5,184 18 306 1,586,321
Czech
Republic 4,798 16 240 1,151,505
Source: UEFA (2012) pp. 36-37
Regarding the number of spectators (UEFA 2012, p. 39), between the 2011/2012 and 2012/2013 seasons, we can see that Bulgaria had more than 20% growth and the Croatian and the Romanian leagues also show an increase, while there is a slight decrease in Serbia (5-10%) and a bigger one in Hungary and Slovenia (more than 20%). This is also in line with the results of a survey where local football fans were asked to name their favourite clubs and among Hungarians, Slovenians and Slovakians Barcelona was the most common answer, while in the other countries it was
one of the local clubs (UEFA,2013, p. 41).The 2014 issue of CIES shows the number of club-trained players in the adult teams. Nine clubs of the region got into the best 20,which leads us to the conclusion that the clubs in this region focus on their youth training systems(CIES (2014) p. 20).The 2014 issue of CIES collected those clubs which export the most football players to the Western European leagues (CIES, 2014 p. 20.) ). From the region the report highlights the Serbian Partizan, but there are also some other clubs in eminent positions.
CIES notesthat„second most prolific training club is Partizan Belgrade, followed by Barcelona. The latterclub tops the Bbig-5 league table, followed by another very competitive Spanish team. Real Madrid. Many other top flight teams are in the top positions of the ranking”(p. 21.).
Primary research
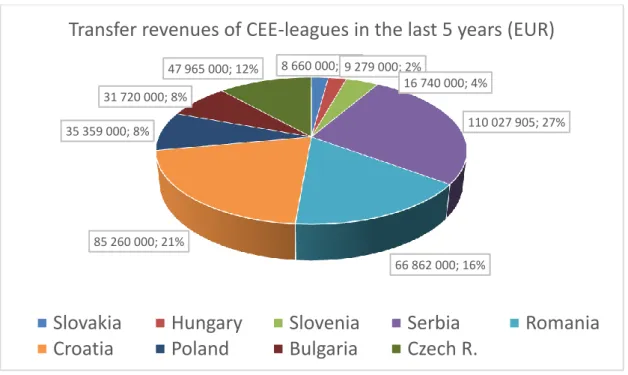
Figure 7 depicts the overall profit in the region coming from the players‟ market divided by leagues. Clubs in the CEE region altogether realized a profit of 411 M EUR in the last 5 years, from 2010-2014. The exports of the Serbian, Romanian and Croatian championships represent 64% of the total. 15% of the whole profit belongs to Partizan Belgrade.
Not all transfer revenues come from exports, but the financial value of the national transfers is minimal compared to the international ones.
Figure 7. Transfer revenues of CEE leagues (2010-2014), Source: elaborated by the authors using data from transfermarkt.de
Championships and national teams of countries with similar traditions and economies show various development paths, which can be very well illustrated by the number and value of players transferred to more developed leagues in
Western Europe. It is worth studying the models of successful countries and clubs.
8 660 000; 2%9 279 000; 2%
16 740 000; 4%
110 027 905; 27%
66 862 000; 16%
85 260 000; 21%
35 359 000; 8%
31 720 000; 8%
47 965 000; 12%
Transfer revenues of CEE-leagues in the last 5 years (EUR)
Slovakia Hungary Slovenia Serbia Romania
Croatia Poland Bulgaria Czech R.
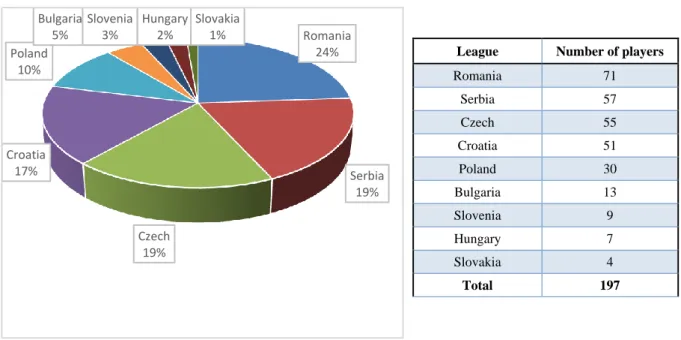
Figure 8. Number of players sold above 1 M EUR between 2004-2014 from the CEE region Source: elaborated by the authors using data from transfermarkt.de
In the comprehensive research paper of KEA-CDES about the European players‟ market we can find a short analysis for every country of the 2010-2011 season. It is worth comparing this data with the results of our research,
which contains data of the clubs in the respective countries and goes back for several years.For detailed information see Table 9.
Table 9
Comparative table of KEA-CDES and current reserarch
Country/league KEA-CDES (2010/2011) Current research (2009/2010-2013/2014)
Poland
Recruits: mainly from Serbia
Transfer balance of league: surplus of 4 M EUR Concentration: the 3 most important clubs in terms of
transfer revenues represent 75% of total revenues The turnover of the league is 90 M EUR, i.e. an
average of 5 M EUR per club.
Mostly operating deficit
Transfers enable some of them to have positive results
Total transfer profit of Polish League from 2010 to 2014 was more than 35 M EUR
There are 4 Polish clubs in top 200 in 2014UEFA ranking but only 3 have positive
balance from transfers
Lech Poznan and Legia Warsaw had more than 10 M EUR profit from transfers from
2010 to 2014
Export way: Germany (with high values)
Romania
Recruits: from domestic market and for Portugal (many Portuguese coaches)
A few years ago the country was clearly an exporter of players; this seems less the case today International and domestic transfer market. Balance: +
18 M EUR
The turnover of the league was 120 M EUR or 5 M EUR on average per club
The operating result was negative (20% of income), but this did not prevent some of them (6) making profits of about 0 to 10% of their income. Romanian clubs are largely dependent on the sale of their players
in order to stabilize their financial situation
Total transfer revenues of Romanian League from 2010 to 2014 was almost 135 M EUR, profit was 67 M. Romainan clubs have many recruiting costs compared to the Serbian and
Croatian Leagues.
There are 3-4 clubs with more than 1 M EUR profit in every year from transfers There are 8 Romanian clubs in the top 200 in
2014 UEFA ranking, but 2 teams are out of first league last year and others also have
variable sport success
CFR had 5 M EUR, Dinamo Bucarest had 3 M EUR average profit from transfers, most successful Steaue Bucarest has had no profit in
last five years
League Number of players
Romania 71
Serbia 57
Czech 55
Croatia 51
Poland 30
Bulgaria 13
Slovenia 9
Hungary 7
Slovakia 4
Total 197
Romania 24%
Serbia 19%
Czech 19%
Croatia 17%
Poland 10%
Bulgaria 5%
Slovenia 3%
Hungary 2%
Slovakia 1%
Country/league KEA-CDES (2010/2011) Current research (2009/2010-2013/2014)
Czech Republic
Mainly recruit in neighbouring countries such as Slovakia Specializes in the training and promotion of young players, as shown by the average age of players who play there. Therefore, recruitment favours very young players
(23.2 years) and takes place mainly in the domestic market - up to 74%
Exported 118 players to the 36 European leagues in 2009 (Poli 2010). During the 2010-11 season, Czech clubs collected a total of €26m relating to the transfer of players
(263) for expenditure of 5 M EUR (267 transfers), resulting in a largely positive balance (21 M EUR) and
confirming the training policy of clubs.
The average turnover per club is only 4 M EUR. The operating result is negative up to 10% of the income of the clubs in the league. Transfer operations enable many
clubs (5) of this country to balance their accounts
Total transfer revenues of Czech League from 2010 to 2014 was 48 M EUR There are 6 Czech clubs in the top 200 in 2014
UEFA ranking but only 3 have positive balance from transfers
Victoria Plzen has the best on-field results in the last few years but they realized only 1.27 M EUR profit on the transfer market from
2010 to 2014. Plzen recruits mainly from Czech League and obtainss transfer revenues
from Germany
Sporta Praga and Slavia Praga had about 2 M EUR average annual profit from 2010 to 2014
Slovakia
Mainly recruited in the Czech Republic (49 players) Exported 92 players to the 36 European leagues in 2009 (Poli 2010). Transfers revenue in 2010-11 amounted to 3
M EUR for 196 transfers
This enabled the league to achieve a positive balance (2 M EUR). The turnover of the Slovakian league was 24 M
EUR, i.e. 2 M EUR on average per club
Number of clubs in top 200 in UEFA ranking is 2.
Total transfer revenues of Slovakian League from 2010 to 2014 was 11.63 M EUR, profit
was 8/66 M EUR.
In 5-year horizon Slovakian clubs cannot realize a significant and continuous profit
from transfers
Hungary
Most recruitment takes place in Serbia (21) and Croatia (10)
Transferred 288 players in 2010-11, generating total transfer revenues of about 6 M EUR. This enabled the
country to have a positive balance (3 M EUR).
In 2010, the estimated average income of clubs was 1 M EUR. 9 out of 16 clubs made an operating profit This deficit was more than offset by a significantly positive balance of transfer fees which enabled an overall
positive net result for the league
Number of clubs in the top 200 in UEFA ranking is 2.
Total transfer revenues of Hungarian League from 2010 to 2014 was 18.1 M EUR, profit
was 9.28 M EUR.
In 5-year horizon Hungarian clubs cannot realize significant and continuous profit from
transfers
Slovenia
Mainly recruited in Croatia (10)
Slovenia transferred 197 players for total revenues of 11 M EUR. As recruitment is mostly made for free (free players or who reached an agreement with their previous
clubs), its balance of transfer is strongly positive (11 M EUR)
In 2010, the estimated average income of the clubs was 1 M EUR
Slovenia is one of the countries with the most important operating deficit: 30% of income of the league The balance of transfers can generate a positive net result
There is only one club in the top 200 in UEFA ranking
Total transfer revenues of Slovenian League from 2010 to 2014 was 18.42 M EUR, profit
was 16.74 M EUR
In 5-year horizon Slovenian clubs cannot realize significant and continuous profit from
transfers
Bulgaria
Recruits largely in Brazil (12 players) and Cyprus (9) Generated 11 M EUR transfer revenues Bulgaria had a positive balance of transfers (9 M EUR).
The estimated average income of Bulgarian clubs is 1.2 M EUR
The operating deficit of Bulgaria reaches 30% of incomes Transfers do not have enough impact to significantly
improve the net situation
Number of clubs in the top 200 in UEFA ranking is 3
Total transfer profit of Bulgarian League from 2010 to 2014 was 31.72 M EUR
Country/league KEA-CDES (2010/2011) Current research (2009/2010-2013/2014)
Serbia
Partizan Belgrad won 7 seasons from 10 from 2004 to 2014
Total transfer revenues of Serbian League from 2010 to 2014 was almost 127 M EUR,
profit was 110 M EUR.
Partizan Belgrad realized about 50% of transfer revenues of Serbian League There are 3-4 clubs which have more than 1 M
EUR profit in every year from transfers
Croatia
Total transfer profit of Croatian League from 2010 to 2014 was 85.26 M EUR Almost 70% of this profit was realized by Dinamo Zagreb (32.4 M EUR) and Hajduk
Split (26.26 M EUR) – very concentrated Number of clubs in the top200 in UEFA
ranking is 3.
Source: elaborated by the authors using data of KEA-CDES (2013)
The quality and development of human resources is particularly important for CEE clubs, because they cannot buy stars and don‟t have enough revenue from other markets.If we are looking at export of players in comparison with the population and the GDP of the given country, we see that the highest exportsare from Romania, Serbia and Croatia, and the two latter are the most efficient. The relatively large country of Poland and the medium-sized Czech Republic achieved average performance, while the other four countries‟ export performance can be categorized as poor, especially regarding medium-sized Hungary and Bulgaria.
Table 10
Classification of leagues by efficiency and country size
Results/Country
size, GDP Small Medium Large
Poor Slovakia, Slovenia
Hungary, Bulgaria
Average Czech
Rep. Poland Good Croatia,
Serbia Romania
Source: elaborated by the authors
Effects on national teams: In Table 11we collected the countries who were able to participate in international tournaments (EC, WC, Olympics, U20-U21 WC) in the last 12 years.
Table 11
National team sport success
Country EC WC Olympics
U20- U21 WC Serbia (with
Montenegro until 2006)
2006, 2010
2008, 2004
Croatia 2012, 2008, 2004
2014, 2006, 2002
2011, 2013
Poland
2012 (as organizer),
2008
2002,
2006 2007
Slovenia 2002,
2010
Slovakia 2010
Hungary 2009
Bulgaria 2004 Czech Rep. 2012,
2008, 2004 2006 2009,
2007 Romania 2008
Source: elaborated by the authors
In the last 12 years only Hungary was not able to qualify for the adult EC or WC. Serbia made it twice to the Olympic Games. On the U20-U21 and adult level Croatia and the Czech Republic are the ones standing out from the crowd.
C ONCLUSIONS
Championships and national teams of countries with similar traditions and economic backgrounds show various development paths which can be very well illustrated by the number and value of players transferred to Western
European leagues. It is worth studying the models of successful countries and clubs.
We found the following answers for the hypotheses:
H1: The CEE region has weak efficiency in European Football (sport and financial failure): True. Regional clubs are not too successful, but we found an improving trend.
Revenues, and mostly transfer revenues of the region are getting higher.
H2: There is a big difference among the clubs of the CEE region (in terms of both sport and financial results)
True. We identified large differencesamong leagues and alsoamong the clubs inside national leagues (the clubs that are playing in international cups and the others).
H3: There are few clubs in some countries which are very effective
YES, there are some very successful clubs which stand out from the field. These clubs can use earnings from international cups and transfers very successfully and they can keep their leading position in national leagues and in the region. The outstanding youth academy system and continuous international appearances can be core competences of football clubs in the Central and Eastern European region.
Our main conclusions are the following:
- football of the CEE region has specific characteristics compared to WesternEurope,
- we found significant revenue and profit in the transfer market in CEE,
- the number of successful clubs in the CEE region will decline.
Limitations of the research
- problems with transparency: hidden data (about revenues, transfer options, etc.) – see FIFPRO Black Book about EasternEurope
- transfermarkt.de uses estimates
- not all transfer revenue comes from exports, but the financial value of the national transfers is minimal compared to the international ones
- nationality of players is not examined – conclusions about success of national teams is a limited explanation.
Further investigations
Our plan is to expand the research and examine the nationality of players. It could be interesting todo casestudies about the most successful clubs of the region in the transfer market (for example Partizan Belgrad). Our aim is to examine the youth academy system and strategies of successful clubs and associations of the region. We would like to followup the careers of players from the CEEregion to see what level they can reach in European Football.
We hope we have managed to fill a gap with this paper and plan to prepare an international study with other researchers of this region.
REFERENCES
ANDRÁS, K. (2003): Business elements in sports, through example of football; Ph.D. Dissertation; Budapest University of Economics Sciences and Public Administration
ANDRÁS, K. (2004): A hivatásos sport piacai, Vezetéstudomány XXXV. p. 40-57. (Markets of professional football) ANDRÁS K. (2011): Piacméretet növelni, de hogyan? – a hivatásos sport példáján. NSSz Sportszakember továbbképzési
konferencia sorozat III. 27-32. (Increasing the market size – example of professional sport)
ANDRÁS, K. – KOZMA, M. – KYNSBURG, Z. – ROHONY, Á. (2000): Üzleti elemek a labdarúgásban, ISM-kutatás (812- 11 futballmenedzsment), zárótanulmány, Budapest (Business elements in professional football)
ANDRÁS, K. – HAVRAN, ZS. – JANDÓ, Z. (2012): Üzleti globalizáció és a hivatásos sport: sportvállalatok nemzetközi szerepvállalása, Corvinus University of Budapest (Business globalization and the professional sport:
international activity of sport companies)
ANDRÁS, K. – JANDÓ, Z. (2012): Hivatásos sportvállalatok nemzetközivé válása. Logisztikai híradó 2012 március különszám, 42-47., http://issuu.com/mlbkt/docs/logisztikai_hirado_kulonszam_2012/4 (Internationalization of professional sport companies)
ANDRÁS, K. – HAVRAN, ZS. (2014): A határ a csillagos ég. De mi is a cél?, konferencia előadás, 2014. június 6.
Debrecen, XI. Országos Sporttudományi Kongresszus (New business strategies of football clubs in european top leagues)
CIES (2011): CIES Football Observatory: Annual Review of the European football players‟ labour market 2011 (extract).
CIES (2012): Annual Review of the European football players‟ labour market 2012 – extract CIES (2013): CIES Football Observatory: Demographic Study 2013 - extract
CIES (2014): CIES Football Observatory: Demographic Study 2014 - extract
CHIKÁN, A. (2003):Vállalatgazdaságtan. 3rd edition. Budapest: AULA Kiadó. (Business economics) CHIKÁN, A. (2008)Vállalatgazdaságtan.4th edition.Budapest: AULA Kiadó.(Business economics)
CHIKÁN, A. (2010): A globális gazdaság – az üzleti tevékenység kerete. in Czakó Erzsébet – Reszegi László: Nemzetközi vállalatgazdaságtan, Alinea Kiadó, Budapest, 2010, 63-88. (Global economy)
CZAKÓ, E. (2010): A nemzetközi stratégia területei. in Czakó Erzsébet – Reszegi László: Nemzetközi vállalatgazdaságtan, Alinea Kiadó, Budapest, 2010, 179. (International strategy)
CZAKÓ, E. (2012): A nemzetközi környezet elemzése. Nemzetközi vállalatgazdaságtan előadás, BCE 2012.02.29.
(International busines economics)
DEMETER, K. (2010): A termelés és szolgáltatásnyújtás. in Czakó Erzsébet – Reszegi László: Nemzetközi vállalatgazdaságtan, Alinea Kiadó, Budapest, 2010, 337-372. (Production and service provision)
FIFPro (2012).FIFPro Black Book Eastern Europe: The problems professional footballers encounter: research. FIFPro Services. Download from: http://www.lefigaro.fr/assets/pdf/fifpro.pdf Time of download: 13 March, 2014
KEA-CDES (2013): The Economic and Legal Aspects of Transfers of Players 2013. Download
from:ec.europa.eu/sport/library/documents/cons-study-transfers-final-rpt.pdfTime of download: 20 November, 2013 SZABADOS, G. (2012): Examine of transfer balance of European Football Leagues; lecture in Corvinus University of
Budapest, 20 April 2012.
UEFA (2008): Club Licensing Benchmarking Report Financial Year 2008 UEFA (2009): Club Licensing Benchmarking Report Financial Year 2009 UEFA (2010): Club Licensing Benchmarking Report Financial Year 2010 UEFA (2011): Club Licensing Benchmarking Report Financial Year 2011 UEFA (2012): Club Licensing Benchmarking Report Financial Year 2012
UEFA (2013): Benchmarking Report on the clubs qualified and licensed to compete in the UEFA competition season 2013/14
Internet resources of the collected dataset:
www.transfermarkt.de www.uefa.com