THE SOLUTION-SEEKING BEHAVIOR OF SMALL HUNGARIAN ENTERPRISES BETWEEN 2006 AND 2010
Ágnes gyõri1
AbstrAct This paper describes the results of an investigation into the finance- related innovative ability of Hungarian micro, small and medium sized enterprises (SMEs) by using two datasets (from 2006 and 2010). The author explored SMEs’
levels of openness to new financial solutions and identified features which influence their innovative solution-seeking behavior. Additionally, changes in innovation between 2006 and 2010 were analyzed according to the SME sector and whether there is a correlation between having an active solution-seeking attitude and business performance was examined. The findings show that shared/multiple ownership in businesses (having interests in different enterprises simultaneously) has a significant positive effect on flexibility and innovative ability. However, the size of the business, industrial sector, type of ownership and market of the SME also have some effect. Furthermore, the hypothesis that an active solution-seeking attitude increases after-tax performance per employee was confirmed.
Keywords small and medium sized enterprises, active solution-seeking attitude, innovation
1. INTRODUCTION
The social-economic-political changes of the eighties and nineties – similarly to changes in Western Europe in the seventies – caused the SME sector in Hungary to develop. The change included an increase in knowledge- based activities, the development of telecommunications and the uptake of
1 This research was conducted within the framework of the TÁMOP 4.2.1/B-09/1/KMR-2010- 0005 project “Innováció a KKV-k és önfoglalkoztatók körében”. The head of the research group was Czakó Ágnes. The author of this paper is a Ph.D. candidate at the Corvinus University of Budapest, Institute of Sociology and Social Policy. E-mail: agnes.gyori@uni-corvinus.hu
new technologies – as well as several other developments – and increased the economic role of small businesses. There are different explanations for these changes. Several studies show that the success of SMEs (especially in knowledge-based industries) helped them recover from the economic crisis, created job opportunities and stimulated technological innovation and increased GDP.2 Problems with enterprises could be explained by their organizational size, a lack of resources and high prices (Bilek et al. 2006;
Csubák 2006). The contribution of SMEs to economic growth –significantly less than that of middle sized companies – may be lessened by their strong link to traditions and their lack of modern business solutions.
Hungarian SMEs are competitively weak, low on professionalism and show high sensitivity to changes in the economic environment. Studies which have examined the effect of the 2008 economic crisis on Hungarian enterprises (Bartha et al. 2009; Czibik et al. 2009; Semjén – Tóth 2010) show that the recession affected smaller enterprises more because of their less-diversified field of activities and their weaker financial management. Their dependency on bank loans is high because they are generally in much weaker financial positions than big enterprises. Hungarian research shows that the behavior of small enterprises is strongly associated with their direct socio-economic environment3 and that their business activity is influenced by tradition. These characteristics have changed in the past few years in line with the economic recession. SMEs have had to adapt to turbulent circumstances: on the one hand they have had to make changes in order to decrease their expenses to avoid the impacts of the crisis.4 On the other hand they needed a higher level of awareness in order to make better business decisions. The author´s former research (Gyõri 2012) identified different levels of rationality in this regard, according to SME type.5 The changes which occurred between 2006
2 Some related research is described in Bilek et al. (2006); Inzelt (2003, 2011); Inzelt – Szerb (2003); Kállay et al. (2009); OECD (2005) and Román (2006).
3 For details about the embeddedness of Hungarian small enterprises and the positive and negative resource-roles of family and acquaintance relationships see Czakó (1997); Czakó et al. (1994, 1995); Czakó – Vajda (1993); Kuczi (1996, 1998, 2000); Laki (1994); Laky (1998) and Vajda (1997).
4 The negative effect of the crisis on Hungarian SMEs is described in Andrási et al. (2009) and Bartha et al. (2009), ‘Vállalatok válságban’ (2009); the work of Szavó-Morvai (2010), the data on SMEs collected by the HÉTFA Research Institute, and analyses and case-studies from Munkaerõpiaci Tükör 2010 and Közelkép: A válság munkapiaci hatásai (Fazekas – Molnár 2010).
5 Our results confirmed the unique nature of the SME sector which is described in former studies.
This suggested that among the smallest-sized SMEs (fewer than 10 employees), a low level of enterprise rationality predominates.
and 2010 emphasized the development of the SME’s financial management practices. Their improving financial knowledge and professionalism played an important role in increasing the amount of rational decisions that they made.
This paper describes the ´innovative ability´ of Hungarian SMEs, but we use this term in a non-traditional sense. Entrepreneurship is used to refer to “behaviors that include demonstrating initiative and creative thinking, organizing social and economic mechanisms to turn resources and situations to practical account and accepting risk and failure” (Hisrich 1990, cited by Frese 1995: 63-68) and includes “three concepts: personal initiative, innovativeness and market orientation.” Frese argues that these three terms can be examined in practice with the help of an action theory approach.
SME´s searching for solutions is a kind of troubleshooting activity and is a form of problem-solving. All these elements are an integral part of attitudes towards entrepreneurial innovation.
Former studies about the innovation activity of companies have mostly focused on the research and development and innovation (R+D) activities of multinational large firms, and little is known about the innovative activity of SMEs. There are few Hungarian empirical studies about this topic6; those that exist mostly examine technology-focused enterprises which have undertaken innovation (this part of the SME sector is more likely to innovative).7 Studies which have a focus on other sectors of industry indicate that SMEs in Hungary have a low rate of innovation. Inter-firm and inter-institutional (enterprise – research institute, enterprise – university) collaborations and cooperative efforts for developing innovation are minimal. However, innovative activity undoubtedly plays a role in increasing competitiveness (Papanek 2007).
These are the underlying reasons why EU policies for enterprise-development are designed to foster regional cooperation.8 Even so, according to Hungarian data, the innovation-based collaborations which have been inspired by policy are largely ineffectual in practice. The most important finding from studies about the innovation activities of SME’s is that Hungarian government incentives to promote innovation are barely impacting SMEs. They tend
6 Some related work includes Antalóczy-Sass (2011]; Bajmócy (2007); Bartha-Matheika (2009);
Benke (2011); Czakó (2011); Csizmadia (2008); Csizmadia-Grosz (2008); Csonka (2011);
Halpern-Muraközy (2010); Inzelt (2003, 2011); Sass (2011) and Szerb-Ulbert (2009).
7 These studies usually do not involve micro-enterprises with fewer than 10 employees.
8 The operational programmes of National Development Plan, the New Hungary Development Plan and the New Széchenyi Plan focus on developing the innovation potential of SMEs in order to increase the regions’ competitiveness.
to support enterprises which are only marginally innovative than actually inspire SMEs to innovate (Csizmadia 2008; Inzelt 2011). A lack of financial resources and the bureaucratic operations of the Hungarian tendering process create difficulties for SMEs to innovate and develop further (Bartha et al.
2009; Bruszt–Vedres 2010; Inzelt 2011).
The innovative ability of SMEs in Hungary – as previous research indicates – follows a distinctive pattern: innovation tends to preserve a conventional way of operating rather than foster the expansion of business. The recession has caused entrepreneurs to act in unusual ways. Their behavior has become more flexible and open and they have started seeking new solutions, mainly in the areas of finance and management.
This paper is based on the SME subsample of a dataset used in the research project “Pénzügyi kultúra Magyarországon (Financial culture in Hungary9”), carried out at the Corvinus University of Budapest, Institute of Sociology and Social Policy in 2006 which was repeated in 2010. The data was collected from a representative national sample of more than 1200 SMEs. The research presented here is a secondary analysis. The focus is not on identifying solution-seeking measures but examining financial culture. The author has attempted to use indicators to illustrate the solution-seeking activity of SMEs.
As a result, the analysis is limited. Nonetheless it is a fruitful experiment to re-conceptualize the original research.
The selection of SMEs was based on their economic sector and number, taken from a register at the Hungarian Central Statistical Office (KSH). In both of the samples micro-enterprises were underrepresented compared to their real numbers because the aim of the two studies was to generate knowledge about real/active small enterprises (many Hungarian enterprises with fewer than 10 employees are dormant, or shell companies) (Table A1).
The filtered data of the 2006 sample consisted of 1191 (2010 sample: 1192) micro, small and medium sized enterprises.10 For the distribution of the main variables of the two studies see Table A2 in the Appendix.
This study is related to a previous one (Czakó-Gyõri 2012) which examined the innovative ability of SMEs using the 2010 database. However, the aim of
9 The Inter–Europa Bank was the funding organization for this research effort in 2006 and its continuation was supported by the ‘Innotárs’ project of the National Innovation Office in 2010.
Findings were presented at the MSZT Conference in 2010 in the “Financial culture” sector and at the Conference of Economic Sociology in 2011 at the Corvinus University of Budapest.
10 The sample included large enterprises with more than 250 employees because at that time of the study they were considered small or medium enterprises, according to HCSO (KSH) definitions. Over time the number of employees of these larger SMEs increased. To avoid problems these firms were omitted from the analysis.
this research is to analyze SME solution-seeking activity using a combined database from years 2006 and 2010. The goal is to gain better understanding of the solution-seeking of SMEs in business finance and to identify the changes which took place between 2006 and 2010.
I argue that activities such as using electronic bank services, changing banks and switching banking services, applying for resources to develop and having an intention to invest in development are good indicators of the openness of an enterprise and can be interpreted as signs of the intention to break with traditions. Temporal changes in the above-mentioned factors were first examined. After this, a variable called small enterprise solution- seeking was created and used as a base for calculations. Using mathematical- statistical methods the solution-seeking activities of small enterprises were analyzed, taking into account the characteristics of the enterprises themselves.
Furthermore, how an active solution-seeking attitude improves the market/
business efficiency of SMEs was investigated. Findings are summarized at the end of the paper.11
2. SMALL ENTERPRISE SOLUTION-SEEKING VARIABLES The basis of our study is the above-mentioned database from 2006 and 2010. During both questionnaire surveys the owners and heads of the small and medium enterprises were personally interviewed, as were the employees responsible for financial matters (as nominated by the head of the enterprise).
The survey questions referred to the financial culture of the enterprise (relationships with banks, financial knowledge, usage of bank/investment products, insurance and loaning practices), data about the enterprise itself (number of employees, net revenues, after-tax performance, past and expected future performance) and other characteristics of the financial status of the enterprise (for example, income from exports, number of financial transactions, frequency and nature of challenges with business finance, investment intentions, competition activity, ownership characteristics and size/area of markets)
11 It is necessary to emphasize that the current study is the secondary (re)analysis of empirical data.
The primary aim was not to investigate the innovation-related and solution-seeking behaviour of SMEs but to generate overall knowledge about the financial culture of SMEs (specifically, to create more precise information about SMEs knowledge and behaviour regarding business finance and loans). While the author believes that this approach is suitable for analysing SME solution-seeking and innovative behaviour, she are aware that the innovative behaviour of enterprises cannot be narrowly defined using the dimensions of analysis employed.
An enterprise solution-seeking variable was then constructed, based on the survey, and included data about the following elements:
– e-bank usage12, SMEs that used any internet banking services for business reasons, or for both personal (household) and business reasons;
– changes in financial service-providers13, SMEs that had changed their service providers for the following reasons: cost rationalization (for example, to avoid expensive service fees or obtain more favorable or newer services at other banks), for reasons of time-saving (for example, to avoid travelling long distances to bank branches, to avoid queuing or unfavorable opening hours or avoid the problem that there were only a small amount of offices or ATM-s in the area, etc.), and quality problems (impolite administrators, untidy bank environment, etc.);14
– competition activity15, those enterprises which planned to participate in EU or governmental growth and development programs;
– intentions to expand16, those SMEs were involved in the analysis that planned to make significant investments or developments in the forthcoming years.
The author hypothesizes that this small enterprise solution-seeking variable is able to measure the overall innovative ability of the enterprise, which can in theory be modulated and improved. Active solution-seeking enterprises can be described using behavioral characteristics that are indicators of innovative attitudes. Such characteristics may give them relative advantages on the market. The relationship may not be deterministic but the indicator should be appropriate for identifying a group of small enterprises which are more willing to develop and innovate.
3. TEMPORAL CHANGES IN SOLUTION-SEEKING BEHAVIOR
12 The survey question was: “Do you use Internet banking services for your personal use (for your household) or business?”
13 The survey question was: “Has your enterprise ever changed its financial service provider, and if so, why?”
14 Data about enterprises that were obligated to change their financial service providers (for example, a bank closed or would not provide a loan, etc.) were omitted from the analysis.
15 The survey question was: “Has the enterprise ever enrolled in an invitation-to-tender procedure for investment or development resources?”
16 The survey question was: “Does the enterprise plan to make any significant investments or developments this year?”
The components of enterprise solution-seeking, which measure the openness of SMEs, are presented in Table 1. The data clearly shows some changes in certain aspects of enterprise solution-seeking behavior between 2006 and 2010.
Table 1: Distribution of components of the indicator “enterprise solution-seeking”
between 2006 and 2010
Solution-seeking variables N2006 N2010
Use of Internet banking N 819 1008
% 68.9 78.8
Changes in financial service-provider, N 363 399
% 30.2 33.3
Competition for resources for investment and development
N 570 694
% 47.4 60.8
Intention to develop N 380 291
% 32.2 25
We found negative tendencies for just one variable; investment activity.
The number of enterprises which report development or investment activity in the sector decreased by 7% over the period, while there were positive changes in the competition-related activities of the enterprises (an increase of 13.4%) and in internet banking (by 10%) and there was an increase in the frequency of leaving service-providers due to discontent with the services on offer (3.1%). These changes reflect the effect of the economic recession which happened between the times that data was collected. As a result, it seems that the small and medium enterprises decreased their investments and became more open to examining how they are engaged in information and knowledge-based activities, such as the use of electronic bank services and financial institutions, etc.
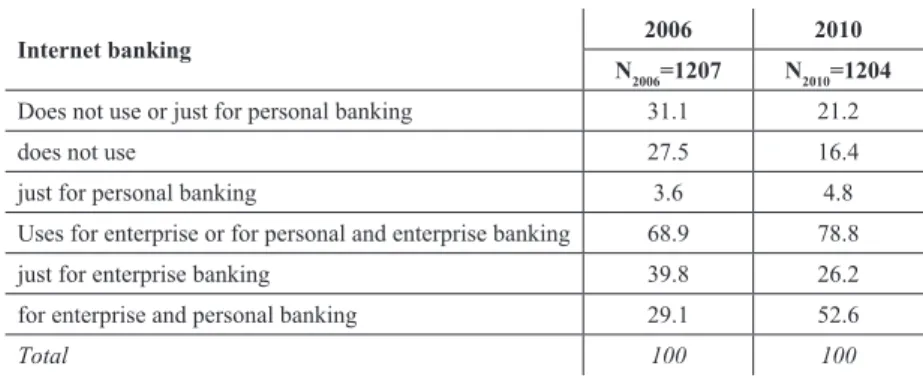
The change in the use of internet bank services indicates a change in solution-seeking attitudes: while in 2006 almost 70% of the SMEs used electronic banking services, in 2010 the number was around 80% (Table 2). More internet banking in the SME-sector is probably due to the lower cost. Changing to using an internet bank requires only rational thinking and openness: activating this service is usually free, service charges are low and internet banks require substantially less time to use than bricks-and-mortar banks.
Table 2: Use of internet banking services at SMEs, 2006 and 2010 (%)
Internet banking 2006 2010
N2006=1207 N2010=1204
Does not use or just for personal banking 31.1 21.2
does not use 27.5 16.4
just for personal banking 3.6 4.8
Uses for enterprise or for personal and enterprise banking 68.9 78.8
just for enterprise banking 39.8 26.2
for enterprise and personal banking 29.1 52.6
Total 100 100
Not all of the small enterprises take advantage of e-bank services. The most frequent reasons (based on both samples) for not using them are their impersonality and fears of a lack of security. In our 2006 sample every second, and in 2010 every third of all enterprises which did not use an internet banking service identified one of the above-mentioned reasons for not doing so (Table A3)17.
Data from 2006 and 2010 show that one third of all enterprises have changed their financial service-providers since their establishment. The reasons for this (Table 3) are cost-efficiency – avoiding high expenses, low interest rates or unfavorable loan-constructions, etc. In 2006 37.5% of all SMEs and in 2010 45% changed their financial service-providers for these reasons). The reason second most frequently identified was some kind of negative constraint – such as a decision/order from above, the bank was closed down, the bank refused to offer credit or refused to continue to finance the business – which affected every fifth enterprise which changed its bank in 2006 and every fourth in 2010. The number of SMEs that changed their banks in order to save time remained more or less stable (13% and 15%). There was also almost no change in the number of those who decided to leave their bank because of discontent, because they found them unhelpful or unprofessional or because the bank changed location (10% and 9% of all SMEs, respectively).
17 For more information about the population and enterprise characteristics of internet banking see Hanti (2011) and Kepka (2011). These papers are based on the data from the original 2010 dataset which is also referred to in this paper.
Table 3: Reasons for SME changes in financial service-provider, 2006 and 2010 (%)
Reasons for changing bank 2006 2010
N2006=359 N2010=399
Cost-rationalization 37.5 45,2
Negative constraint 21.1 24.6
Time-saving 12 15
Quality of the bank service 10.2 8.8
Other reason 19.3 6.4
Total 100 100
Analysis of the activity of the SME sector also shows increases in incidents of solution-seeking behavior. Between 2006 and 2010 the number of enterprises that were trying to obtain resources through tendering increased significantly (by 13.4%). Another positive change was seen with the winning of tenders. While in 2006 83% of all tenders handed in by enterprises were won; in 2010 the number was 88%. Comparing the different sources of the development tenders (see Table 4) the chance of obtaining either state or EU resources doubled (in 2006: 22% of all enterprises, in 2010: 40%). From all possible sources of resources for development, demand for loans offered by commercial banks increased while the percentage of those enterprises which won resources from the EU-state resources and from the Hungarian Foundation for Enterprise Promotion remained at under 5%.
Table 4: Tender activity in SMEs, 2006 and 2010 (%) Have you ever applied for the
following resources?
Have not Have applied and won
Have applied but have not
won
2006 2010 2006 2010 2006 2010
State funds, EU competitions 72.7 53.6 22.1 40 5.3 5.4
Commercial banks, Savings banks 79.4 72.1 18.2 23.3 2.4 3.4
Széchenyi Card 89.4 86.7 9.3 10.6 1.3 1
Hungarian Foundation for Enterprise Promotion
95.7 92.2 3.7 4.4 0.7 1
Governmental funds 95.6 93.4 3.4 4.2 1 0.8
Other resources 93.4 86.9 5 9.1 1.6 1
,
The proportion of enterprises that unsuccessfully applied for tenders did not change significantly in the five years although the rate of applications for loans that were rejected increased. In 2006 the most frequent reason for rejection was that the application did not meet formal requirements (16.6% of all cases). Such problems included handing in applications after the deadline, applications with missing data or the filling out of incorrect forms. In 2010 more subjective reasons for being turned down such as the lack of a personal relationship with members of the tendering body (15%), or professional considerations (16.7%) (a lack of collateral or submitting a poorly thought- out business plan) – played a role in unsuccessful applications.
The results indicate moderate levels of development and investment activity (see Table 5): in 2006 one third of enterprises in the sample reported that they had developed or would develop or wanted to invest in the given year. However, in 2010 just every fourth enterprise had on-going investment activity. Developmental activities presumably decreased in number because of the recession and the unstable economic circumstances which restricted SMEs from planning developmental activities for the forthcoming 1-2 years.
Table 5: Investments and developments in the SME sector, 2006 and 2010 (%)
Enterprise investment in 2006/2010 2006 2010
N2006=380 N2010=291
Yes 32.2 25
No 67.8 75
Total 100 100
Enterprise development in the future 1-2 years 2006 2010 N2006=1049 N2010=1071
Yes 50.1 48
No 49.9 52
Total 100 100
4. SOLUTION-SEEKING AND ENTERPRISE ATTRIBUTES Variables and model construction
The author constructed an enterprise solution-seeking index from the above-mentioned variables; all components were equally-weighted: if one criterion was satisfied the index was increased by one point.18 The result was a variable with a minimum value of 0 and a maximum value of 4. The higher the enterprise’s score the more it could be described as being open and engaged in active solution-seeking behavior. The mean for the enterprise solution-seeking variable in the sample of 2006 was 1.97. In 2010 it was 1.98.
Table 6 shows the proportions of different enterprises measured by their solution-seeking behavior and compares 2006 with 2010.
Table 6: Solution-seeking indexes for 2006 and 2010 Solution-seeking
Value
2006 2010
N % N %
0 104 10 94 9.3
1 250 24 245 24.2
2 344 33 339 33.5
3 257 24.7 253 25
4 87 8.3 82 8.1
Total 1042 100 1013 100
In both samples approximately one tenth of the sector’s enterprises are not striving to make any kind of developmental changes (10% and 9.3%). One quarter of all enterprises show a low level of openness (24% and 24.2%). The relative majority of SMEs in the sample (33% and 33.5%, respectively) could be characterized as being moderately solution-seeking while another quarter (24.7% and 25%) reported above-average levels of solution-seeking behavior.
Less than 10% of enterprises (8.3% and 8.1%) reported the maximum level of solution-seeking behavior. The two groups with the highest levels of solution-seeking behavior (3 or 4 points on the solution-seeking index) were characterized as being “actively solution-seeking” (Table 7).
18 Enterprises for which data was missing were omitted.
Table 7: Enterprises with different levels of solution-seeking in 2006 and 2010
Solution-seeking attitude 2006 2010
N % N %
Active, above-average solution-seeking
(3, 4 points) 343 33 335 33.1
Moderate or lower-than-average level
of solution-seeking (0, 1, 2 points) 699 67 678 66.9
Total 1042 100 1013 100
While examining the development of the SME sector, enterprises which were using or had introduced finance-related innovations were further analyzed. The author wanted to examine if there were any differences between those enterprises were above average in solution-seeking and those which were less engaged in problem solving.
A dataset was created from the 2006 and 2010 samples and a model was constructed using all of the data. A time of measurement variable was then introduced to control for time effects for 2006 and 2010. We used a binary logistic regression (logit)19 model for analyzing the relationship between active solution-seeking and background variables. The model used those background variables which have been shown to affect the openness and resilience of enterprises (size, sector, ownership characteristics, interest in other enterprises, market size and scope and time of measurement).
The size of the enterprise was defined based on its number of employees. The formerly continuous variable was changed to a categorical variable, enterprise size, and enterprises with less than ten employees were made the reference category. The sector variable was based on the main activity of the enterprise and was a categorical variable with the reference category of the processing industry20. The originally categorical variable of ownership was changed to a binary variable with the value of professional or non-professional ownership (ownership). Interest in other enterprises was a dummy variable which indicated more than ten per cent ownership in another enterprise. Market scope entered the model as a categorical variable with a reference category of the regional market enterprises. Finally, we entered the time of measurement variable into
19 We ran the regression model for each subset of data separately and the outcome was similar but some of the variables lost their significance and the model´s explanatory power was lower (see Table A4).
20 The mining and electricity sector was excluded from the analysis due to low sample size. The tourism and transportation sectors were merged into one category.
the analysis with two possible values (2006 and 2010).
We hypothesized that the time/year of measurement would significantly affect the solution-seeking behavior of SMEs. The economic recession could have caused the SMEs to become more open to developing their financial tools and to changing their routines. Our hypothesis for the effect of enterprise size was based on the assumption that smaller enterprises are more vulnerable.
We expected – given the expectation that the inertia of small enterprises would affect their mobility – that there would be a higher probability of them being engaged in developmental activities than there would be for middle- sized (more than 50 employee) enterprises, which rely more on their stability and may be less interested in pursuing opportunities for development.
Additionally we hypothesized a causal relationship between solution-seeking and an enterprise´s sector: this was based on previous research which has indicated that due to the construction sector’s problems with finance they are more flexible. Previous empirical research has shown that the status of SMEs is tightly related to their relationship with the owners’ family members and their close environment (when problems occur at the business, significant help and resources may be available). In this knowledge we hypothesized that the existence of friendly connections or acquaintances of the owners would affect the solution-seeking behavior of SMEs in a positive direction. We thought that the ´interest in other enterprises´ variable would positively affect solution-seeking. We expected there would be a higher probability that active SMEs would have nationwide and international markets.
Multi-variable analysis of factors affecting the active solution-seeking behavior of SMEs
Table 8 shows the results of the regression model. The asterisks indicate the variables that were found to be significant, when other variables are also included.
The results show that solution-seeking behaviors are affected mainly by the plurality of business ownership (interest in other enterprises), enterprise size, ownership characteristics, market scope and time/year of measurement.
Results indicate the highly significant effect of the interest in other enterprises variable: we found that SMEs that had ownership of other enterprises were engaged in almost twice as much solution-seeking behavior as those that did not. This result is not surprising and is congruent with our hypothesis that connections with other enterprises will positively affect an SMEs innovative behavior.
Ceteris paribus, enterprises which have between 10 and 49 employees are significantly more flexible than others in their sector. This result confirms our hypothesis about the relationship between the flexibility of small enterprises and the size of enterprises. This relationship is, however, not linear. This implies that the sector’s ’real’ SMEs are more mobile and more solution-seeking than micro-enterprises with fewer than 10 employees or medium-sized enterprises with more than 50 employees. These larger SMEs – which are also typically older – are more stable and less reliant on making changes to survive. Micro- enterprises with fewer than 10 employees – which are typically younger – have probably not gained enough experience to want to make changes.
Table 8: Variables affecting small enterprise solution-seeking – logistic regression model [Exp(B)]
Variables Model 1.
Solution-seeking
SIZE (ref: 1-9 employees) ***
10-49 employees 1.446***
50-249 employees 1.064
SECTOR (ref: business services) **
Processing industry 1.419***
Building industry 1.205*
Trading 1.163
Tourism and transportation 1.184
OWNERSHIP CHARACTERISTICS
(ref: professionals among owners) 1.236***
INTEREST IN OTHER ENTERPRISES (ref: not more
than 10 % ownership in other enterprises) 2.065***
MMARKET SCOPE (ref: regional) ***
Nationwide 1.354***
International 1.103**
YEAR OF STUDY (ref: 2006) 1.189***
Constant 0.482***
N 1842
-2Log Likelihood 2212.7
Chi-square 140.3
X significance 0
Note: The dependent variable is ‘solution-seeking’ – where 1 means ‘active solution-seeking’.
p*< 0.05, p** < 0.01, p*** < 0.001.
Concerning the influence of the sector, results show that processing industries and construction industry SMEs are more inclined towards to flexibility and development. For the processing industry this can be explained by the sector’s capital strength. The construction industry’s usual liability problems may be the cause of the openness of their enterprises.
Ownership characteristics had a significant effect: when SMEs ownership was dominated by family members, friends or acquaintances the enterprises were more solution-seeking, which implies protective behavior.
The scope of the market also had a significant effect on the level of solution-seeking behaviors: SMEs that had national and international markets were more solution-seeking than regionally oriented ones. This effect was not linear: international enterprises demonstrated less solution-seeking behavior than nationwide enterprises. This may be because internationally-oriented enterprises have significantly more diverse markets and therefore receive more information and stimuli, which results in them having more innovative attitudes and more opportunities to change.
Results also show that there was a strong positive connection between solution-seeking behaviors and the time/year of measurement. In 2010 the SME sector was more pro-development than in 2006. Perhaps the economic recession affected the SMEs and they recognized that to continue to exist it was necessary to break with previous routines and develop further.
5. SOLUTION-SEEKING AND ENTERPRISE PERFORMANCE
Based on the former findings we examined whether active solution-seeking behavior was linked to the financial success of enterprises. The next step was to measure the relationship between solution-seeking behavior and enterprise performance.
Table 9 compares the basic statistical characteristics of the actively solution- seeking and moderately (or not at all) solution-seeking SMEs.
Table 9: Enterprises with different levels of solution-seeking in 2006 and 2010
Name
2006 2010
Level of solution-seeking Level of solution-seeking High Average
or low p High Average
or low p
Successful enterprises based on after-tax performance per employee
0.44 0.41 0 0.39 0.31 0
Successful enterprises based on total after-tax performance
0.92 0.9 0.002 0.85 0.82 0.003
N 344 698 335 678
Note: Successful enterprises were defined as being those which had an annual after-tax performance per employee of higher than 500 000 HUF, and those which had a positive annual after-tax performance per se.
We used several indices to measure market and business effectiveness (see Table 9). The results show that the more solution-seeking SMEs are more profitable than moderately or non-solution-seeking ones.
We used estimates from a logistic regression model to measure the relationship between solution-seeking and the performance of enterprises.21 This multi-variable measurement was used to test if the more solution-seeking enterprises performed better, in financial terms.
The dependent variables were successful enterprises based on after- tax performance per employee (more than 500 000 HUF) (Model 2.) and enterprises with positive after-tax performance (Model 3.). Table 10 shows the relationship between enterprise performance and solution-seeking attitudes.22 The solution-seeking measure was a binary variable with a reference category of a moderately or less-than-average solution-seeking group of enterprises.
21 Calculations were based on our 2006 and 2010 samples.
22 For this model we included enterprise size, ownership characteristics and time of measurement variables.
Table 10: Active solution-seeking and performance – Logistic regression model on one sample [Exp(B)]
Variables 2. model 3. model
SOLUTION-SEEKING
(ref: average or low level of solution-seeking) 1.290*** 1.458**
SIZE (ref: 1-9 employees) *** **
10-49 employees 2.695*** 1.730**
50-249 employees 1.310** 1.196
OWNERSHIP CHARACTERISTICS
(ref: Professional ownership) 1.235** 0.923
YEAR OF STUDY (ref: 2006) 0.62 0.967**
Constant 0.629*** 0.399***
N 1294 1677
-2Log Likelihood 1680 676.5
Chi-square 44.6 107
X significance 0 0
Note: p*< 0.05, p** < 0.01, p*** < 0.001.
The results of the two regression models for SME solution-seeking and effectiveness are no different from each other. Table 10 illustrates that an enterprises’ solution-seeking behavior is significantly and positively correlated with their economic success. Put simply, SMEs which actively seek to develop are more financially successful than other firms.
The results confirm the previously-stated finding about enterprise size and ownership characteristics. ’Real’ (10-49 employees) and medium-sized (50-249 employees) enterprises are significantly more effective and more open to development than micro-enterprises with fewer than 10 employees.
Ownership characteristics are significantly correlated to successful enterprise performance (but just in Model 3; see Table 10): family, friendly or acquaintance-owned enterprises are more financially successful and flexible.
In both models the time of measurement had a major effect: the number of profitable enterprises decreased between 2006 and 2010. This result implies that the economic regression has decreased the profitability of the SME sector.
Results show that there is a strong relationship between an enterprises’
willingness to innovate and their economic performance. Those SMEs which seek new opportunities and which are open to innovating are likely to be more financially successful.
6. SUMMARY
Our research was based on the SME component of the Hungarian Financial Culture surveys of 2006 and 2010. We analyzed the innovative ability of SMEs and the relationship between active solution-seeking attitudes and profitability and success. Based on previous SME studies we hypothesized that Hungarian SMEs would be traditional in outlook and have low levels of innovation, but would be becoming more open to change.
Based on the assumption that internet banking, changes in financial service providers, competition for developmental resources and investment activity would be indicators of SME openness we analyzed changes in these variables between 2006 and 2010. Results were in line with our expectations:
all of these activities (except for investment activity) increased, indicating a growing level of SME openness between 2006 and 2010.
It was hypothesized that the above-mentioned variables were indirect measures of innovative ability and behavior. Accordingly, an SME solution- seeking index was created and named enterprise solution-seeking; possible values ranged between 0 and 4. The sample mean for this index in 2006 was 1.97 and 1.98 in 2010. We summarized categorical variables (calculated from the solution-seeking index) into the categories of more open than average and absolutely open SMEs, to actively solution-seeking (which was true of one third of both samples from 2006 and 2010).
Furthermore, we analyzed the relationship between active solution-seeking attitudes and other enterprise characteristics. The results of our multivariable analysis show that the factor which affects solution-seeking ability the most is interest in other enterprises, although other factors such as enterprise size, enterprise sector, ownership characteristics and market scope have also significant explanatory power. The effect of market scope indicates that domestic enterprises with national markets are more innovative and that they implement changes more often. This finding has implications for economic policy because it highlights that European and government programs which focus on assisting local SMEs are being hindered in achieving their goals.
The second step of the research was to analyze the relationship between active solution-seeking and economic performance. The results of logit estimation show that SMEs that are actively solution-seeking perform better than those with moderate levels of solution-seeking or those who do not seek to develop at all.
These findings raise the question of how long SMEs which are weak at financial innovation can be effective in a market where larger enterprises may be employing high levels of technological and financial innovation.
REFERENCES
Andrási Zoltán – Borsi Balázs – Farkas László – Némethné Pál Katalin – Papanek Gábor – Viszt Erzsébet (2009), A mikro-, kis és közepes vállalatok növekedésének feltételei, Budapest, GKI Gazdaságkutató Zrt.
Antalóczy Katalin – Sass Magdolna (2011), ”Kis- és közepes méretû vállalatok nemzetköziesedése – elmélet és empíria”, Külgazdaság Vol. 55, No. 9-10, pp. 22- 33.
Bajmóczy Zoltán (2007), “Tudásintenzív üzleti szolgáltatások szerepe az innovációs rendszerben”, In: Makra Zsolt, ed., A technológiaorientált kisvállalkozások jellegzetességei és fejlesztése Magyarországon, Szeged, Universitas Szeged, pp.
179-205.
Bartha Attila – Matheika Zoltán (2009), “A magyar kis- és középvállalatok innovációs aktivitása és innovációpolitikai preferenciái egy felmérés tükrében”, Külgazdaság Vol. 53, No. 7-8, pp. 68-88.
Bartha Attila – Czibik Ágnes – Makó Ágnes – Tóth István János (2009), A gazdasági válság vállalati szemmel. Mûhelytanulmányok 44. Budapest, MKIK GVI – Kopint- Tárki Zrt.
Benke Zoltán (2011), “A magyar kis- és középvállalatok nemzetköziesedése a mérnöki tevékenységet, mûszaki kutatás-fejlesztést végzõ vállalatok körében”, Külgazdaság Vol. 55, No. 9-10, pp. 101-121.
Bilek Péter – Borkó Tamás – Czakó Veronika – Pellényi Gábor (2006), A mikro-, kis-, és középvállalkozások külsõ forrásbevonásának alakulása 2000-2005 között, Budapest, Gazdasági és Közlekedési Minisztérium.
Bruszt László – Vedres Balázs (2010), “Local Development Agency from Without”, http://www.personal.ceu.hu/staff/ BalazsVedres/papers/bruszt.vedres.
developmental.agency.pdf
Csizmadia Zoltán (2008), “Együttmûködés és újítóképesség – Az innováció regionális rendszerének kapcsolathálózati alapjai”, Szociológiai Szemle Vol. 18, No. 2, pp.
22-56.
Csizmadia Zoltán – Grosz András (2002), “Szervezet-központú hálózatok: az ipari parkok térségi-intézményi kapcsolatrendszerének és együttmûködési aktivitásának szerkezeti jellemzõi”, Tér és Társadalom Vol. 16, No. 2, pp. 53-81.
Csonka László (2011), “Kutatás-fejlesztés és innováció a nemzetköziesedés tükrében – a magyar információtechnológiai ágazat kis- és középvállalatainak esete”, Külgazdaság Vol. 55, No. 9-10, pp. 34-56.
Czakó Ágnes (1997), “Kisvállalkozások a kilencvenes évek elején”, Szociológiai Szemle Vol. 7, No. 3, pp. 93-116.
Czakó Ágnes (2010), “Vállalkozások, innováció, pénzügyek”, In: Czakó Ágnes – Husz Ildikó – Szántó Zoltán, eds., Meddig nyújtózkodjunk? A magyar háztartások és vállalkozások pénzügyi kultúrájának változása a válság idõszakában, Budapest, BCE Innovációs Központ Nonprofit Kft., pp. 131-142.
Czakó Ágnes – Vajda Ágnes (1993), Kis- és középvállalkozók, Budapest, Magyar Vállalkozásfejlesztési Alapítvány.
Czakó Ágnes – Kuczi Tibor – Lengyel György – Vajda Ágnes (1994), Vállalkozások és vállalkozók 1993, Budapest, KSH–BKE Szociológia Tanszék.
Czakó Ágnes – Kuczi Tibor – Lengyel György – Vajda Ágnes (1995), “A kisvállalkozások néhány jellemzõje a kilencvenes évek elején”, Közgazdasági Szemle Vol. 42, No. 4, pp. 399-419.
Czakó Ágnes – Gyõri Ágnes (2012), “A kisvállalkozások megoldáskeresõ magatartása, 2010”, Pro Publico Bono Online, Támop Speciál 2012, pp. 1-15. http://www.
propublicobono.hu/index.php?list=1&b=&mode=3
Czibik Ágnes – Makó Ágnes – Tóth István János (2009), The Business Situation of the Hungarian Enterprises and Their Responses to the Economic Crisis, Budapest, MKIK GVI, http://www.gvi.hu /data/research/CIRET_crisis_paper_
RIEE_091028.pdf
Csubák Tibor Krisztián (2003), A kis- és középvállalkozások finanszírozása Magyarországon, Ph.D. thesis, Budapesti Corvinus Egyetem.
Fazekas Károly – Molnár György, eds. (2010), Munkaerõpiaci tükör 2010, Közelkép.
A válság munkapiaci szemmel, Budapest, MTA KTI.
Gyõri Ágnes (2012), “A racionális kisvállalati gazdálkodás tényezõi, 2006-2010”, Közgazdasági Szemle Vol. 59, No. 2, pp. 189-219.
Halpern László – Muraközy Balázs (2010), “Innováció és vállalati teljesítmény Magyarországon”, Közgazdasági Szemle Vol. 57, No. 4, pp. 293-317.
Hanti Szilvia (2011), “Az e-banking és a bizalom Magyarországon a lakosság körében”, In: Czakó Ágnes – Husz Ildikó – Szántó Zoltán, eds., Meddig nyújtózkodjunk?
A magyar háztartások és vállalkozások pénzügyi kultúrájának változása a válság idõszakában, Budapest, BCE Innovációs Központ Nonprofit Kft., pp. 69-84.
Inzelt Annamária (2003), “A kicsik K+F és innovációs tevékenysége”, Külgazdaság Vol. 47, No. 11, pp. 24-42.
Inzelt Annamária (2011), “Innováció és nemzetköziesedés a kicsik világában. Egy e-felvétel eredményei”, Külgazdaság Vol. 55, No. 9-10, pp. 122-154.
Inzelt Annamária – Szerb László (2003), “Az innovációs aktivitás vizsgálata ökonometriai módszerek alkalmazásával”, Közgazdasági Szemle Vol. 50, No. 11, pp. 1002-1021.
Kállay László – Kõhegyi Kálmán – Kissné Kovács Eszter – Maszlag Ludmilla, eds.
(2009), A kis- és középvállalkozások helyzete 2008, Budapest, Nemzeti Fejlesztési és Gazdasági Minisztérium, http://www.ngm.gov.h/data/cms2009046/kkvk_
helyzete2008.pdf
Kepka Éva (2011), “A KKV-k e-bank használata”, In: Czakó Ágnes – Husz Ildikó – Szántó Zoltán, eds., Meddig nyújtózkodjunk? A magyar háztartások és vállalkozások pénzügyi kultúrájának változása a válság idõszakában, Budapest, BCE Innovációs Központ Nonprofit Kft., pp. 167-174.
Kuczi Tibor (1996), “A vállalkozások társadalmi tõkéi az átalakulásban”, Századvég Nyári szám, pp. 25-41. o.
Kuczi Tibor (1998), “Kreácsolás”, Kritika No. 5, pp. 18-21.
Kuczi Tibor (2000), Kisvállalkozás és társadalmi környezet, Budapest, Replika Kör.
Laki Mihály (1994), “A magánvállalkozások növekedési esélyei Magyarországon”,
Külgazdaság Vol. 38, No. 12, pp. 41-54.
Laky Teréz (1998), “A kisvállalkozások növekedésének korlátai”, Szociológiai Szemle Vol. 8, No. 1, pp. 23-39.
OECD (2005), SME and Entrepreneurship Outlook, Paris, OECD.
Papanek Gábor–Borsi Balázs–Tompa Tamás (2006), “A magyar gazdaság versenyképességét magyarázó tényezõk”, Külgazdaság Vol. 51, No. 3-4, pp. 10- 38.
Román Zoltán (2006), A kis- és középvállalatok és a vállalkozási készség, Budapest, KSH.
Sass Magdolna (2011), “Magyar orvosimûszer-gyártó kis- és középvállalatok nemzetköziesedésének jellemzõi és néhány tényezõje”, Külgazdaság Vol. 55, No.
9-10, pp. 57-77.
Semjén András – Tóth István János (2010), “A válság lehetséges hatásai a be nem jelentett foglalkoztatásra”, In: Fazekas Károly – Molnár György, eds., Munkaerõpiaci tükör 2010, Közelkép. A válság munkapiaci szemmel, Budapest, MTA KTI, pp. 149-170.
Szabó Antal (2010), Mit értünk kisvállalkozásfejlesztési politikán? Budapest, BCE, Kisvállalkozás-fejlesztési Központ, http://www.vallalkozastan.hu/data/
pagecontent /0/ERENET/kkv_politika_paradigma_szabo.pdf
Szabó-Morvai Ágnes (2010), A válság hatása a kis- és középvállalkozásokra, Budapest, HÉTFA Kutatóintézet.
Szerb László – Ulbert József (2009), “The Examination of the Competitiveness in the Hungarian SME Sector: A Firm Level Analysis”, Acta Politechnica Hungarica Vol. 6, No. 3, pp. 105-123.
Vajda Ágnes (1997), Mûködõ és megszûnt vállalkozások tevékenysége, a tulajdonosok demográfiai összetétele, jövedelme, Budapest, Magyar Vállalkozásfejlesztési Alapítvány.
APPENDIX
Table A1: Distribution of enterprises which were included in the research compared to the number of Hungarian enterprises of different sizes (2006 and 2010).
(Num., %)
2006
Enterprises in our study Hungarian enterprises Proportion of enterprises in our study compared to total Hungarian
enterprises
Size category number num.
distribution
%
Number num.
distribution
% Enterprise without
employee and microenterprise (1-9 persons)
121 10 662.825 95 0.02
Small enterprise
(10-49 persons) 551 47 29.388 4 1.8
Medium enterprise
(50-249 persons) 519 43 5.933 1 8.7
Total SME sector 1191 100 698,146 100 0,17
2010
Enterprises in our study Hungarian enterprises Proportion of enterprises in our study compared to total Hungarian
enterprises
Size category number num.
distribution
%
Number num.
distribution
% Enterprise without
employee and microenterprise (1-9 persons)
185 16 666.353 95 0.03
Small enterprise
(10-49 persons) 452 38 18853 3 2.4
Medium enterprise
(50-249 persons) 555 46 15230 2 3.6
Total SME sector 1192 100 700.436 100 0.17
Table A2: Distribution of SMEs according to main variables (%) Variables
Year of data collection
2006 2010
Size category by number of employees
Micro-enterprises (1-9 employees) 10.2 15.5
Small-enterprises (10-49 employees) 46.3 37.9
Medium-enterprises (50-249 employees) 43.6 46.6
N 1191 1192
After-tax performance per employee
Loss or no profit 8.5 20.3
Between 1 and 500 000 HUF 47.6 44.3
More than 501 000 HUF 43.9 35.3
N 693 880
Ownership characteristics
Family, friendly or acquaintance owned enterprises 53.1 54.6
Ownership by professional 46.9 45.4
N 1162 1121
Sector
Processing industry 17.3 34.4
Building industry 16.0 12.6
Trading 30.1 24.8
Tourism and transport 10.3 11.5
Business services 26.3 16.7
N 1134 1183
Market scope
Regional 18.8 19.0
Nationwide 58.0 50.8
International 23.1 30.2
N 1194 1094
Interest in other enterprises
Existing interest 20.7 23.5
No interest 79.3 76.5
N 1193 1199
Table A3: Reasons SMEs refuse to use e-banking services (%) Why does your enterprise not use internet banking services?
Reason 2006
N2006=394
2010 N2010=134
Unsafe 23.8 24.6
Impersonal 29.2 9.7
Needs the help and advices of administrator 9.6 3.7
Does not know the software 6.1 8.2
Does not use computer, not competent 5.5 0
Other answer 25.6 53.7
Total 100 100
Table A4: Factors affecting the active solution-seeking behavior of SMEs –Logit models for the 2006 and 2010 samples [Exp(B)]
Variables
Solution-seeking behavior of small-enterprises
2006 2010
SIZE (ref: 1-9 employees) * ***
10-49 employees 1.231** 1.441***
50-249 employees 1.118 1.208**
SECTOR (ref: business services) * **
Processing industry 1.496** 1.776***
Building industry 1.008 1.112
Trading 0.984 1.106
Tourism and transportation 1.425* 1.205
OWNERSHIP CHARACTERISTICS (ref: Professional ownership)
1.459*** 1.208
INTEREST IN OTHER ENTERPRISES (no more than 10 % ownership in other enterprises)
1.725*** 2.179***
MARKET SCOPE (ref: regional) ** **
Nationwide 1.234** 1.421***
International 0.862 1.128
Constant 0.461*** 0.423***
N 917 924
-2 Log Likelihood 1133.7 1094.4
Chi-square 36.8 76.2
X significance 0.00 0.00
Note: p*< 0.05, p** < 0.01, p*** < 0.001.


![Table 8: Variables affecting small enterprise solution-seeking – logistic regression model [Exp(B)]](https://thumb-eu.123doks.com/thumbv2/9dokorg/932305.53318/14.629.81.540.324.705/table-variables-affecting-enterprise-solution-seeking-logistic-regression.webp)

![Table 10: Active solution-seeking and performance – Logistic regression model on one sample [Exp(B)]](https://thumb-eu.123doks.com/thumbv2/9dokorg/932305.53318/17.629.90.546.127.399/table-active-solution-seeking-performance-logistic-regression-sample.webp)


