Introduction
The post-industrial revolution, which can also be labelled as the revolution of informa- tion, signalled the beginning of a new era cre- ating new socio-economic order in the world, where the notion of competitiveness has been completely re-evaluated. As a growing body of literature demonstrates the economic com- petitiveness of regions and countries increas- ingly depends on those branches where the added value is based upon knowledge and creativity. According to Kao, J. (1996) we are in the age of creativity, where economic and social development increasingly depends on creative thinking.
International experience shows that in economic competition – along with informa- tion and its flow – a growing role is played by creativity (and particularly by culture),
invention and innovation (Hall, P. 1998;
Lambooy, J.G. 1998). The importance of creativity, knowledge and innovation has never seemed as decisive as in the early 21st century. Regarding the future development of the European metropolitan regions the emphasis is more and more on the question how these city-regions will be able to attract and integrate firms from the sphere of the creative economy and its labour in the future (Glaeser, E.L. 2005).
Since the 1990s, the importance of geograph- ical location has enjoyed a revival in economic- geographical theories. We should speak of new types of agglomeration economies in the cur- rent ‘post-industrial’ or ‘post-Fordist’ era. Only metropolitan regions that are creative enough will survive global competition (Törnqvist, G. 1983; Andersson, A. 1985; Hall, P. 1998).
Phelps, N.A. and Ozawa, T. (2003) have high-
Changing geography of the creative economy in Hungary at the beginning of the 21
stcentury
Tamás EGEDY1, Zoltán KOVÁCS2 and Balázs SZABÓ1
Abstract
The Hungarian economy has gone through rapid transformation and modernization since the political changes of 1989/90. One of the signs of successful economic restructuring and re-integration to the world economy was the growing role of creative economy. In the present paper we analyse the changing geographical pat- tern of creative economy in Hungary, based on longitudinal statistical data. Our findings suggest growing core-periphery relations in the spatial pattern of creative economy, especially since the recent financial crisis.
The relative weight of Budapest and its urban region has been continuously growing and even major regional centres are unable to keep pace with the Hungarian capital. We also found that cities in the Hungarian urban system became highly differentiated according to their attractiveness for creative firms and labour, and there is a growing competition among secondary cities for knowledge based and creative activities. The growing geographical concentration of the creative economy (especially the knowledge intensive industries) is partly the result of previous neoliberal regional and urban policies.
Keywords: creative economy, urban hierarchy, creative city, financial crisis, Budapest, Hungary
1 Geographical Institute, Research Centre for Astronomy and Earth Sciences, MTA. H-1112 Budapest, Budaörsi út 45. E-mails: egedy@gmx.net, szbazs@gmail.com
2 Geographical Institute, Research Centre for Astronomy and Earth Sciences, MTA. H-1112 Budapest, Budaörsi út 45. E-mail: zkovacs@iif.hu; Department of Economic and Social Geography, University of Szeged. H-6722 Szeged, Egyetem u. 2. E-mail: zkovacs@geo.u-szeged.hu
lighted the main shifts in agglomeration factors from the late industrial to the post-industrial or post-Fordist era (e.g. shift from town-with- suburbs to the global city-region, from hierar- chically organised monocentric structures to polycentric structures, from manufacturing to services etc.). It is not surprising, therefore, that scientific, economic and political interest in cre- ative economy has significantly grown since the beginning of the new millennium (DCMS 1998; Musterd, S. et al. 2007; Howkins, J. 2013).
As a consequence of the shift from the Fordist production system to the post-Fordist economy metropolitan regions have acquired an ever growing importance and became cen- tres of economic and social development of countries and regions. Big cities and metro- politan regions play a prominent role; in ad- dition, due to their size and population num- ber, they represent a considerable material, spiritual and intellectual “mass” (Malecki, E.J. 1987). Nowadays, the creative economy is increasingly concentrated in large cities and metropolitan regions. Cities with strong creative sectors – especially new-economy industries, such as high technology produc- tion, business and financial services, media and cultural-products industries, and neo-ar- tisanal manufacturing – are in the vanguard of this trend (Scott, A.J. 2004). With inte- grated global markets and the advent of new technologies there has been a search for new sources of competitive advantage (Landry, C. and Bianchini, F.F. 1995; Landry, C. 2000;
Rantisi, N.M. et al. 2006).
As an acknowledgement of the global trends a row of policy measures aimed at developing the creative economy have been formulated and implemented at the EU level in the last three decades. Among them the European Capitals of Culture (ECOC) initia- tive launched in 1985 should be mentioned, or the MEDIA programme between 1990 and 2013 aimed at supporting the audiovisual in- dustry, but we can also refer to the Culture 2000 programme between 2000 and 2006, and its continuation the Culture programme (2007–2013), or the current Creative Europe framework programme (2014–2020), which
is an overarching cultural policy of the EU (Schlesinger, P. 2018). Countries of East Central Europe joined these programmes after their accession to the EU in 2004 (and 2007), in addition, the socio-economic and territorial aspects of creative economy be- came one of the focal points of the EU re- search programmes (FP6, FP7) in which post-socialist countries also actively partici- pated. Subsequently, scientific publications applying the concept of creative cities have gradually increased in East Central Europe.
Analysing the growing body of litera- ture focusing on creative economy in East Central Europe we can define three main strands of publications. Firstly, interna- tional comparative research projects yielded a lot of insights about the state-of-the-art of the creative economy in the region, e.g.
Ságvári, B. and Desewffy, T. 2006; Musterd, S. and Murie, A. 2010; Lazzeretti, L. 2012;
Musterd, S. and Kovács, Z. 2013; Chapain, C. and Stryjakiewicz, T. 2017. Secondly, country-based statistical analyses focus- ing on the macroeconomic position and regional pattern of creative economy have been mushrooming, e.g. Murovec, N. and Kavas, D. (2012b) in Slovenia, Slach, O.
et al. (2013) in Czechia, Vitálišová, K.
et al. (2013) in Slovakia, Kasprzak, R. (2015) and Ratalewska, M. (2016) in Poland, and Toma, S-G. et al. (2018) in Romania. The third group of papers deals with the spatial characteristics of creative economy in cities and metropolitan regions, e.g. Kovács, Z.
et al. (2007), Egedy, T. and Kovács, Z. (2009) and Lengyel, B. and Ságvári, B. (2011) in Hungary, Bednár, P. and Grebenícek, P.
(2012) in Czechia, Murovec, N. and Kavas, D. (2012a) in Slovenia, Stryjakiewicz, T.
and Męczyński, M. (2010) and Namyślak, B.
(2014) in Poland, Petrikova, K. et al. (2015) and Baculáková, K. (2018) in Slovakia.
With this paper we would like to con- tribute to the second and third groups of papers. The main aim of this article is to analyse the changing geographical pattern of creative economy in Hungary, based on longitudinal statistical data. Using statistics
regarding the number of creative firms and employees, as well as revenues, the main temporal and spatial development trends of the creative economy in Hungary, as well as the restructuring processes within the sector will be highlighted. In the context of terri- torial shifts, we will also concentrate on the distribution of the creative and knowledge intensive sectors within the urban system.
Theoretical background The creative economy
To date there is no universally accepted definition for creative economy, and there is no consensus among researchers which activities belong to the creative economy (Cunningham, S. 2002). The Department for Digital, Culture, Media & Sport (DCMS) of the UK government defines those activities as part of the creative economy which are based on personal creativity, knowledge and talent and which create jobs and value added through the generation and utiliza- tion of intellectual property (DCMS 2001, 4.).
According to Howkins, J. (2013) economics of creativity deals predominantly with two value systems: one is based in the physical product, the tangible value, another one is based on intellectual property, which is in- tangible. UNCTAD (2008, 15) defined the creative economy as an evolving concept based on creative assets potentially gener- ating economic growth and development that can foster income-generation, job crea- tion and export earnings while promoting social inclusion, cultural diversity and hu- man development. The creative economy embraces economic, cultural and social as- pects interacting with technology, intellec- tual property and tourism objectives. It is a set of knowledge-based economic activities with a development dimension and cross- cutting linkages at macro and micro levels to the overall economy.
Based on our previous research experi- ences we classify creative activities into two
groups: creative industries and knowledge intensive industries (Musterd, S. et al. 2007).
The group of creative industries is very di- verse. The ‘hard core’ of these creative in- dustries is often labelled ‘cultural industries’.
Throsby, D. (2001) distinguishes the cultural industries more or less synonymous with the creative arts. He ranges them in a hierarchy ranked on ‘pure’ creativity: at the centre are the ‘arts’ and (core creative arts like litera- ture, music, performing arts or visual arts, and other core cultural industries), on the outside more ‘applied’ creative skills (wider cultural industries and related industries).
Scott, A.J. (2004) suggests calling the sector cultural commodity production and within cultural-product industries two categories should be distinguished: firstly, service out- puts that focus on entertainment, edification, and information and secondly, manufac- tured products through which consumers construct distinctive forms of individuality, self-affirmation, and social display. Symbolic value and function appear as a characteristic feature of these industries.
Cultural industries can have intensive links with several other creative economic branch- es, as well as with creative departments of various production activities. The wide array of creative activities developed around the cultural industries is most often called ‘crea- tive industries’. According to the UNCTAD (2008, 11) creative industries engage with the cycles of creation, production and distribu- tion of goods and services that use creativ- ity and intellectual capital as primary in- puts. They are at the cross-road among the artisan, services and industrial sectors and constitute a new dynamic sector in world trade. Creative industries focus on, but they are not limited to arts, potentially generating revenues from trade and intellectual property rights and they constitute a set of knowledge- based activities as well. Creative industries comprise tangible products and intangible intellectual or artistic services with creative content, economic value and market objec- tives. A large share of these creative indus- tries is highly interrelated with knowledge
intensive activities. Therefore, the circle of creative industries can be extended by cer- tain knowledge intensive industries while defining the creative economy. Knowledge intensive industries should be considered as part of the creative economy not only because they demand highly qualified labour and partly overlap with creative industries but also because some creative industries highly depend on knowledge intensive activities (Broekel, T. and Boschma, R. 2016).
The creative class
The rise of the creative economy has also brought about societal changes in urban ag- glomerations. Within urban societies a new stratum the so-called ‘creative class’ has been gradually formed which according to some commentators highly influence the economic performance and competitiveness of cities and their regions (Florida, R. 2002). Accord- ing to Florida, R. (2002) the competitiveness of city-regions increasingly depends on the size of the creative class and how cities are able to attract creative people. Analysing the role of creativity in economic development and urban and regional success Florida came to the conclusion that Talent, Technol- ogy and Tolerance (3Ts) are important con- ditions (Florida, R. 2002). In his famous 3T model he argued that growth is powered by creative people (Talent), who prefer places that are culturally diverse and open to new ideas (Tolerant), and the concentration of
‘cultural capital’ wedded to new products (Technology). All these result in ‘business formation, job generation and economic growth’. Florida claims that we are enter- ing the ‘creative age’, in which people with original ideas of all sorts will play a central role. According to Florida, R. (2002) “The creative class is comprised of a ‘super crea- tive core’, which consists of a new class of sci- entists and engineers, university professors, poets, actors, novelists, entertainers, artists, architects and designers, cultural worthies, think-tank researchers, analysts and opinion
formers, whose economic function is to cre- ate new ideas, new technology, and/or new creative content”. Beyond this core group, the creative class also includes a wider circle of talent working in knowledge intensive in- dustries (Meusburger, P. 2015).
In the growing body of literature on crea- tive economy there has been increasing criticism on Florida’s creative class theory.
According to Krätke, S. (2010), even if we admit that creative class has been identified correctly, the mixing of different groups defined by Florida cannot be interpreted and examined under a hat, because only the “scientifically and technologically crea- tive” workers had an impact on the local economy and, thus, on the regional GDP.
Hall, P. (2004) pointed out that developing a creative and innovative city is a long and slow process. According to Storper, M. and Manville, M. (2006), not the skills and crea- tivity, but the companies and the agglomera- tion economies are the engines of growth.
From the point of view of urban develop- ment, some authors criticized Florida for supporting only the promotion of a “trendy”
neighbourhood, which can negatively affect the original population living there for a long time (Peck, J. 2005), or even supporting ur- ban transformations that favour higher status people instead of the majority (Pratt, A.C.
2008). This is also confirmed by the view that Florida basically supports a hard city image building with a kind of soft edge by encouraging the creation of a consumption- oriented cultural milieu (Pratt, A.C. 2011).
Martin-Brelot, H. et al. (2009) emphasize that the geographical context of Florida’s theory is obviously weak. Florida’s theory does not take into account the human and personal trajectories and networks as well, that creative professionals may also associate with other people and also places where they had previously lived and worked (Gáková, Z. and Dijkstra, L. 2014).
While Florida puts the emphasis on the attraction of creative people as the secret of economic success, European policies on the creative economy consider the attraction of
creative firms more important. Empirical re- sults of a European research project carried out between 2006 and 2010 (’Accommodating Creative Knowledge – Competitiveness of European Metropolitan Regions within the Enlarged Union’ – ACRE) confirmed that the spatial mobility and settlement of the European creative class is not so much in- fluenced by soft factors – as advocated by Florida – but rather by personal trajectories and hard factors (e.g. wage level). Soft fac- tors play – as opposed to Florida’s concept – a subordinated role. They are more impor- tant, however, in understanding how crea- tive people become attached to a place. Not surprisingly, in the European development pattern of creative economy place, pathway (historical development of an urban region) and personal networks (place attachment and social networks), thus a 3P model, has lot more relevance than Florida’s 3T model (Musterd, S. and Murie, A. 2010; Boross, L.
et al. 2016; Páthy, Á. 2017).
The urban bias of creative activities
According to Costa, P. et al. (2007) there are five main factors that have contributed to the growing interests towards creativity and its impacts on urban development: a) the idea of the ‘creative city’ developed by Landry, C. (2000), Hall, P. (2004) and others;
b) the notion of ‘Creative Europe’ by inter- national research institutions as well as the
“Creative Cities Network” of the UNESCO;
c) Florida’s concept on ‘creative class’; d) the growing importance of the ’creative in- dustries’ within economic analysis (Caves, R. 2002), and e) the valorization of ‘creation and creativity’ in the field of artistic activities analysis in the mainstream body of literature (Throsby, D. 2001). As a consequence of these ideas and concepts the territorial develop- ment and spatial embeddedness of creative economy came into the forefront of academic research over the last two decades.
As Pratt, A.C. and Hutton, T.A. (2012) pointed out one of the main characteristics of
creative economy is its urban bias, especially in its higher value added sectors. Canadian examples demonstrate that highly urbanized areas are attractive locations not only for the creative industries, but also for cultural in- dustries and specialised labour. This aspect of creative activities has been supported by large number of studies. Power, D. and Nielsen, T. (2010) also emphasized this dis- tinctive urban focus of the creative economy.
The relationships between the concentration of creative industries and urban primacy benefit to cities, but at the same time sharpen interregional employment and income dis- parities. Very often major cities stand out as strongholds of the creative economy within their wider hinterland. In fact, this phenom- enon drew the attention to the role of urban hierarchy in the investigation of creative economy, since metropolitan regions seem to be not only echelons of urban hierarchy in terms of population and employment, but also have a disproportionately larger share of creative and knowledge-based industries.
Lorenzen, M. and Andersen, K.V. (2009) investigated altogether 444 cities in eight European countries in order to provide knowledge on the relationship of urban hi- erarchy and the presence of creative class, and compared it to the size distribution of the overall population across European cit- ies. Based on data collected in 2003 and 2007 authors pointed out that even if the presence of the European creative class correlates with the European total population, its distribu- tion constitutes a population hierarchy which differs from the urban hierarchy. Both distri- butions follow the rank-size rule, but the cre- ative class’s distribution has a steeper overall slope (i.e. with the size and rank of the city, the size of the creative class grows more rap- idly than the city’s population). Their results confirmed that the slope across the rank-size distribution is shallower towards the settle- ments on the lower levels of the hierarchy (i.e. the tail end of the distribution) for the creative class than for the total population.
This result also implies that city-size mat- ters and the creative class is less attracted
by smaller cities. Exploiting the theoretical foundations of Christaller’s (1933) central place model, Lösch’s (1940) theory on ur- ban hierarchies and centrality, Zipf’s (1949) rank-size rule and Florida’s (2002) surveys on the creative class, authors found, that there is a good correlation between the size of the general population and the presence of the creative class in European cities, but due to relative diseconomies the tendency of cities to drop off steeply at the tail end is more profound for the creative class than for the general population (Lorenzen, M. and Andersen, K.V. 2009; Lang, T. 2015).
Thus, creative urban hierarchy is distinc- tive from the general population hierarchy in a fundamental way: the rank-size distribu- tion of the creative class indicates a greater proportionate growth than that of the wider population. This can be explained, on the one hand, by the specialized consumption demand of the creative class (first of all bohe- mians have special preferences for consum- ing services than the rest of the creative class and this group is the first to shy away from cities with growing diseconomies and poor services), and on the other hand, by the spe- cialized job preferences of the creative class (the presence of the creative class correlates very highly with the presence of high-tech- nology workplaces).
Similar phenomenon can be observed in the countries of East Central Europe, and in this respect there is no significant difference between the Western and Eastern half of Europe. Using employment statistics Slach, O. et al. (2013) found that the concentration of the employees in creative and cultural in- dustries is very high in Czechia, 40 per cent of the creative class live in Prague and its agglomeration, and the role of secondary cities is very much subordinated (e.g. Brno – 9%, Ostrava – 3%). Thus, location patterns of the creative economy highly correspond to the hierarchy of the urban system in the Czech Republic. This is similar to other Western European countries e.g. Madrid and Barcelona concentrate 45 per cent of the Spanish, Milan and Rome 35 per cent
of the Italian creative labour. Similar trend was pointed out by Pintilii, R. et al. (2017) in Romania where the weight of Bucharest significantly increased in the creative econ- omy after the global financial crisis, and in 2012 49 per cent of the creative employees of the country lived in the capital city and its surroundings. Authors also pointed out the growing dynamism of the periurban zone (suburbs) where properties are significantly cheaper than in the city proper. In the present theme issue Kozina, K. and Bole, D. (2018) also clearly demonstrate the correlation be- tween the position of a city in urban hierar- chy and the weight of creative economy on the example of Slovenia. Thus, irrespective of the legacies of state-socialism the urban geography of the creative economy follows basically similar patterns in the Eastern and Western parts of Europe.
Considering the theoretical foundations of the paper, the main research questions of this study are as follows:
What are the most important temporal and territorial features of the development of the creative economy in Hungary?
Does a creative urban hierarchy exist in Hungary and how can its geographical fea- ture be characterized?
What is the role of the Budapest Metropolitan Region in the creative economy of the coun- try and is there any sign of a polycentric de- velopment in the spatial transformation of Hungarian creative economy?
How did the global economic crisis affect the development of the creative economies in Hungary, and what were the main geo- graphical consequences of the crisis?
Research methods
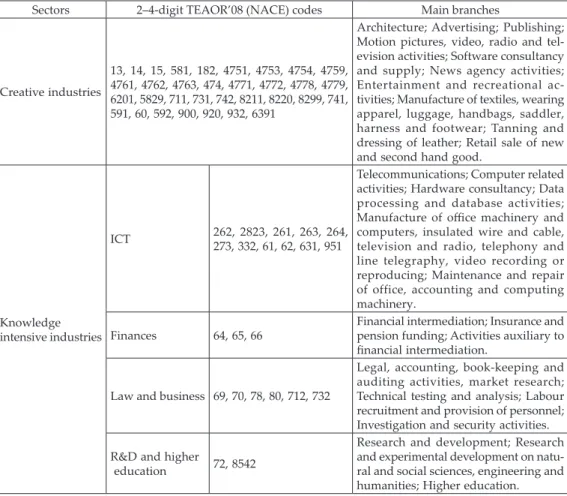
First, on the basis of the international litera- ture (see Musterd, S. et al. 2007) we defined those economic activities and occupations that can be classified as part of the creative economy (Table 1). For the identification of creative economy, the international NACE codes were used, which are predominantly
identical with the TEAOR’08 codes applied by the Hungarian Central Statistical Office (HCSO). Data on the number of enterprises (divided by companies, sole proprietors, and government institutions), their number of employees and annual revenues (in 1,000 EUR) were supplied by HCSO. This set of standardised data was available in a cleaned and structured format for 1999, 2004, 2007, 2011 and 2015. Based on these datasets sta- tistical analyses were carried out in order to detect the temporal and spatial development of creative economy in Hungary.
Due to the proliferation of research results the definition of creative economy has cristal- ised and become more unambiguous in the
last decade. Even though ACRE project de- fined creative economy somewhat broader, for the sake of longitudinal analysis and the comparability of our data sets we apply in this article the traditional ACRE classification of economic activities.
In the first phase of analyses we investi- gated the weight of creative economy and its different sectors at the national level, since the competitiveness of cities largely depends on the share of creative economy (Rechnitzer, J. and Lengyel, I. 2000) and the production of knowledge is highly uneven within the Hungarian urban network (Nagy, E. and Nagy, G. 2010). In the second phase of analyses we investigated the weight of
Table 1. Subdivision of creative economy defined by the ACRE consortium
Sectors 2–4-digit TEAOR’08 (NACE) codes Main branches
Creative industries
13, 14, 15, 581, 182, 4751, 4753, 4754, 4759, 4761, 4762, 4763, 474, 4771, 4772, 4778, 4779, 6201, 5829, 711, 731, 742, 8211, 8220, 8299, 741, 591, 60, 592, 900, 920, 932, 6391
Architecture; Advertising; Publishing;
Motion pictures, video, radio and tel- evision activities; Software consultancy and supply; News agency activities;
Entertainment and recreational ac- tivities; Manufacture of textiles, wearing apparel, luggage, handbags, saddler, harness and footwear; Tanning and dressing of leather; Retail sale of new and second hand good.
Knowledge intensive industries
ICT 262, 2823, 261, 263, 264, 273, 332, 61, 62, 631, 951
Telecommunications; Computer related activities; Hardware consultancy; Data processing and database activities;
Manufacture of office machinery and computers, insulated wire and cable, television and radio, telephony and line telegraphy, video recording or reproducing; Maintenance and repair of office, accounting and computing machinery.
Finances 64, 65, 66 Financial intermediation; Insurance and pension funding; Activities auxiliary to financial intermediation.
Law and business 69, 70, 78, 80, 712, 732
Legal, accounting, book-keeping and auditing activities, market research;
Technical testing and analysis; Labour recruitment and provision of personnel;
Investigation and security activities.
R&D and higher
education 72, 8542
Research and development; Research and experimental development on natu- ral and social sciences, engineering and humanities; Higher education.
Source: Kovács, Z. et al. 2007.
creative economy at the local (settlement) level. In this case the subject of investiga- tion was Hungary’s approximately 3,200 settlements which were devided into five groups according to their size (Budapest, cities above 100 thousand, between 50 and 100 thousand, between 20 and 50 thousand and settlements below 20 thousand inhabit- ants). In the third phase of analyses, cities above 20 thousand inhabitants and Budapest (altogether 61 geographical units) were ex- amined more thoroughly in order to grasp socio-economic aspects of the development of creative economy.
On the one hand, we compared the chang- es in the number of creative employees and total employment between 1999 and 2015 (see results in Figure 4). On the other hand, we elaborated and applied simple rank-order analysis to explore the correlation between the socio-economic profile and the perfor- mance of creative ecnomy in the Hungarian cities above 20 thousand inhabitants. First, indicators for the socio-economic and crea- tive performance of cities have been selected.
For charterizing the socio-economic perfor- mance of a city, on the one hand, economic indicators such as the ratio of enterprises in industry, building industry and mining in 2015 (reflecting the diversity of local econo- my in a negative sense), the number of joint ventures per 1,000 inhabitants in 2015 (entre- preneurial activity), the volume of industrial tax-income in 2013 (business output), and on the other hand social indicators such as pop- ulation change between 2011 and 2015 (rep- resenting population dynamics), the share of university graduates in 2011 (skill level), and the level of unemployment in 2015 (economic activity) have been choosen.
With regard to performance of the crea- tive economy the share of creative compa- nies within the local economy, the share of employees of creative companies within the total number of local employees, and share of annual revenues of creative firms within the total revenues of local firms (each in- dicator for 2015) have been applied. In the next phase of analysis, the 61 investigated
cities were ordered in each indicators in a reversed rank-order where better positions meant higher rank values. The final aggre- gated values for both the socio-economic and crative performance have been created by the arithmetic means of the rank-order positions.
Thus, cities with highest rank values had the best socio-economic and creative economic performance (see results in Figure 5).
The creative economy in Hungary The role of creative and knowledge intensive industries in the light of statistics
According to the registry of the Hungarian Central Statistical Office (HCSO) there were 222 thousand active economic organizations in the country operating in the field of the creative economy at the end of 2015, which made up 32.5 per cent of all active economic organizations registered in Hungary. Firms belonging to the creative economy provided jobs for 845 thousand employees, 22.2 per cent of all employees in the country. The total amount of revenues generated by the sector was 59.5 billion EUR in 2015.
The weight of the creative economy grew in Hungary until the world financial crisis of 2008 when the growth terminated and the number of firms (and to a lesser extent the number of employees and the amount of revenues) sharply decreased (Figure 1). The drop hit most seriously the creative branches, while the knowledge intensive sector was
Fig. 1. The share of creative economy in Hungary (1999–2015, in %). Source: HCSO, National Accounts
1999–2015.
0.0 5.0 10.0 15.0 20.0 25.0 30.0 35.0 40.0
Enterprises Employees Revenues
34.0 36.4 36.7 31.3 32.5 23.0 23.0 24.4 22.2 22.2 22.0 21.222.4 21.7 19.9
2007 2011 2015
1999 2004
less affected. Between 2007 and 2011 approxi- mately 45 thousand creative firms stopped operating, and the number of employees in creative industries decreased by ca. 130 thousand out of which 40 thousand were sole traders (self-employed). The crisis hit most hard some parts of business services (e.g.
graphic design, potography, call-center activ- ities) software consultancy and retailing (e.g.
specilised and second-hand goods). A similar decline in the knowledge intensive sector of the creative economy was not experienced during the economic crisis: the number of firms and their output slowly grew. Between 2011 and 2015, even though the amount of revenues decreased there was a gradual re- generation in the creative industries and in the whole creative economy as well.
Analysing the internal structure of creative economy, it can be noted that the share of firms in the creative industry category accounted for 48 per cent of the creative economy in 2015, with 106 thousand active economic organizations (Table 2). However, at the same time the ratio of creative industries was only 37.8 per cent among the employees and 31.4 per cent regard- ing the total revenues of the creative economy.
This clearly indicates that firms of the creative industries are smaller, employing fewer people and generating less revenue than the average of the creative economy.
Looking at the share of the knowledge in- tensive industries, we find substantial differ- ences among the different sub-sectors. Even though the ICT sector comprises only 9.1 per cent of the firms and 15.8 per cent of the em-
ployees of the creative economy, it produces 33 per cent of its total turnover. Companies in international finances have above average revenues whereas those in law and businesses are below. Economic organizations classified as R&D and higher education are generally bigger with low relative revenue figures. This clearly indicates the dominance of state owned (financed) institutions in the field (e.g. univer- sities, research institutes) providing jobs for 71 per cent of the employees in the sub-sector (see also Szakálné-Kanó, I. et al. 2017).
Between 1999 and 2015 there was a sub- stantial shift within the creative economy reflecting the trend of professionalization and the knowledge-based modernization of the economy. National policies after 2000 clearly supported the development of the knowledge intensive sector, therefore, it is no surprising that the share of knowledge intensive industries increased within the creative economy regarding the number of firms, employees and business turnover as well. At the same time the relative share of creative industries decreased (Table 3). As international comparative research gave evidence, knowledge intensive industries had similar or even higher shares in the economy in East Central European countries than in Western Europe (Musterd, M. and Murie, A. 2010, 12). However, not all sub- sectors of the knowledge intensive industries grew at the same pace. Data reflect the above average dynamism of law and business ser- vices after the financial crisis. Consequently, the weight of professionals providing busi-
Table 2. The composition of creative economy in Hungary, 2015
Industries and economy Enterprises Employees Revenues
Number % Person % 1,000 EUR %
Creative industries (A)
Knowledge intensive industries (B) Infocommunication (ICT) Finances
Law and business services R&D, Higher education Creative economy (A + B) Economy total
106,863 114,772 20,116 20,680 68,659 5,317 221,635 681,922
48.251.8 9.19.3 31.02.4 100.0 –
319,807 525,435 133,226 87,346 235,667 69,196 845,242 3,815,891
37.862.2 15.810.3 27.98.2 100.0 –
18,643,448 40,819,850 19,647,667 11,398,508 8,995,731 777,945 59,463,298 299,561,016
31.468.6 33.019.2 15.11.3 100.0 – Source: HCSO National Accounts, 2015.
ness and legal services but playing limited roles in technological development and inno- vation, the so-called ’dealer class’ (according to Krätke, S. 2010) increased. The outcome of austerity programmes launched to re- duce public expenditure is also obvious, the weight of R&D and higher education stag- nated over the last decade.
The creative economy in the Hungarian urban system
The creative economy has a hierarchically structured pattern in national urban systems, where the weight of the creative economy normally increases with city size. As it was documented in the literature, the locational decisions of creative firms tend to favour larger urban agglomerations (Lorenzen, M.
and Andersen, K.V. 2009). Hungary as a rela- tively small (ca. 10 million inhabitants) and highly centralized state clearly confirms this picture, as there is a high correlation between the weight of creative economy (total number of firms, employees and annual turnover) and the position of a place in the urban hierarchy.
For the sake of analysis, we divided the settlements of Hungary into five classes ac- cording to their size (1 – Budapest; 2 – cities above 100 thousand; 3 – cities between 50 and 100 thousand; 4 – cities between 20 and 50 thousand, and 5 – settlements below 20 thousand inhabitants), and the relative share of creative economy was analysed for these five classes on a temporal basis.
First we analysed the location quotient of firms in the Hungarian settlement system.
The share of the Budapest Metropolitan Region (BMR) has continuously increased in the creative economy of the country over the last one and a half decades, even during the world financial crisis (Figure 2). By 2015 48.3 per cent of the creative and knowledge intensive firms were located in the BMR, even though the metropolitan region was the home for only 38.5 per cent of the firms operating in Hungary. The concentration re- garding the number of employees and rev- Table 3. Changes of the composition of creative economy in Hungary, 1999–2015 Industries and economyEnterprisesEmployeesRevenues
1999 % 2015 % Change, %Change, number 1999 % 2015 % Change, %Change, persons 1999 % 2015 %
Change, %Change, 1,000 EUR Creative industries Knowledge intensive industries Infocommunication (ICT) Finances Law and business services R&D, Higher education Creative economy
62.1 37.9 5.4 6.7 24.8 1.0 100.0
48.2 51.8 9.1 9.3 31.0 2.4 100.0
-13.9 13.9 3.6 2.6 6.2 1.4 –
-19,469 37,652 9,040 7,010 18,276 3,326 18,183
53.9 46.1 11.9 9.1 15.1 10.0 100.0
37.8 62.2 15.8 10.3 27.9 8.2 100.0
-16.1 16.1 3.9 1.2 12.8 -1.8 –
-122,785 147,573 35,615 12,739 111,741 -12,522 24,788
42.6 57.4 35.3 10.3 11.0 0.7 100.0
31.4 68.6 33.0 19.2 15.1 1.3 100.0
-11.3 11.3 -2.3 8.8 4.1 0.6 –
7,784,749 26,203,674 10,654,654 8,767,918 6,192,086 589,017 33,988,423 Source: HCSO National Accounts, 1999, 2015.
enues was even higher. In 2015 56.6 per cent of the creative labour force was employed in the BMR and 64.1 per cent of total revenues generated by the creative economy was con- centrated here. Thus, data reflect a high level of spatial concentration of creative economy within Hungary, with growing trends.
The level of concentration, however, differs among different sub-sectors of the creative economy (Table 4). Taking into account the number of firms, the weight of BMR is out- standing in the field of ICT (57.9%). However, if we take into consideration the share of em- ployees (70.9%) or revenues (95.5%) the pre- dominance of Budapest and its urban region is extraordinary in the field of finances.
As Figure 3 demonstrates the growing weight of Budapest within the creative economy took place at the expense of cities at the lower levels of urban hierarchy, and only settlements (small towns and villages) below 20 thousand inhabitants were able to gain higher share in the creative economy after 1999. Similar trends were recorded re- garding the spatial distribution of creative employees and revenues produced by the creative economy. Thus, we can safely say that the growing geographical concentration of creative economy has shown a clear trend in Hungary in the 21st century, and this is rather alarming for policy makers dreaming about regional levelling out.
There is a growing gap between Budapest and the rest of the country, and between the larger regional centres (e.g. Szeged, Pécs, Győr) and their hinterland (Csomós, Gy. 2015). The dominance of Budapest is outstanding, however, major regional centres still have better positions than smaller cities due to the highly hierarchical distribution of creative activities. The previously dominant east-west dimension in the spatial configura- tion of creative economy has been replaced Fig. 2. The share of Budapest Metropolitan Region in
the creative economy of Hungary (1999–2015, in %).
Source: HCSO, National Accounts 1999–2015.
Table 4. The weight of the Budapest Metropolitan Region (BMR) within the creative economy in Hungary, 2015
Industries and economy Enterprises Employees Revenues
% Creative industries (A)
Knowledge intensive industries (B) Infocommunication (ICT) Finances
Law and business services R&D, Higher education Creative economy (A + B) Economy total
47.549.0 57.932.0 51.449.5 48.338.5
49.660.8 57.170.9 62.250.7 56.643.2
69.761.6 41.995.5 60.378.7 64.152.8 Source: HCSO National Accounts, 1999–2015.
Fig. 3. Distribution of employees of the creative econ- omy by settlement categories in Hungary (1999–2015,
in %). Source: HCSO, National Accounts 1999–2015.
0.0 10.0 20.0 30.0 40.0
Enterprises Employees Revenues
50.0 60.0 70.0
42.2 42.3 43.5 45.5 48.3 47.4 49.0 52.1 53.1 56.6 58.8 58.4 60.9 58.8 64.1
2007 2011 2015
1999 2004
0.0 5.0 10.0 15.0 20.0
Budapest 25.0 30.0 35.0
100,000< 50,000–100,000 20,000–50,000 <20,000 40.0
45.0 50.0
41.9 48.4 14.1 11.0 9.2 20.4 21.8
6.48.9
2007 2011 2015
1999 2004
by the factor of ‘distance from Budapest’, or
‘distance from the nearest regional centre’.
There are substantial differences in the spatial pattern of creative economy within the wider Budapest Metropolitan Region as well. Inside the city proper (i.e. within the administrative boundaries of the city) the elite districts on the Buda side show higher proportions regarding the relative share of creative firms (12th district – 51.8%; 1st dis- trict – 49.8%; and 2nd district – 49.6%), while peripheral districts on the Pest side (e.g. 21th, 23th, 15th–17th districts) have much lower val- ues. In addition, a core-periphery dichotomy is clearly observable inside the compact city.
This pattern corresponds the socio-economic pattern of the city, but the location of crea- tive clusters (along the line of Danube e.g.
InfoPark, ELTE campus, Graphisoft Park) and numerous inner-city oriented cultural and art institutions (theatres, concert halls, museums and galleries etc.) also serve as magnet for smaller creative firms (Kovács, Z. et al. 2010).
Within the suburban zone we can also see marked geographical differences in the con- figuration of the creative economy which is clearly the outcome of suburbanization in the 1990s and early 2000s (Timár, J. 2006). We find municipalities with the highest share of the creative economy in the north-western sector of the agglomeration (e.g. Budajenő 53.6%; Telki 52.1%; Pilisborosjenő 48.2%) where young professionals settled down in great number as part of the suburbanization process (Szirmai, V. et al. 2011; Schuchmann, J. 2012). The south-eastern sector of the ag- glomeration was less affected by urban sprawl and the invasion of intelligentsia.
Consequently, the share of the creative econ- omy is also significantly lower. According to our previous findings (Egedy, T. et al. 2008) new creative firms are created first of all where the founders and managers are living.
Thus, the location of the place of residence is vital for the creative enterprises. Site selection by firms in the Budapest metropolitan region as a rule is strongly influenced by hard factors (e.g. price and infrastructure of office, traffic and public transport), while among
the soft factors calm and quiet environment was mentioned by the managers in the first place. As a consequence, in the process of accommodating new creative firms the agglomeration zone clearly appears as a winner of the economic transition.
We investigated the correlation between the changes in the number of creative employees and the total number of employees (Figure 4), looking at whether an increase or decrease of the total number of employees automatically generates increase or decrease of the number of creative employees. This assumption can be obviously related to international expe- rience on the role of diseconomies and cen- trality discussed in the theoretical part of the paper (see Lorenzen, M. and Andersen, K.V.
2009). Those cities at the tail end of the curve appear to have characteristic diseconomies, where the conditions are less favourable for the development of the local creative class. It is obviously recognizable in the lower ratio of creative workers compared to the share of total employment in these settlements (see position of red and blue bullets). At the other end of the scale, we find cities with flourish- ing local markets, growing number of em- ployees and equally growing group of crea- tive employees. However, it can also be seen on the graph that the shrinkage or growth of the creative labour shows greater volatility especially at the two ends of the scale.
In addition, we analysed the correlation be- tween the socio-economic development of a city (data on the share of university graduates, the level of unemployment, population dy- namics, industrial tax, entrepreneurial activi- ties and diversity of the local economy were converted into one single index) and the per- formance of the creative economy. Our find- ings confirm that larger cities with more diver- sified (multi-layered) economic profile show higher presence of the creative class (marked with green). At the other end of the scale cities with a rather monofunctional single-layered local economy (marked with red) lack crea- tive labour force, which highlights the exisit- ing spatial and functional divisions within the Hungarian urban network (Figure 5).
Fig. 4. Changes in the number of creative employees and total employment between 1999 and 2015 in the Hungarian cities above 20 thousand inhabitants (base year 1999; in %)
Fig. 5. Correlation between socio-economic profile and performance of creative economy in the Hungarian cities above 20 thousand inhabitants
−100
−50 0 50 100 150 200
0 10 20 30 40 50 60
Creative employees Employees
Complex creative economic index
Complex socio-economic development index 70
60
50
40
30
20
10
00 10 20 30 40 50 60
Nagykőrös Békés
Ózd Komló
Salgótarján
Kazinbarcika Várpalota
Hajdúböszörmény
Makó Orosháza Ajka
Dunaújváros Pápa
Karcag
Eger Szombathely
Gyula
Jászberény
Vác
Esztergom Miskolc
Sopron
Budaörs Győr
Budapest Szentendre Székesfehérvár Pécs
Debrecen Szeged Gödöllő Érd
Dunakeszi
Our results correspond to earlier domes- tic and international outcomes that historical pathway and city size play a decisive role in accommodating creative economy. In fig- ure 4 Budapest is followed by two groups of cities: on the one hand, regional centres with strong traditions in higher education, R+D, and a lively cultural life (e.g. Pécs, Székesfehérvár, Debrecen, Szeged), and on the other hand, sub-centres in the agglom- eration of Budapest (e.g. Szentendre, Vác, Érd and Dunakeszi) where the dynamism of the creative economy is very much related to the closeness of the metropolis. At the other end of the scale we find monofunctional in- dustrial centres (e.g. Ajka, Ózd) and agrarian market towns on the plain in South-eastern Hungary (e.g. Makó, Karcag, Jászberény).
These results confirm the findings of previ- ous studies regarding the backwardness of market towns on the Great Hungarian Plain as far as the knowledge based economy is concerned (Nagy, E. and Nagy, G. 2010;
Nagy, E. et al. 2017).
Conclusions
As the literature review at the beginning of this paper demonstrated researchers in East Central Europe rapidly joined the academic discourse on creative economy after the turn of the millennium. This was partly linked to the robust economic restructuring of these countries and the growing role of creative sec- tors, and partly the infiltration of EU policy measures and programmes. Results of inter- national comparative research projects, as well statistical analyses focusing on the macroeco- nomic position and regional pattern of creative economy in various countries became widely published. This paper fits to the second group of studies, as we analyzed the changing geo- graphical pattern of creative economy in Hun- gary, based on longitudinal statistical data.
The Hungarian economy has gone through rapid transformation and modernization since the political changes of 1989/90. One of the signs of successful economic restruc-
turing and integration to the world economy was the growing role of the creative econo- my. However, the growth within the creative economy was rather uneven, the knowledge intensive sectors have shown especially high dynamism. Consequently, the share of crea- tive industries decreased within the creative economy. Even though the world financial crisis of 2008 hit hard the creative economy, and the number of firms and employees have slightly decreased, nevertheless, data reflect clearly a knowledge-based shift in the Hungarian economy.
According to our findings there is a clear correlation between the growth of creative economy and urban hierarchy. The creative economy increasingly concentrates to higher levels of the urban hierarchy, to Budapest and other regional centres (university towns).
The reasons behind are partly economic (ag- glomeration effects, clustering etc.) and partly socio-economic (cultural diversity, social net- works, etc.), but historical traditions and the quality of the built environment, as well as the diversity of neighbourhoods play a role here. Thus, our findings largely confirm the results of Carlino, G.A. and Saiz, A. (2008) on the importance of attractiviness of cities for highly-educated individuals.
Core-periphery relations in the spatial pat- tern of creative economy has increased. As data indicated the relative weight of Budapest and its urban region has been continuously growing and even major regional centres (e.g.
Debrecen, Szeged, Pécs) with strong educa- tional and cultural traditions have been un- able to keep pace with the Hungarian capital.
This makes the territorial configuration of the creative economy very unbalanced, and the economy of the country very fragile. The previously so dominant east-west dichotomy within the country has been replaced by the closeness to Budapest factor in the locational decisions of creative firms. New start-ups in creative economy also increasingly concen- trate to Budapest.
The growing geographical concentration of the creative economy (especially the knowl- edge intensive industries) is partly the result
of previous neoliberal regional and urban policies (e.g. the programme of ’pole-cities’, establishment of technological parks, R&D in- vestments, development of universities etc.) putting competitiveness in the focus.
Our findings also suggest that cities in the Hungarian urban system became highly dif- ferentiated according to their attractiveness for creative firms and creative labour after the global financial crisis, and there is a growing competition among secondary cities for knowl- edge intensive and creative activities. Regional centres and county seats with strong cultural traditions and a solid base of higher education are clearly more favoured by creative firms and labour than monofunctional (agrarian or in- dustrial) cities or other peripheral locations.
All these shed light on the one hand, the path dependent nature of creative economic activi- ties, and on the other hand, the difficulties of peripheral (mostly monofunctional) towns to find their ways to the ’creative age’.
Acknowledgements: Funding for the research leading to this publication was received from the Hungarian Scientific Research Fund (OTKA) Grant Agreement No. K119710.
REFERENCES
Andersson, A. 1985. Creativity and regional devel- opment. Papers of the Regional Science Association 56. (1): 5–20.
Baculáková, K. 2018. Cluster analysis of creative industries in the regions and districts of Slovakia.
Theoretical and Empirical Researches in Urban Management 13. (3): 74–89.
Bednár, P. and Grebenícek, P. 2012. Mapping Creative Industries in the Zlin Region. Journal of Competitiveness 4. (1): 20–35.
Boros, L., Fabula, Sz., Horváth, D. and Kovács, Z.
2016. Urban diversity and the production of public space in Budapest. Hungarian Geographical Bulletin 65. (3): 209–224.
Broekel, T. and Boschma, R. 2016. The cognitive and geographical structure of knowledge links and how they influence firms’ innovation performance.
Regional Statistics 6. (2): 3–26.
Carlino, G.A. and Saiz, A. 2008. City beautiful. IZA discussion papers No. 3778. Bonn, Institute for the Study of Labor (IZA), http://nbn–resolving.de/
urn:nbn:de:101:1–20081126376
Caves, R. 2002. Creative industries: contrast between art and commerce. Cambridge–London, Harvard University Press.
Chapain, C. and Stryjakiewicz, T. 2017. Creative Industries in Europe – Drivers of New Sectoral and Spatial Dynamics. Cham, Springer.
Christaller, W. 1933. Die zentralen Orte in Süddeutschland (Central places in Southern Germany). Jena, Gustav Fischer.
Costa, P., Magalhaes, M., Vasconcelos, B. and Sugahara, G. 2007. A discussion on the governance of creative cities: some insights for policy action.
Norsk Geografisk Tidsskrift / Norwegian Journal of Geography 61. (3): 122–132.
Csomós, Gy. 2015. The ranking of cities as centres of the Hungarian economy, 1992–2012. Regional Statistics 5. (1): 66–85.
Cunningham, S. 2002. From Cultural to Creative Industries: Theory, Industry, and Policy. Media International Australia Incorporating Culture and Policy: Quarterly Journal of Media Research and Resources 102. (1): 54–65.
DCMS 1998. Creative Industries Mapping Document.
http://webarchive.nationalarchives.gov.uk/+/http://
www.culture.gov.uk/reference_library/publica- tions/4740.aspx (retrieved: 12.05.2018)
DCMS 2001. Creative Industries Mapping Document.
http://webarchive.nationalarchives.gov.uk/+/http://
www.culture.gov.uk/NR/rdonlyres/338EFCBC–
F706–4191–A1A4–CCB7EFF7EDAE/0/foreword.
pdf (retrieved: 25.06.2018)
Egedy, T. and Kovács, Z. 2009. The capacity and potentials of Budapest to attract creative economy.
Hungarian Geographical Bulletin 58. (4): 281–294.
Egedy, Z., Balogi, A., Földi, Zs. and Kovács, Z. 2008.
Main drivers for settlement of creative and knowledge in- tensive companies in the Budapest Metropolitan Region – The managers’ view. ACRE Report 6.4, Amsterdam, AMIDSt, University of Amsterdam.
Florida, R. 2002. The Rise of the Creative Class: and How it is Transforming Work, Leisure, Community and Everyday Life. New York, Basic Books.
Gáková, Z. and Dijkstra, L. 2014. Labour mobility be- tween the regions of the EU–27 and a comparison with the USA. Regional Focus, Regional Policy. Brussels, European Commission.
Glaeser, E.L. 2005. Reinventing Boston: 1630–2003.
Journal of Economic Geography 5. (2): 119–153.
Hall, P. 1998. Cities in civilization: culture, innovation and urban order. London, Weidenfeld and Nicholson.
Hall, P. 2004. Creativity, culture, knowledge and the city. Built Environment 3. 256–258.
Howkins, J. 2013. The Creative Economy: How Ppeople Make Money from Ideas. 3rd edition, London, Penguin Books.
Kao, J. 1996. Jamming: The Art and Discipline of Business Creativity. New York, Harper Collins.
Kasprzak, R. 2015. Creative industries in the Polish economy. Quaestiones Geographicae 34. (2): 35–43.
Kovács, Z., Egedy, T., Földi, Zs., Keresztély, K. and Szabó, B. 2007. Budapest: From state socialism to global capitalism – Pathways to creative and knowledge–based regions. ACRE Report 2.4, Amsterdam, AMIDSt, University of Amsterdam.
Kovács, Z., Pethe, H. and Miosga, M. 2010. Policies for firms or Policies for Individuals? Amsterdam, Munich and Budapest. In Making Competitive Cities.
Eds: Musterd, S. and Murie, A., Oxford, Wiley, 286–305.
Kozina, K. and Bole, D. 2018. The impact of territorial policies on the distribution of the creative economy:
tracking spatial patternsof innovation in Slovenia.
Hungarian Geographical Bulletin 67. (3): 259–273.
Krätke, S. 2010. ‘Creative Cities’ and the Rise of the Dealer Class: A Critique of Richard Florida’s Approach to Urban Theory. International Journal of Urban and Regional Research 34. (4): 835–853.
Lambooy, J.G. 1998. Knowledge production, organisa- tion and agglomeration economies. GeoJournal 41.
(4): 293–300.
Landry, C. 2000. The creative city: A toolkit for urban innovators. London, Earthscan.
Landry, C. and Bianchini, F. 1995. The creative city.
London, Demos–Comedia.
Lang, T. 2015. Socio–economic and political responses to regional polarisation and socio–spatial peripher- alisation in Central and Eastern Europe: a research agenda. Hungarian Geographical Bulletin 64. (3):
171–185.
Lazzeretti, L. (ed) 2012. Creative Industries and Innovation in Europe – Concepts, Measures and Comparative Case Studies. London, Routledge.
Lengyel, B. and Ságvári, B. 2011. Creative Occupations and Regional Development in Hungary: Mobility of Talent in a One–centred Transition Economy.
European Planning Studies 19. (12): 2073–2093.
Lorenzen, M. and Andersen, K.V. 2009. Centrality and creativity: Does Richard Florida’s creative class offer new insight into urban hierarchy? Economic Geography 85. (4): 363–390.
Lösch, 1940. Die räumliche Ordnung der Wirtschaft (The economics of location). Jena, Gustav Fischer.
Malecki, E.J. 1987. The R&D location decision of the firm and ‘creative’ regions. Technovation 6. (3):
205–222.
Martin-Brelot, H., Grossetti, M., Eckert, D., Gritsai, O. and Kovács, Z. 2009. Not so mobile
‘creative class’: a European perspective. Gawc Research Bulletin 306. 1–15.
Meusburger, P. 2015. Knowledge environments in universities. Hungarian Geographical Bulletin 64.
(4): 265–279.
Murovec, N. and Kavaš, D. 2012a. Creative industries in Ljubljana urban region. Working paper No. 70.
Ljubljana, Institute for Economic Research.
Murovec, N. and Kavaš, D. 2012b. Economic analyses of the cultural and creative industries in Slovenia.
Our Economy. Journal of Contemporary Issues in Economics and Business 58. (5–6): 23–33.
Musterd, S. and Kovács, Z. (eds) 2013. Place-making and Policies for Competitive Cities. Oxford, Wiley–
Blackwell.
Musterd, S. and Murie, A. (eds) 2010. Making Competitive Cities. Oxford, Wiley.
Musterd, S., Bontje, M., Chapain, C., Kovács, Z. and Murie, A. 2007. Accomodating Creative Knowledge. A lit- erature review from a European perspective. ACRE report 1. Amsterdam, AMIDSt, University of Amsterdam.
Nagy, E. and Nagy, G. 2010. Koncentráció és függőség – a magyar városhálózat az üzleti szolgáltatások térstruktúráiban (Concentration and dependence – Hungarian settlement network in the spatial struc- tures of business services). In A területi kutatások csomópontjai. Eds.: Barta, Gy., Beluszky, P., Földi, Zs. and Kovács, K., Pécs, MTA Regionális Kutatások Központja, 158–182. (In Hungarian)
Nagy, E., Nagy, G. and Dudás, G. 2017. The uneven transformation of consumption spaces and the rise of new marginalities in Hungary. Regional Statistics 6. (2): 149–172.
Namyślak, B. 2014. Cooperation and Forming Networks of Creative Cities: Polish Experiences. European Planning Studies 22. (11): 2411–2427.
Páthy, Á. 2017. Types of development paths and the hi- erarchy of the regional centres of Central and Eastern Europe. Regional Statistics 7. (2): 124–147.
Peck, J. 2005. Struggling with the creative class.
International journal of Urban and Regional Resarch 29.
(4): 740–770.
Petrikova, K., Vanova, A. and Borsekova, K. 2015.
The role of creative economy in Slovak Republic. AI
& Society 30. (2): 271–281.
Phelps, N.A. and Ozawa, T. 2003. Contrasts in agglomer- ation: proto-industrial, industrial and post-industrial forms compared. Progress in Human Geography 27.
(5): 583–604.
Pintilii, R., Peptenatu, D., Ciobotaru, A-M., Toma, S-G., Grigore, A-M., Drăghici, C-C., Dobrea, R., Simion, A., Andronache, I., Teodorescu, C. and Diaconu, D. 2017. Creative economies in Romania – spatial projections and trends. Bulletin of Geography, Socio-economic Series 37. 95–108.