Editor / Felelős szerkesztő Fodor László
Editor assistant/ Szerkesztőségi referens Ambrus Andrea
Chair of the Editorial Board / Szerkesztőbizottság elnöke Liptai Kálmán, rektor
Editorial Board / Szerkesztőbizottság Bai Attila, Debreceni Egyetem Baranyai Zsolt, Budapesti Metropolitan Egyetem
Csörgő Tamás, MTA Wigner Fizikai Kutatóközpont, Eszterházy Károly Egyetem Dazzi, Carmelo, University of Palermo
Dinya László, Eszterházy Károly Egyetem Fodor László, Eszterházy Károly Egyetem Fogarassy Csaba, Szent István Egyetem Helgertné Szabó Ilona Eszter, Eszterházy Károly Egyetem
Horska, Elena, Slovak University of Agriculture in Nitra
Hudáková Monika, School of Economics and Management in Public Administration in Bratislava Káposzta József, Szent István Egyetem
Kőmíves Tamás, MTA ATK Növényvédelmi Intézet Majcieczak, Mariusz, Warsaw University of Life Sciences
Mika János, Eszterházy Károly Egyetem Nagy Péter Tamás, Eszterházy Károly Egyetem
Neményi Miklós, Széchenyi István Egyetem
Németh Tamás, Magyar Tudományos Akadémia, Kaposvári Egyetem Némethy Sándor, Eszterházy Károly Egyetem
Novák Tamás, Eszterházy Károly Egyetem Noworól, Alexander, Uniwersytetu Jagiellońskiego, Krakkow
Otepka, Pavol, Slovak University of Agriculture in Nitra Pavlik, Ivo, Mendel University in Brno
Popp József, Debreceni Egyetem Renata, Przygodzka, University of Bialystok
Szegedi László, Eszterházy Károly Egyetem Szlávik János, Eszterházy Károly Egyetem
Takács István, Óbudai Egyetem Takácsné György Katalin, Óbudai Egyetem
Tomor Tamás, Eszterházy Károly Egyetem Editorial Office / Szerkesztőség
Líceum Kiadó 3300 Eger, Eszterházy tér 1.
Publisher / Kiadó Líceum Kiadó 3300 Eger, Eszterházy tér 1.
Responsible Publisher / Felelős kiadó Liptai Kálmán, rektor HU ISSN 2064-3004
2018
Az Eszterházy Károly Egyetem kiemelt figyelmet fordít kutatási eredményeinek, valamint innovációinak a megismertetésére mind szélesebb körben konferenciák, workshopok, nyomtatott és elektronikus folyóiratok formájában egyaránt.
Ez utóbbi megvalósításához nyújt lehetőséget az intézmény számára a TÁMOP-4.2.3- 12/1/1KONV-2012-0047 „Kutatási eredmények és innovációk disszeminációja az energetikai biomassza (zöldenergia) termelés, átalakítás, hasznosítás a vidékfejlesztés és a környezeti fenntarthatóság terén a Zöld Magyarországért” program, melynek keretében útnak indítjuk a „Journal of Central European Green Innovation (JCEGI)” című elektronikus folyóiratot.
Az intézményben folyó széles körű kutatások egyik kiemelt iránya a zöldenergia minél szélesebb körű hasznosítása, azokon a területeken, ahol erre adottak a lehetőségek, illetve az új innovációkra fogékony a környezet. A vidéki lakosság számára ez kiemelten fontos, hiszen ezeken a területeken egyre nagyobb problémát jelent a megnövekedett fosszilis energiaár, illetve a munkanélküliség, amelyek együttesen kezelhetőek ezen irány előtérbe helyezésével. Kutatásaink során számos területet vizsgáltunk már korábban is – biomassza, speciális fűtőberendezések, speciális fóliatakarások –, melyek azt igazolták vissza, hogy ezt mindenképpen folytatni – a lehetőségek kibővítésével – szükséges.
Az intézmény az Észak-magyarországi régió egyik meghatározó tudásbázisa, küldetésének vallja, hogy a régió fejlődése nem képzelhető el a tudás megosztása és együttműködés nélkül. A folyóirat alapításával teret kíván nyitni a régióban keletkező kutatási és innovációs eredmények publikálásával azok széles körű megismertetéséhez, a fentebb megfogalmazott célok teljesüléséhez.
A szerkesztők
Eszterházy Károly University pays special attention to disseminate its research results and innovations increasingly as widely as possible in conferences and workshops as well as in print and electronic journals.
The implementation of the latter by the institution is aided by the TÁMOP- 4.2.3-12/1/1KONV-2012-0047 program “dissemination of research results and innovations in the field of biomass energy (green energy) production, transfor- mation and utilization in the field of rural development and environmental sustainability for a Green Hungary” in the framework of which the electronic version of the “Journal of Central European Green Innovation” will be launched.
One of the key directions of the wide range of research at the institution is the more widespread utilisation of green energy in areas where the possibilities are appropriate and where the environment is receptive to new innovations. It is particularly important for the rural population since in these areas both the increasing fossil fuel prices and unemployment present an intensifying problem which can be treated simultaneously by giving a priority to this direction. A number of areas – biomass, advanced heaters, the use of special plastic greenhouse covers – have already been examined during our research activities which have confirmed that these experiments must by all means be continued – with a wider range of available possibilities.
The institution is one of the knowledge base of Northern Hungary mission believes that the development of the region cannot be achieved without the knowledge sharing and collaboration. Foundation of the journal would open up the region resulting from the publication of results of research and innovation is broad awareness, the fulfillment of the objectives set out above.
The Editors
Tanulmányok – Scientific Papers ...11 Aranka Baranyi
Tipifying the financial position of the Hungarian Corporate Sector
in the period between 2006 and 2015 ...13 Bozsik Norbert
A kelet- közép európai országok energiafelhasználásának elemzése Analysis of Gross Inland Energy Consumption of the Central
Eastern European Countries ...37 Kozma Gábor – Szilágyiné Czimre Klára – Teperics Károly –
Szabó György – Fazekas István
A megújuló energiaforrások elterjedését szolgáló európai uniós támogatások jellegzetességei a 2007-2013 közötti költségvetési időszakban Magyarországon/
Characteristics of the Funds granted by the European Union Contributing to the Spread of renewable energy sources in Hungary
in the 2007-2013 budget period ...65 Popp József – Harangi-Rákos Mónika – Szenderák János – Oláh Judit
Regionális különbségek a főbb mezőgazdasági ágazatokban Magyarországon
Regional differences between the main sectors in Hungary ...87 A lektorok ...115
JOURNAL OF CENTRAL EUROPEAN GREEN INNOVATION HU ISSN 2064-3004
DOI: 10.33038/JCEGI.2018.6.3.13
Available online at http://greeneconomy.uni-eszterhazy.hu/
TIPIFYING THE FINANCIAL POSITION OF THE HUNGARIAN CORPORATE SECTOR IN THE PERIOD BETWEEN 2006 AND 2015
ARANKA BARANYI
baranyi.aranka@uni-eszterhazy.hu
Abstract
When examining the number of businesses in our country, we conclude that it is under- going continuous transformation. Over the last decade, the corporate sector has not only rejuvenated, but also its financial situation is changing. Improving the performance of the domestic corporate sector is an indispensable driving force for domestic economic growth. In my research, I was examining the financial situation of a couple of businesses operating for ten years, whether it is possible to typify these businesses based on their fi- nancial performance and classify them by statistically supported methods and, if so, how well these groups can be distinguished. 3658 members of the examined SME sector were analysed by factor and cluster analysis. The study was carried out with the processing and analysis of secondary data, the aggregate part of which is from the publicly avail- able source of KSH’s electronic form, while Opten Kft. has provided me another - most important part in June 2017.
Keywords: small businesses, statistical methods, lending, liquidity, profitability JEL code:G21, G31; M21, M4
Introduction
The focus of my research is the analysis and typifying the financial situation of the Hungarian SME sector. I was trying to find out how statistical methods can be used to typify these businesses on the basis of which we can group them. Nearly 4,000 companies were selected for this study, who had annual reports between 2006 and 2015 and an analysis of financial indicators was made possible by their data.
Regarding the timeliness of the topic, it is relevant that in 2013 more than 21 million SMEs offered 88.8 million jobs in the European Union, nine out of 10 SMEs and two SMEs in three jobs. (Bán – Csernák, 2018) By examining the age of companies, experts conclude that they are getting younger, the smaller the number of employees employed by a company, the less likely it is to reach its 10th birthday.
Knowing the financial position of the domestic corporate sector can be useful to corporate sector members, creditors, and, of course, to the state itself, as well. It is not negligible that, apart from their role in employment, enterprises provide a significant income for the central budget and become more and more involved in the social financing of various community tasks.
After the material and methodology section, some of the typical data of the do- mestic corporate sector are presented, and then, based on literature, I describe the financing possibilities of the sector, including loans. Based on the factor and cluster analysis, liquidity and capital strength came to the centre, so the presentation of financing has been justified.
Material and methods
The objective of the analysis is to characterize the situation of the Hungarian SME sector by means of financial indicators, on the basis of which how it is possible to classify the enterprises into different groups and then characterize these enterprise groups.
Material
During the examination, the data of nearly 80,000 enterprises provided by OPTEN Ltd. was sorted by different criteria. The primary consideration was that the companies were in the final database, which had an annual report between 2006 and 2015, and the calculation of the indicators I defined was made possible by their data. A secondary analysis was prepared using the data publicly available by the CSO, followed by a special database analysis involving 3658 companies.
Methods
Analysing the financial position of businesses is important for both internal and external stakeholders, such as owners, employees, buyers and suppliers, creditors and prospective investors alike. (Marion Steven, 2008)
Opten Ltd has provided data from corporate enterprises in 2017, which pro- duced annual reports between 2006 and 2015 and had a 10-year database with predictable criteria. In defining the scope of the specified data, the objective was to apply an objective rating system of a given financial institution. The current
“Regulation No 575/2013 / EU of the European Parliament and of the Council on prudential requirements for credit institutions and investment firms” and applica- tion of Regulation (EU) No 648/2012 makes it compulsory to comply with pru- dential requirements. Accordingly, there is a credit institution that does not at all apply the previously used subjective qualification criteria, and exclusively objective risk criteria exist. Regarding data for 2006-2015, the data of more than 180,000 businesses were used for the analysis by Microsoft Excel and SPSS. Preliminary analysis has narrowed the scope of businesses, which is why it was not always pos- sible to test the indicators together, and in many cases too high data significantly distorted the test values. The factor analysis was carried out with 2015 data, and then the cluster analysis was completed. Factor analysis allows you to combine two or more variables at one time by reducing the number of variables in a single factor.
(Sajtos-Mitev, 2006) In my research, factor analysis was used to group the indica- tors used in the debtor rating primarily based on the ones that may be related to liquidity, profitability and capital position.
The cluster analysis algorithm can be hierarchical or non-hierarchical. The hier- archical algorithm searches for new clusters based on the previously created clus- ters, while the non-hierarchical algorithm determines all clusters at once. (Saj- tos-Mitev, 2006) Hierarchical clustering can be agglomerative and divisive. The aggregation-based algorithm first looks at each element as a separate cluster and connects them to larger clusters, while at the end we get a single cluster containing all the elements. The division algorithm, on the other hand, first considers the entire data block as a single cluster and divides it into smaller clusters, while at the end all elements form a separate cluster. (Sajtos-Mitev, 2006) The clustering I made was based on the divisive method. Similarly, the methodology of hierarchic cluster analysis was applied by Bene and his colleagues in the analysis of the food sector SME sector in the north of Hungary. (Bene et al., 2013)
Profitability indicators Profitability of assets (%) Profitability of equity (%) Profitability of ROA (%) Solvency indicators Liquidity acid test Liquidity indicator Liquid acid test
Capital position indicators Equity / Net sales (%)
Short term indebtedness indicator (%) Share of equity (%)
Table 1 The range of indicators examined in the factor analysis Source: author’s own editing based on the credit institutions’ debtor rating policy
Results
In the first part of the survey, I analysed the data on the secondary data of the HCSO in order to provide an introductory picture of the whole sector. In 2016, more than 45% more companies registered than in 2006, an increase of more than half a million registered businesses. Compared to 2016, a substantial increase can be observed until 2013, and only a few percent change later indicates an increase in the number of registered businesses. „About 0.7 percent of today’s businesses, some 4,000 companies were established before the change of regime, that is, only that number of companies exceeded the age of 24. But over the age of 15, it was only a quarter of today’s businesses, so Hungary is characterized by a relatively young company structure. „ (http://hvg.hu/kkv/20131125_A_magyar_cegek_
meg_nem_ertek_el_a_tinedzs)
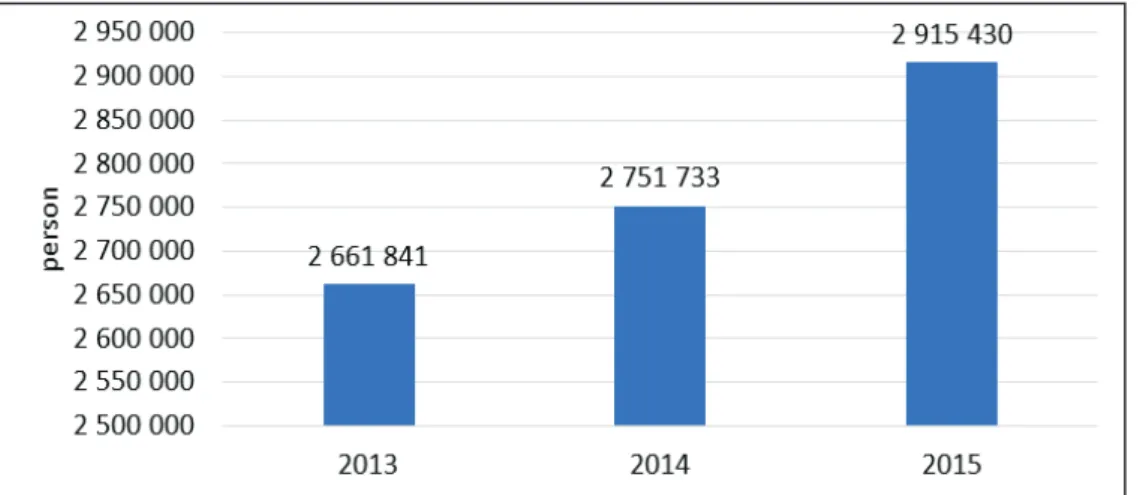
Figure 2 shows how many of the registered businesses is the number of op- erating registered businesses. It is clear from the data that half of the num- ber of registered enterprises is hardly the number of working enterprises per year, and even the ratio is rather unfavourable for the period under review. In the years prior to the crisis, 52-55% of registered businesses were viable, but with the onset of the crisis, this ratio was rapidly decreasing until 2013-2014, when it reaches a low of 35% and finally, based on the available data, in 2015 a 1% improvement can be observed for the benefit of working enterprises.
Data show that just over one third of registered businesses are viable, ongoing, i.e.
paying taxes, employing people and contributing to GDP.
Figure 1 The number of registered and operating enterprises in Hungary Source: author’s own editing based on CSO data http://statinfo.ksh.hu/Statinfo/haViewer.jsp
In the following figure I summarize how the number of individual proprietor- ships and corporate businesses in the country between 2006 and 2014 will change in the operating companies.
Figure 2 The number of operating individual proprietorships and corporate businesses in Hungary
Source: author’s own editing based on CSO data http://statinfo.ksh.hu/Statinfo/haViewer.jsp As the data show, the number of individual proprietorships is decreasing, and the role of social enterprises has increased, in 2006 more individual enterprises have been active than social enterprises, during and after the economic and finan- cial crisis, they were decisive. In the case of corporate enterprises, associations and ltd-s were dominant in this period, but this latter form of company did not lose its popularity during the period under review, but with respect to the associations, they decreased by more than 50,000 compared to the beginning of the period.
Regarding individual enterprises, the number of retired and part-time employees is dominant over the period, and in 2014 there were 272,170 individual enterprises registered. The following figure shows how the composition of individual business- es is structured, showing the percentage of the distribution data.
Figure 3 The structure of individual businesses (proprietorships) in Hungary Source: author’s own editing based on CSO data http://statinfo.ksh.hu/Statinfo/haViewer.jsp
The smallest number of individual businesses operated in 2012, after which some growth could be discovered. In 2014, 252,187 private enterprises were reg- istered, more than 50% of them were full-time, but in 2009 the highest rate was 57%. The proportion of enterprises with part-time employment is increasing, while retirees are less willing to maintain their business, with a share of only 9%
in 2014, compared to the previous 13%. Regarding the employment role of the domestic business sector, the results are shown below.
Figure 4 Employment in the corporate sector
Source: author’s own editing based on CSO data http://statinfo.ksh.hu/Statinfo/haViewer.jsp In terms of the employment structure, most of the micro-enterprises, including one-person enterprises, are decisive, their numbers increased by 17% compared to 2013, while the number of micro-enterprises employing 2 to 9 people did not change significantly, with only 2% in 2015 compared to 2013.
Employment categories 2013 2014 2015 1-man micro-enterprises 392 914 424 110 461 151 2-9-man micro-enterprises 173 174 170 329 170 322
small enterprises 29 197 30 372 32 013
medium sized enterprises 4 961 5 041 5 144
Non-SME organisations 5 368 5 514 5 750
Table 2 The structure of the corporate sector by the number of employees Source: author’s own editing based on CSO data http://statinfo.ksh.hu/Statinfo/haViewer.jsp
The relationship between corporate growth and funding
The availability of financial resources is a prerequisite for corporate growth. If an enterprise has a stable capital position, it is managed profitably, and it operates by consistently being solvent, then it can count on bank assistance. However, if there are problems in any area, the bank is less able to offer flexible funding. Below I will briefly summarize the financing options that may be the basis for the finan- cial profitability situation of the given business. Financing is the key to providing
financial resources for short and long-term financing needs. The demand for fi- nancial resources affects the private sector as well as the business one. According to László Gyulai (2013): “Enterprise financing is in fact a much more complex concept. It includes the assessment of resource requirements, the well-established decision-making process on financing and implementation of funding decisions, and even the subsequent measurement of their impact. “
Typifying corporate resources can be carried out according to their origin, based on internal and external sources. A special case for internal resources is the reversal of after-tax profits, which is defined by the literature as self-financing. The reinvest- ment of after-tax profits into profit reserves shows well the owners’ future prospects for their company.
The issue of financing may also affect the relationship between buyers and sup- pliers in the business, what payment deadlines arise between the parties, whether buyers know how to finance suppliers or what stock management policy is needed for the company to continue fully meeting consumer needs. The company’s spe- cific income may be either revenue from the sale or the sale of its tangible assets.
The internal resources are not completely free of cost because they pose a risk to the owners similarly to a case when the bank risks own (investor) assets. Cost of ownership is called alternative profit or cost.
Foreign sources have become more and more diverse in recent times, with busi- ness-angels, venture capital companies and institutional investors appearing in addition to traditional bank loans. Banks also have a wealth of opportunities for solvent and capital-intensive businesses. As external financiers, business partners and guarantee institutions may appear. A special source of income is the European Union subsidies, which exerts its beneficial effect on the different project financ- ing, but we can also mention the area-based subsidies that are the basis for agricul- ture. (Gyurcsik P. - Pataki L., 2016)
http://www.tankonyvtar.hu/hu/tartalom/tamop412A/0007_d2_1080_1082_
smeuzletifin/1_1_a_finanszirozas_lenyege_fontosabb_formai_SNzjx9sSaM- oQpDFp.html
The following table summarizes the alternative options for internal and external resources.
Internal sources External sources Reversal of return profit (profit re-
serve) Bank loans
(short- and long-term loans, working cap- ital loans, investment loans, project cred- its, overdrafts, white loans, Lombard loans etc.)
Sales revenue Commercial loans
Supplier loans Customer advances
Depreciation Issuing securities
Selling of assets (tangible assets,
„squeezing” of obsolete stocks) Share financing (venture capital, business angels)
Subsidies, tax incentives Crowd funding Leasing
Factoring
Table 3 Summary of corporate financing sources
Source: author’s own editing based on Marion Steven (2008) and Andreas Mitschele (2014) Since my analysis is linked to lending based on an objective criterion of a credit institution, relevant secondary data are presented in this study. The figure below shows the share of the SME sector in accordance with the credit target. Investment loans were dominant, the amount of funds used by micro enterprises amounted to HUF 299.5 billion, while small enterprises reached HUF 106.9 billion and me- dium-sized enterprises contracted to HUF 67.9 billion. Of the HUF-based loans, agriculture, manufacturing and trade were the main beneficiaries of the loans, while foreign currency loans were used by transport, real estate and manufacturing industries. Regarding the regional distribution of loans, both the HUF and the foreign currency loans were the most favoured by Pest county enterprises where 24% of all forint loans came in together with 56% of all foreign currency sources.
Figure 5 The share of the SME sector in accordance with the credit target Source: https://www.mnb.hu/sajtoszoba/sajtokozlemenyek/2016-evi-sajto-kozlemenyek /2017-marcius-31-en-zarul-a-novekedesi-hitelprogram, Communique on loans granted
under the third stage of the Growth Loan Programme, 4 April 2017
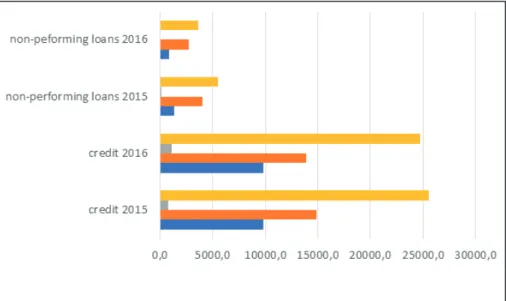
Figure 6 Changes of credit repayment capability of the corporate sector Source: author’s own editing based on the data of https://www.mnb.hu/felugyelet/idoso-
rok/i-penz-es-hitelpiaci-szervezetek
More than 55% of the outstanding loan portfolio affects micro, small and me- dium-sized enterprises. However, it is clear from the figure that the proportion of non-performing loans is much greater in micro, small and medium enterprises than in the large corporate segment. Without funding there is no growth, no ex- panding employment. Enterprises that see potential breakthroughs in investment and innovation still see a problem in the changes of cost factors. The R & D & I activities of the companies have increased in Hungary in recent years, one of the drivers of which is the European Union’s subsidy policy, while on the other hand, for corporate and local business tax, it can be considered as a tax base reduction item and tax benefits are available. In many cases grants can only be used by larger enterprises, but taxable and tax incentives are also available to smaller companies.
(Széles, 2016)
Typifying businesses based on indicators
In the following examination, I was looking for answers to the question of whether companies could be sorted into groups and what kind of traits they have based on the indicators. In this test database, all business data are included for which the in- dex could be calculated for 10 years. The relationship between the logically related indicators used is also demonstrated by the SPSS programme, which has enabled three groups (factor) to be created, resulting in the profitable, liquid and capital-in- tensive entrepreneurial group separately. A rotated component matrix was used to justify this statement. According to Varga-Szilágyi (2011): „The interpretation of factors is influenced by the rotation process used in the analysis. Therefore, we are investigating what conclusions can be drawn from the correlations of factors and variables and the data structure. „
Rotated component matrix
Name of indicator Factors
1 2 3
Profitability of assets (%) ,913 ,166 -,021
Profitability of equity (%) ,880 -,008 -,302
Profitability of ROA (%) -,544 -,039 ,115
Liquidity acid test ,024 ,889 ,076
Liquidity indicator -,082 ,852 ,198
Liquid acid test ,196 ,615 ,056
Equity / Net sales (%) -,033 -,076 ,875
Short term indebtedness indicator (%) ,134 -,408 -,754
Share of equity (%) -,076 ,500 ,722
Table 4 Rotated component matrix
Source: author’s own editing based on the data of Opten Kft.
According to Lehota factor analysis is used to »reduce« the number of observed variables. (http://www.tankonyvtar.hu/hu/tartalom/tkt/marketingkutatas/adatok.
html)
During the factor analysis, three well-defined index groups were statistically ver- ifiable, namely the factors of profitability, liquidity and capital intensity, with 3-3 indicators per group.
The process of factor analysis
Definition of the research problem: Characterization of the examined enterpris- es by means of calculated indicators. The number of pre-selected indicators is nine.
The objective of the factor analysis is to reduce the many variables to obtain a more manageable test dimension. Based on the 9 indicators, 3 factors were ultimately generated statistically. Based on a set of indicators, business behaviour can be char- acterized by liquidity and capital intensity.
The Kaiser-Meyer-Olkin (KMO) indicator was used to check the analytical con- ditions.
“The KMO value assesses the ability to factor analysis on a scale from 0 to 1 on a subjective scale. The higher the KMO value, the more accurate the data for the fac- tor analysis. It is not worth calculating with the KMO below 0.5, as the variables are independent, the multicollinearity is weak. “(Varga-Szilágyi, 2011)
Based on the analysis it was found that the examined indicators are not indepen- dent of each other, the strength of the relationship is higher than the intermediate level, so the factor analysis can be performed.
KMO and Bartlett’s Test
Kaiser-Meyer-Olkin Measure of Sampling Adequacy. ,632 Bartlett’s Test of Spheric-
ity
Approx. Chi-Square 117468,103
df 45
Sig. ,000
Deciding on the number of factors: By using the SPSS program, the values of the indicators are placed in decreasing order to separate the factors, bearing in mind that the value of the adjacent correlation coefficient will be higher in abso- lute than the correlation coefficient in the preceding column.
Rotation of factors: The components were rotated using a Varimax method. This method is generally accepted for data purification.
Interpretation of the results: Three factors can be distinguished as a result of the investigation: factor 1 is profitability, 2 is factor of liquidity, 3 is the factor of capital intensity.
The number of factors was determined on the basis of the “variance ratio meth- od”. “The minimum acceptable variance is 60%, but some disciplines or scientists require 80-90%. But in practice and in economics, there is a rare degree of variance that is so high that we consider 60%. “(Varga-Szilágyi, 2011)
Another method is the Scree test, the result of which is shown in the figure below.
Figure 7 The Scree test Source: author’s own editing
Scree Plot is a two-dimensional diagram showing the eigenvalues on the y axis and the number of factors on the x axis. (Varga-Szilágyi, 2011)
Analysing businesses with cluster analysis
“Cluster analysis is one of the multivariate methods that serve to explore structures and structures between respondents” (Simon J.)
The definition of objects and determining their number is based on the factor 3 separated by the former factor analysis. In the course of cluster analysis, the criteria were analysed with the same weight, which is why these data showed a balanced picture during the factor analysis. Handling the problem of outliers was a serious problem with this significant number of items.
Among clustering methods, hierarchical clustering methods form the second most important class. Similarly to the -middle method, it is still widely used up
to now. There are two basic approaches to creating a hierarchical clustering: merg- ing and splitting methods. The relationship between two clusters in the centroid (centre-based) methods is determined by computing the distance between cluster centres. (Pang-Ning Tan et al., 2011)
Hierarchical clustering is often depicted by a tree-like diagram termed as the dendrogram. (http://www.statisticshowto.com/dendrogram/)
Because of the large number of elements, the dendrogram display was complete- ly incomprehensible, so it does not appear in this form.
Knowing the factors created earlier, typifying enterprises was carried out by 2015. It should be noted, however, that all these companies have shown real per- formance on the basis of the results obtained in the last 9 years.
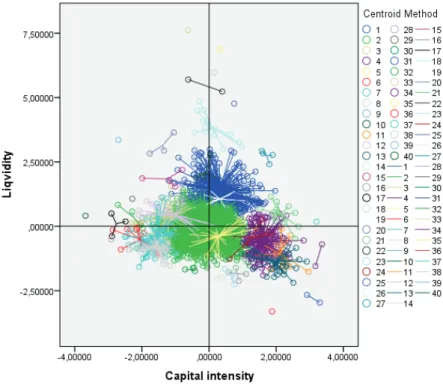
As the graph shows, it is very difficult to create and isolate substantive groups, the structure is extremely fragmented, so instead of the liquidity and capital in- tensity factor, a different combination has to be applied. There were a lot of small groups, some 27, and just three groups that included more than 5% of businesses, as shown in Figure 9.
Figure 8 Groups of liquidity and capital intensity factors Source: author’s own editing based on the data of Opten Kft.
Figure 9 Relevant groups based on profitability, liquidity and capital intensity factor
Source: author’s own editing based on the data of Opten Kft.
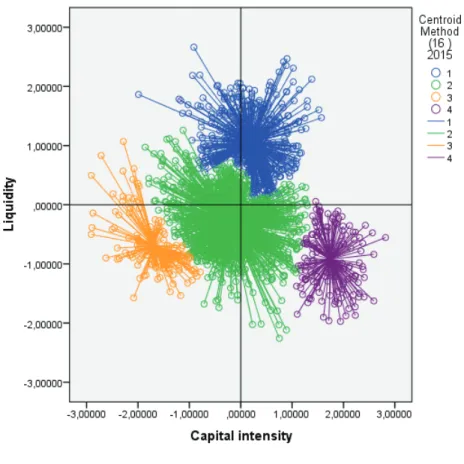
With regard to the unity of liquidity, capital intensity and profitability, it is not possible to create substantive groups, therefore, after testing several aspects, the final combination can be established after several tests, which I could best interpret in terms of liquidity and capital intensity.
Figure 10 The relevant groups received are based on liquidity and capital intensity factor
Source: author’s own editing based on the data of Opten Kft.
1. Group 1 characteristics: high liquidity, low capital intensity. Long-term solvency is not ensured by the capital position, assets carry high losses, businesses can temporarily maintain their solvency, but at any given mo- ment, insolvency may arise as there is no adequate capital instability. With overdrafts offered by credit institutions, rescheduling of suppliers’ debts or just paying customers by date, it cannot be excluded that they sell their existing assets to maintain the company’s business, which included some 469 companies.
2. Group 2 features: standard liquidity and standard capital intensity. The most ideal businesses for banks. Not only current, but long-term solvency is also ensured. Businesses are liquid and dispensable at the same time.
Their performance is balanced, and their capital stability provides for the future as well. With these characteristics about 998 businesses can be char- acterized.
3. Group 3 features: low liquidity and weak capital intensity, bankruptcy it- self, fortunately it only affects 152 businesses. The assets and liabilities of enterprises are poorly structured, the assets are not able to finance the cost of resources, ineffective management, capital debt should be reduced, in- debtedness should be increased, equity capital should be increased, external capital investors and community funding can be counted as no bank loans shall be offered.
4. Group 4 features: low liquidity and high capital intensity. Businesses have developed a capital structure that may cause solvency problems, while sales revenue may not always be able to provide cash flow. Businesses strive for excessive stability, no risk, no revenue, and with these features 147 busi- nesses can be characterized.
Conclusion
For Hungary, the operation of the corporate sector and the efficiency of the op- eration are a key issue. Many research, analysis and analyses show that the most accessible CSO database can provide a wide variety of data on the role of the sector.
Over the last decades, the operation and ownership structure of enterprises has un- dergone a major transformation. Prior to the privatization and reprivatisation, the state enterprises and co-operatives were followed by thousands of privately owned enterprises. In the turn of the millennium, an entrepreneurial circle was found in employment, export and taxation, most of which belonged to SMEs in addi- tion to large corporations. Companies with domestic capital investment are often associated with multinational multinational companies that provide permanent orders to smaller and larger businesses, while requiring high-quality production and cost-effective operation. The European Union continues to support not only Hungarian enterprises, but also enterprises of other nations, pointing to the vital importance of the future operation and development of the sector. The operation of domestic enterprises is shown by the fact that 52-55% of registered enterprises were operational in the pre-crisis years, but this rate is rapidly decreasing with the onset of the crisis, until reaching a low of 35% for the 2013-2014 period, and finally, on the basis of available data, an improvement of 1% for the benefit of
working enterprises could be observed in 2015. In the coming years, encouraging entrepreneurship can be a promising expectation, showing a more realistic picture of the sector’s perception and the range of measures needed for other economic operators. The company is slowly becoming more transparent due to the changes in legislation in the meantime due to forced companies or companies that have had negative results for many years now. Data show that just under one third of registered businesses are operational, i.e. they pay taxes, employ people, and con- tribute to GDP.
The objective of my research is to analyse the financial situation of the domestic corporate sector by means of indicators, whose fields are:
- Perform a factor analysis by selecting 9 indicators, which resulted in the creation of three factors.
- Creating a cluster analysis based on 2015 data, resulting in four well-defined enterprise groups.
For the preliminary analysis, OPTEN Kft. provided the data with the help of the SPSS programme because of the size of the database: 184.170 enterprises with 10 years of data. From this business circle, firstly, the enterprises that had data necessary for the calculation of indicators for the objective index system were se- lected. I have found varied values for 10 years: in 2006, about 13561 enterprises were surveyed based on these indicators, 13680 in 2008, 11147 in 2008, 12022 in 2009, 11492 in 2010, 10943 in 2011, 10518 in 2012, 9925 in 2013, 9846 in 2014 and 9671 in 2015.
Regarding the liquidity of enterprises, based on statistical data duality is typical, values are excellent on the average, but this characteristic is not detectable in half of enterprises. During the factor analysis, groups of well-defined groups of liquid- ity and capital intensity could be formed. Creating and examining these groups is important to find out what measures can be taken to get businesses in at least the standard category, knowing the liquidity and capital positions of businesses.
70% of the non-performing loan portfolio is related to the SME sector, while the non-performing loan portfolio is only 23%. During the factor analysis, the com- panies under consideration are grouped according to liquidity and capital intensity into the following categories: Group 1: high liquidity and low capital intensity;
Group 2: standard liquidity and standard capital intensity; Group 3: low liquid- ity and weak capital intensity; Group 4: low liquidity and high capital intensity.
Companies in these groups showed real activity for 10 years based on the balance sheet and profit and loss account data. The nature of the activity of businesses can also influence what financial features they are having, and this is another way of
looking at how the activity can affect the place occupied in each cluster. It cannot be clearly stated that the items of Factor 3 will soon go bankrupt because they survived the crisis, but the fact that the CRR directives mandated by credit insti- tutions from 2013 do not help this group in lending.
References
Mitschele, A. (2014): DiskozionsbeitrÄge Bankmagement DHBW Stutt- gart-FakultÄt Wirtschaft ISSN 2199-6954 https://www.dhbw-stuttgart.de/fil- eadmin/dateien/.../Diskussionsbeiträge_Band2_
Bán E. – Csernák J. (2018): Controls and their Effects on Management Support in the Hungarian Sector Of Micro, Small and Medium Enterprises; Annals of the Polish Association of Agricultural and Agribusiness Economists 20:(1) pp.
17-23. ISSN: 1508-3535
Bene A. – Óhegyi K. – Csernák J. (2013): Competitiveness Analysis of the Food Processing SME-s in One of the most Disadvantaged EU Regions, INTER- NATIONAL JOURNAL OF BUSINESS AND MANAGEMENT STUDIES 5:(1) pp. 21−30. ISSN: 1309-8047
Gyulai L. (2013): A kis- és középvállalkozások üzleti finanszírozása, http://
www.tankonyvtar.hu/hu/tartalom/tamop412A/0007_d2_1080_1082_smeu- zletifin/1_1_a_finanszirozas_lenyege_fontosabb_formai_SNzjx9sSaMoQpD- Fp.html letöltve
Gyurcsik P.- Pataki L. (2016): A kkv szektor tőkehelyzetének elemzése, In: Árpási Z., Bodnár G., Gurzó I. (szerk.) A magyar gazdaság és társadalom a 21. század globalizálódó világában 1. kötet: „30 éves a békéscsabai felsőoktatás” jubileumi konferencia. 247 p. p. 154−162. ISBN:978-963-269-569-3
Lehota J. (2001): Marketingkutatás az agrárgazdaságban, Mezőgazda Kiadó ISBN9639358258, http://www.tankonyvtar.hu/hu/tartalom/tkt/marketingku- tatas/adatok.html
Steven, M. (2008): BWL für Ingenieure Oldenburg Verlag München 367 p. ISBN 978-3-486-58613-8 https://doi.org/10.1524/9783486595352
Pang-Ning Tan, Steinbach, M., Kumar, V. (2011): Bevezetés az adatbányászat- ba,978963545535PanemKft. http://www.tankonyvtar.hu/hu/tartalom/tam- op425/0046_adatbanyaszat/ch08s03.html
Sajtos L. – Mitev A. (2006): SPSS kutatási és adatelemzési kézikönyv. Alinea Kiadó, Budapest. 245−282. p. ISBN: 978-963-9659-08-7
Simon J. (2006): A klaszterelemzés alkalmazási lehetőségei a marketingkutatásban, Statisztikai Szemle, 84. évfolyam 7. szám 629.p.
Zsuzsanna Sz. (2016): Taxation of Research and Development JOURNAL OF ECONOMICS AND BUSINESS RESEARCH 22:(2) pp. 7−18.
Varga B., Szilágyi R. (2011): Kvantitatív információképzési technikák http://www.
tankonyvtar.hu/hu/tartalom/tamop425/0049_08_kvantitativ_informacio- kepzesi_technikak/1474/index.html 2017. 11. 11.
www.ksh.hu/statszemle_archive/2013/2013_11/2013_11_1072.pdf
http://hvg.hu/kkv/20131125_A_magyar_cegek_meg_nem_ertek_el_a_tinedzs 2017. 11. 10.
gtk.uni-miskolc.hu/files/126 2017. 11. 25.
https://www.mnb.hu/penzugyi-stabilitas/publikaciok-tanulmanyok/hiteleze- si-felmeres/hitelezesi-felmeres-2017-majus
Az Európai parlament és a Tanács 575/2013/EU rendelete (2013. június 26.) a hitelintézetekre és befektetési vállalkozásokra vonatkozó prudenciális követelményekről és a 648/2012/EU rendelet módosításáról
http://www.ksh.hu/gazdasagi_szervezetek_beruhazas http://statinfo.ksh.hu/Statinfo/haViewer.jsp
http://www.tankonyvtar.hu/hu/tartalom/tamop412A/0007_d2_1080_1082_
smeuzletifin/1_1_a_finanszirozas_lenyege_fontosabb_formai_SNzjx9sSaMo- QpDFp.htm
https://www.mnb.hu/sajtoszoba/sajtokozlemenyek/2016-evi-sajto-kozlemenyek /2017-marcius-31-en-zarul-a-novekedesi-hitelprogram,
Közlemény a Növekedési Hitelprogram harmadik szakasza keretében nyújtott hitelekről, 2017. április 4
https://www.mnb.hu/felugyelet/idosorok/i-penz-es-hitelpiaci-szervezetek http://www.statisticshowto.com/dendrogram/
Author
Dr. Aranka Baranyi PhD associate professor Eszterházy Károly University
Károly Róbert Campus Gyöngyös, Mátrai út. 36.
baranyi.aranka@uni-eszterhazy.hu
JOURNAL OF CENTRAL EUROPEAN GREEN INNOVATION HU ISSN 2064-3004
DOI: 10.33038/JCEGI.2018.6.3.37
Available online at http://greeneconomy.uni-eszterhazy.hu/
A KELET- KÖZÉP EURÓPAI ORSZÁGOK ENERGIA- FELHASZNÁLÁSÁNAK ELEMZÉSE
ANALYSIS OF GROSS INLAND ENERGY CONSUMPTION OF THE CENTRAL EASTERN EUROPEAN COUNTRIES
BOZSIK NORBERT
Összefoglalás
A megújuló energiaforrások hasznosítása egyre nagyobb jelentőséggel bír az EU klí- ma- és energiapolitikájában. A megújuló energiahasználat növelését és ösztönzését több tényező indokolja. Ezek közé tartozik az importált fosszilis energiától való függőség csökkentése, az energia szektor káros környezeti hatásainak mérséklése és az új ipari fejlődés ösztönzése révén a gazdaságélénkítés. A tanulmány betekintést nyújt a kelet-közép európai országok energiatermelésének és -felhasználásának szerkezetéről, külön is kitérve az energiaimporttól való függőségre. A cikk célja a kelet-közép európai országok energiafelhasználásának elemzése során a megújuló energia és a nem megújuló energiahordozók közötti viszony alakulásának vizsgálata. Arra a kérdésre keressük a választ, hogy az egyes országokban a megújuló energia felhasználásának növekménye melyik nem megújuló energiahordozót váltja ki (természetesen nem egészében). Az eredmények alapján megállapítható, hogy vizsgált kelet-közép európai országokban a megújuló energia leginkább a szenet váltotta ki. A megújuló energia felhasználásá- nak növelése mellet azonban legalább ennyire hangsúlyos feladat az energiahatékonyság (-takarékosság) további növelése is.
Kulcsszavak: energiafelhasználás, korrelációs mátrix, kelet-közép európai or- szágok, megújuló energia
JEL kód: Q41
Abstract
The utilization of renewable energy sources has an increasing role in the EU’s climate and energy policy. There are several reasons for increasing the use of renewable energy.
The motives are the reduction of imported dependence on fossil fuels, mitigation of the adverse environmental impact of the energy sector and boosting of industrial develop- ment. The study provides a comprehensive overview on the structure and utilization of energy production of the Central Eastern European countries, focusing on the depen- dence on energy imports. The purpose of the article is to analyze the gross inland energy consumption of the Central Eastern European countries and to examine the relation- ship between renewable energy and non-renewable energy sources. In the course of the analysis, we tried to find out which non-renewable energy carrier is replaced by the renewable energy in the Central Eastern European countries. It can be stated that the renewable energy replaced mostly the coal in the CEE countries. Besides, the increasing use of renewable energy the further raising of energy efficiency (savings) is at least so important task.
Keywords: correlation matrix, gross inland energy consumption, Central East- ern European countries, renewable energy
JEL code: Q41
Bevezetés
Az elmúlt évtizedek jelentős gazdasági növekedésének fontos tényezője volt, hogy olcsón lehetett természeti erőforrásokat felhasználni a termeléshez, szállításhoz.
Ma kevés régió állítja elő a fosszilis energiát a világon, ráadásul többségükben a politikai helyzet is labilis, így meglehetősen bizonytalan energiaforrást jelentenek (HARANGI-RÁKOS et al. 2017). A Föld népességszámának emelkedésével együtt az energiafogyasztás is jelentősen növekszik, leginkább az elmaradott ázsiai és af- rikai régiókban, ráadásul további energiaigényeket támaszt a növekvő termelés és az – elsősorban a fejlett országokban tapasztalható - életmódváltozás is (FODOR 2012). Az energiahatékonyság javulása ugyan mérsékli a fokozódó energiakeresle- tet, azonban a megújuló energiaforrások növekvő felhasználása kulcskérdéssé vált a fosszilis energia részleges kiváltására. A megújuló energia felhasználása még akkor is felértékelődik, ha sokszor kisebb mennyiségben, elszórtan áll rendelkezésre, a termelése nem szabályozható eloszlású vagy függ az időjárás alakulásától.
A világ energiahelyzete – globális kitekintés
A világ energiafogyasztása évente átlagosan 1,7 %-kal nőtt a 2006 és 2016 közötti évtizedben, ami a világ gazdasági növekedési ütemének (3,4%) éppen felét tette ki.
A Föld teljes energiafelhasználás 13300 mtoe volt 2016-ban, ebből a legnagyobb energia felhasználó Kína (23 %), USA (17 %), India (6,7 %), Oroszország (5,1 %) és Japán (3,4 %) voltak. Az energia felhasználása és annak növekedési üteme igen egyenlőtlen a Földön. Annak ellenére, hogy az OECD országok erőteljes növeke- dést mutatnak a globális energiafogyasztás növekedésének 50%-ért Kína és India felelős (BRITISH PATROL 2018).
A szén és szénhidrogének továbbra is meghatározóak az energiatermelésben és –fogyasztásban. A fosszilisek közül még mindig az kőolajfogyasztás volt a legjelen- tősebb 2016-ban (4557 mtoe), ezt követi a szénfelhasználás (3706 mtoe) és végül földgázfogyasztás (3073 mtoe). A palagáz felhasználás jelentős növekedése, illetve a kínai és az amerikai szénfogyasztás visszaesése 2014-ben és 2015-ben a szénfel- használás csökkenéséhez vezetett. A trend ezt követően elsősorban az indiai és a dél-ázsiai szénkereslet növekedése következtében megfordult. A nem-fosszilis ener- giahordozók jelentősége jóval kisebb a Földön, közülük a vízenergia felhasználása 913 mtoe, a nukleáris energia pedig 591 mtoe volt 2016-ban. A világ megújuló energiafelhasználása (vízenergia nélkül) tíz év alatt megnégyszereződött és elérte 2016-ban 417 mtoe-t, ami a teljes energiafelhasználás 3,1%-át jelenti (1. ábra).
A megújulók között a biomassza jelentősége kiemelkedő. A Földön a megújuló energiaforrásokból nyert energia 80%-a biomasszából származik (TÓTH 2013).
1. ábra: A világ energiafelhasználásának alakulása (mtoe) / Figure 1.
The development of World’s energy consumption (mtoe)
Forrás: British Patrol Statistical Review of World Energy (2018) / Source: British Patrol Statistical Review of World Energy (2018)
A világ teljes energia-felhasználása tehát alapvetően fosszilis forrásokból történik, a véges mennyiségben rendelkezésre álló készletek azonban egyre gyorsuló ütem- ben kerülnek felhasználásra. A közel jövőben a gáz és megújuló energiaforrások felhasználásának növekedése mellett a szénfogyasztás csökkenése, valamint a kő- olajfogyasztás és az atomenergia-felhasználás stagnálása valószínűsíthető. Hosszabb távon a legtöbb szcenárió szerint a világ globális energiaigénye a következő száz év alatt több mint négyszeresére fog nőni, amit csak új, alternatív energiaforrások belépésével lehet majd kielégíteni. A felgyorsult ütemű termelés és energiaigény következtében a hagyományos fosszilis energiahordozók kitermelhetősége jelen- tős mértékben csökkenni fog (LAKATOS - LAKATOSNÉ 2009). A víz-, szél- és napenergia, a biomasszából előállított energia napjainkban még drágább, mint a fosszilis alapú energiatermelés. A folyamatosan csökkenő készletek és a növekvő energiaárak következtében egyre érdemesebb megújuló energiaforrásokra váltani (POPP 2013).
A megújuló energiafelhasználás jelentőségét mutatja, hogy 2016-ban már 274 milliárd dollár befektetés történt az ágazatba, amely mintegy 10,3 millió főt fog- lalkoztatott világszerte. Figyelemre méltó tény az is, hogy 1990-es évek elején még csak néhány, 2016-ben viszont már 176 országnak volt saját megújuló energiapo-
litikája vagy legalább a jövőre vonatkozó megújuló energiafelhasználási célkitűzése (REN21 2018).
Az Európai Unió energiahelyzete
A Európai Unió primer energiatermelése 755 mtoe-t tett ki 2016-ban, ami 15%- os visszaesést jelent a tíz évvel korábbi szinthez képest. A primer energiatermelés összetétele országonként igen eltérő. Az EU egészében a primer energiatermelés 18%-át a szén, 10%-át az olaj, 14%-át a földgáz, 28%-át a megújuló és 29%-át a nukleáris energia tette ki 2016-ban.
Az EU olaj- és gáztermelése, valamint a finomítókapacitás gyorsabban csökkent az elmúlt időszakban, mint az energiakereslet, ami negatív következményekkel járt az energiabiztonságra (HONVÁRI 2015). A belső termelés csökkenése miatt az Uniónak egyre nagyobb mértékben kellett primerenergia-importra támaszkodnia a kereslet kielégítéséhez. Az EU 1483 mtoe importenergiát használt fel 2016-ban, miközben 579 mtoe energiát exportált. Az EU a világ legnagyobb energiaimportő- re, az általa felhasznált összes energia 53%-át importból fedezte 2016-ban, mely- nek összege 350 milliárd euró volt. Több olyan EU tagállam is van, amely igen nagy mértékben néhány beszállítótól függ, ami kiszolgáltatottá teszi őket. Alap- vetően Oroszország maradt a legnagyobb kőolaj- és földgázszállító, de a szilárd tüzelőanyag-szállítóként is az élre tört. Az importfüggőséget jól mutatja az is, hogy hat tagállam teljes gázimportja egyetlen külső szállítótól függ. A közlekedési ágazat 94%-ban kőolajtermékekre támaszkodik, és ezek 90%-a importból származik. A legjelentősebb energia felhasználók Németország (19,3%), Franciaország (15,1%), Egyesült Királyság (11,5%), Olaszország (9,4%) és Spanyolország (7,5%).
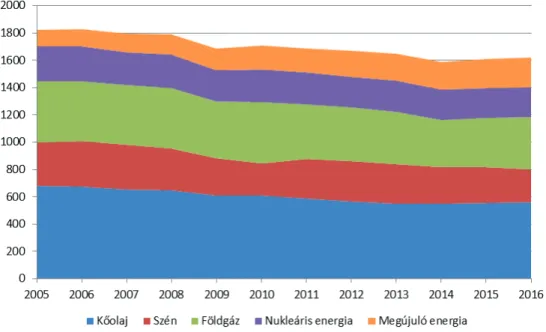
Az Európai Unió bruttó belső energiafelhasználása (Gross inland consumption) tíz év alatt 10%-kal csökkent, a 2006. évi 1822 mtoe-ről 2016-ra 1618 mtoe-re. A végső energia felhasználás (Final energy consumption) pedig 1193 mtoe-ről 1107 mtoe-re, ami pedig 7,2%-os csökkenést jelent. Az Európa Unió bruttó energia- felhasználásában a fosszilis energiahordozók dominálnak (73,2%). A bruttó kőo- laj-felhasználás aránya 34,7% (561 mtoe), a földgázé 23,7 % (383 mtoe), szén és széntermékeké pedig 14,9% (241 mtoe) volt 2016-ban. A nem-fosszilis energia- hordozók jelentősége az Európai Unióban jóval kisebb. A nukleáris energia a teljes energiafelhasználás 13,4%-át (217 mtoe) tette ki (2. ábra).
2. ábra: Az Európai Unió bruttó energiafelhasználásának alakulása (mtoe) / Figure 2. The development of European Union’s Gross Inland Consumption (mtoe) Forrás: British Patrol Statistical Review of World Energy (2018) / Source: British Patrol
Statistical Review of World Energy (2018)
Az Európai Unió megújuló energiafelhasználása 2016-ban elérte 217 mtoe-t, melynek 45%-át a biomassza, 14%-át a vízenergia, 12%-át a szélenergia, 2%-át a naphőenergia, 4%-át a fotovoltalikus, 8%-át a biogáz, 5%-át a biodízel, 5%-át a városi hulladék, 3%-át a földhő energia tette ki. Az EU-ban a megújulók képviselik az elektromos áramtermelés 29,6%-át, a szállítás 7,1%-át és a hűtés-fűtés 19,1%- át. A 2006 és 2016 közötti időszakban egy ellentétes tendencia figyelhető meg az Európai Unióban az energiafelhasználás területén. A fosszilis energiahordozók felhasználásának 17,8%-os, és a nukleáris energia 15,8%-os csökkenése mellett a megújuló energiaforrások jelentős növekedése (78%) figyelhető meg. A megújuló energia az egyetlen energiatípus, amelyek mennyisége és aránya is folyamatosan nőtt a teljes energiafelhasználáson belül.
A megújuló energia szerepe az Európai Unióban
A megújuló energiaforrások hasznosítása egyre nagyobb jelentőséggel bír az EU klíma- és energiapolitikájában. Az Európai Unió gazdasági és környezeti érdekek hatására már a múlt évezred végén elkötelezte magát - a Kiotói vállalások mel- lett - a megújuló energiaforrások fokozott hasznosítása mellett. Először az Európai Bizottság által 1997-ben kiadott Energiapolitikai Fehér Könyv kezdeményezte a megújuló energiákkal kapcsolatos közösségi stratégiát és ehhez cselekvési tervet is megfogalmazott. Célul tűzte ki a megújuló energiák arányának 12%-ra növelését az EU-ban. Felismerve a növekvő importfüggőséget az EU Bizottsága 2006-ban az ún. Zöld Könyvben ismét meghatározta az európai energiapolitika alapjait, mely az energiaellátás fenntartható fejlődését, a versenyképességet és az ellátás biztonsá- gát jelölte ki prioritásként.
A megújuló energiaszabályozással kapcsolatban a legjelentősebb történés a 2009/28/EK irányelv életbelépése volt, amely egyben hatályon kívül helyezte a megújuló energiaforrásokból előállított villamos energia támogatásáról szóló 2001/77/EK és a bioüzemanyagok támogatásáról szóló 2003/30/EK irányelveket.
Az Európai Unió 2020-ig kötelezettséget vállalt arra, hogy legalább 20%-kal csök- kenti az üvegházhatást okozó gázok kibocsátását az 1990. évi szinthez képest, a tel- jes energiaszükséglet 20%-át megújuló energiaforrásokból fedezi és 20%-kal javítja az energiahatékonyságot. Ez volt az ún. „20-20-20”-as kezdeményezés. A 2009-es irányelv a tagországok számára egyenként is előírta, hogy 2020-ig milyen mérték- ben csökkentse az üvegházhatású gázok kibocsátását, milyen mértékben alkalmazza a megújuló energiaforrásokat (a végső energiafelhasználás arányában), illetve hogy mekkora arányban alkalmazza a bioüzemanyagokat a közlekedésben. Az 1. táblázat bemutatja, hogy az EU és a vizsgált hat ország hol tart a megújuló energia felhasz- nálásának alakulását illetően a végső energiafelhasználásban. Megjegyzendő, hogy a vizsgálat tárgyát képező bruttó belföldi energiafelhasználás (Gross inland energy consumption) nem tévesztendő össze a végső energiafelhasználással (Final energy consumption).
1. táblázat: A megújuló energia részarányának alakulása a végső energiafelhasználás- ban és 2020. évi célértékei / Table 1. The development of share of renewable energy
in the final energy consumption and the 2020 targets Forrás: eurostat adatbázis (2018) / Source: eurostat database (2018)
Az Európai Unió Tanácsa 2030-ra még ambíciózusabb célokat jelölt ki, ami- korra is tovább növelte a kötelezettségvállalás mértékét. Eszerint az EU 40%-kal csökkenti az üvegházhatást okozó gázok kibocsátását, legalább 27%-ra növeli a megújuló energiaforrások részarányát, illetve 27–30%-kal javítja az energiahaté- konyságot. Az villamosenergia-hálózatok összekapcsolásával pedig eléri azt, hogy az elektromos áram 15%-a átszállítható legyen más uniós tagállamba.
Általában elmondható, hogy jelenlegi piaci feltételek mellett a megújuló ener- giatermelés még nem versenyképes a hagyományos energiatermelési módokkal, melynek oka a zöld technológiák magasabb beruházási költsége és az externális környezeti károk piaci árakban való nem megfelelő leképezése. A megújuló energiatermelés elterjedéséhez támogatásra van szükség (FODOR 2012). Az Eu- rópai Unióhoz való tartozás alapvető velejárója a tagállamok közötti szolidaritás, mindeközben az energiaellátás terén valamennyi tagállam önmaga felelős saját biz- tonságáért. Az EU energiapolitikáját az ellátás biztonsága, a versenyképesség és a fenntarthatóság elvei vezérlik. Az egyes tagállamok ösztönzőrendszereinek sike- rességét nagy mértékben befolyásolják az adott ország adottságai. Addig amíg nem voltak gazdasági ösztönzők a megújulók támogatására addig a földrajzi adottsá- goknak köszönhető magas volt a vízenergia aránya. A megújulók elterjedését az is gátolhatja, ha az adott ország gazdag fosszilis forrásokban (pl. Egyesült Királyság, Lengyelország). Természetesen a földrajzi adottságok mellett más tényezők is be- folyásolják a megújulók elterjedését úgy mint a nemzetközi kötelezettségek eltérő- sége, az ország technológiai fejlettsége, az engedélyeztetési rendszer procedúrája vagy a társadalmi tudatosság (REICHE - BECHBERGER 2004).
Ország 2008 2009 2010 2011 2012 2013 2014 2015 2016 2020
célérték EU-28 11,10% 12,40% 12,90% 13,20% 14,40% 15,20% 16,10% 16,70% 17,00% 20,00%
Lengyelország 7,70% 8,70% 9,30% 10,30% 10,90% 11,40% 11,50% 11,70% 11,30% 15,00%
Csehország 8,60% 9,90% 10,50% 10,90% 12,80% 13,80% 15,00% 15,00% 14,90% 13,00%
Szlovákia 7,70% 9,40% 9,10% 10,30% 10,40% 10,10% 11,70% 12,90% 12,00% 14,00%
Magyarország 8,60% 11,70% 12,70% 14,00% 15,50% 16,20% 14,60% 14,40% 14,20% 13,00%
Románia 20,50% 22,70% 23,40% 21,40% 22,80% 23,90% 24,80% 24,80% 25,00% 24,00%
Bulgária 10,50% 12,10% 14,10% 14,30% 16,00% 19,00% 18,00% 18,20% 18,80% 16,00%
Anyag és módszer Anyag
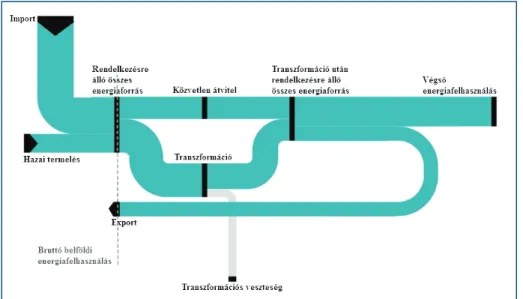
A tanulmány hat kelet-közép európai uniós tagország bruttó belföldi energiafel- használását (fogyasztását) elemzi. A bruttó belföldi energiafelhasználás a – bármi- lyen célra felhasznált – energiaforrások teljes mennyiségének felel meg. Szűkebb ér- telemben az elsődleges energiatermelés és a nettó import (import-export) összegét jelenti, tágabb értelemben az előbbi kiegészül még a visszanyert és újrahasznosított termékekkel, a készletváltozással, a tározók készletével és a közvetlen felhaszná- lással. Az energiaáramlás folyamatábráját a Sankey-diagram (3. ábra) szemlélteti, ahol az áramlás irányát a nyilak mutatják, és az áramlások szélessége az áramlási mennyiségekkel arányos.
3. ábra: Az energiaáramlás egyszerűsítet Sankey-diagrammja / Figure 3. Simplified Sankey diagram for energy flow
Forrás: eurostat alapján saját szerkesztés (2018) / Source: own construction based on eurostat (2018)
Az ábra azért „egyszerűsített”, mert nem jelöli a hálózati veszteséget, a rendszer működésének (átalakítás, szállítás stb.) energiafelhasználását, csak a transzformá- ciós veszteséget. A vizsgálatunkat ezek a tényezők egyébként érdemben nem befo- lyásolják. A tanulmány elkészítése során az elemzésekhez közvetlenül kapcsolódó releváns hazai és nemzetközi szakirodalmak kerültek feldolgozásra. Az elemzések az Európai Bizottság Eurostat és a Nemzetközi Megújuló Energia Ügynökség (Inter- national Renewable Energy Agency, IRENA) adatbázisain alapulnak.
Módszer
A tanulmányban összehasonlító és idősoros elemzés került alkalmazásra. A hat ke- let-közép európai uniós tagország bruttó energiafelhasználását, illetve a megújuló energia és a nem megújuló energiahordozók közötti viszonyt vizsgáltuk. Az elem- zés során arra a kérdésre kerestük a választ, hogy az egyes kelet-közép-európai or- szágokban a megújuló energia növekménye melyik nem megújuló energiahordozót váltja ki (természetesen nem egészében) vagyis melyik helyébe lép. Itt természe- tesen nem napi ingadozásról van szó, hanem egy hosszabb távú (7 év) folyamat eredményéről. Az energiahordozók egymással való kapcsolatának elemzése korrelá- ciós mátrix segítségével történt, és 5%-os szignifikancia szinten került kiértékelés- re. Ezt követően parciális korrelációszámítással kontrolváltozó(k) mellet vizsgáltuk, hogy fennáll-e az előbbi korrelációs mátrixban számított kapcsolat szorossága. A kiértékelés IBM SPSS Statistics 20, GRETL 2018a statisztikai, illetve MS-Office Excell 2016 programcsomagokkal történt.
Eredmények
Lengyelország energiafelhasználása
Lengyelország ásványkincs vagyona jelentős, a legfontosabb a Felső-Sziléziában ta- lálható feketekőszén. A barnakőszén inkább az ország délnyugati területein talál- ható. Az ország energiatermelése így - nem véletlenül - fekete- és barnaszénre ala- pozott. A hazai energiatermelés 80%-át a fekete- és barnaszén, a 14%-át megújuló energia (azon belül főleg biomassza) adja. Lengyelország egyben Európa legna- gyobb szénkitermelője, amely évente 75 millió tonna szenet termel ki. Lengyelor- szág éves primer energiatermelése 66 ezer ktoe körül alakult a 2010 és 2016 közötti időszakban. Lengyelország 50,1 ezer ktoe importenergiát használt fel 2016-ban, ami 10%-kal több mint 2010-ben. Az ország energiaimportja kőolaj alapú (64%), a földgáz aránya 24%, a széné 10%. Lengyelország importfüggősége - EU-s össze- hasonlításban - alacsonynak mondható (30%), viszont nagy a függőség Oroszor- szágtól. A lengyel energiaexport értéke 20 ezer ktoe volt 2016-ban. Az exportban is – a belső felhasználáshoz hasonlóan – a szén a domináns (50%). Az ország bruttó energiafelhasználása 99 ezer ktoe (2016), ami 1,4%-os csökkenést jelent a 2010-es értékhez képest. A bruttó energiafelhasználás 49%-a szén, 27%-a kőolaj, 15%-a földgáz és 9%-a megújuló energia (4. ábra).
4. ábra: Lengyelország bruttó energiafelhasználásának alakulása (ezer ktoe) / Figure 4. The development of Poland’s gross inland consumption (thousand ktoe) Forrás: eurostat adatbázis alapján saját szerkesztés (2018) / Source: own construction based
on eurostat database (2018)
Lengyelországban a széntüzelésű erőművek többségét 1960 és 1980 között épí- tették. A nagyrészük elavult, és nem felel meg az üvegházhatást okozó gázok ki- bocsátásával kapcsolatos szigorú uniós környezetvédelmi követelményeknek, ezért – a tervek szerint – 2025-re bezárják őket és 5-6 újonnan épült, hagyományos kapacitású üzem kerül használatba. A fekete- és a barnaszén alapú energiaterme- lés tehát – mely az energiaellátás 80%-ért felelős - továbbra is meghatározó lesz Lengyelországban, mivel sok munkahelyet teremt és az országban igen erős a bá- nyász-szakszervezetek befolyása a lengyel politikára. Lengyelországban egyáltalán nincs nukleáris energiafelhasználás, de a tervek szerint 2035-ra két nukleáris erőmű megkezdheti a működését, diverzifikálva ezzel az energiatermelést. A lengyel kor- mány egy nagy teljesítményű gázhűtésű reaktor (HTGR) építését is tervezi, csök- kentve ezzel az importált földgáz igényt és a CO2-kibocsátás szintjét (EXPORT.
GOV 2018).
Lengyelország bruttó megújuló energiakínálata 8769 ktoe volt 2016-ban, melyből a biomassza 75%-kal, a szélenergia pedig 12%-kal részesedett. Lengyel- országban a megújuló energia adta az elektromos áramtermelés 13,3%-át, a szál-
lítás 3,9%-át és a hűtés-fűtés 14,7%-át. A lengyelek a megújulók terén jelenleg a szélenergiában és a biomasszában látják a legnagyobb növekedési potenciált. A szélenergia esetében meglehetősen ellentmondásos a helyzetkép. Lengyelországban 2015-ben még több szélturbinát telepítettek, mint – Németország kivételével - bármelyik másik európai országban. A szélenergia bővülésének lehetőségét azon- ban komolyan korlátozta az a 2016-os elnöki rendelet, mely szerint tilos széltur- binákat építeni településektől és erdőtől 2 km-re, sőt a meglévőkre is további adót vetett ki, csökkentve ezzel a profitot. Az új szabályozás értelmében így az ország mindössze 1%-án épülhet új szélturbina, már pedig a szélenergia kapacitás jelen- tős bővülésére lenne szükség Lengyelországban, hogy teljesítse az uniós célokat a megújulók terén. A napenergia területén hasonló a helyzet. A 2015-ös évben 71 megawattal (240%-kal) nőtt a telepített fotovoltalikus kapacitás. Helyi vállalatok telepítettek napelemes rendszereket oszágszerte a közintézményekre, illetve meg- épült az ország legnagyobb fotovoltalikus szélerőműparkja Ostrzeszowban (2 MW teljesítménnyel). A fellendülés azonban itt is megtorpant. Jelenleg a fotovoltalikus energia növekedése alacsony, bár a háztartási berendezések piaca gyorsan növekszik Lengyelországban (SUDAK 2018).
Csehország energiafelhasználása
Csehország területén, elsősorban az Érchegység déli lábánál réteg vastagságú bar- naszéntelepek találhatóak, így az energiatermelés – Lengyelországhoz hasonlóan – alapvetően szénalapú. Csehország elsődleges energiafelhasználása 26,8 ezer ktoe volt 2016-ban, ami 15%-os csökkenést jelent a 2010-es szinthez képest. A pri- mer energiatermelés 60%-át a szén teszi ki, a nukleáris energia részesedése 23%, a megújulóé 16%. Csehország 20,3 ezer ktoe importenergiát használt fel 2016-ban, amelynek fele kőolaj, egy harmada földgáz és 15%-a szén volt. Csehország a szenet Lengyelországból, a kőolajat és a földgázt elsősorban Oroszországból importálja.
Az ország importfüggősége (32%) lényegesen az európai uniós átlag alatt van. A cseh energiaexport értéke 5,8 ezer ktoe (2016), melynek java része szén (55%) és kőolaj (38%). Csehország bruttó energiafelhasználása 42,4 ezer ktoe volt 2016- ban, ami 8%-kal csökkent 2010 óta. A bruttó energiafelhasználás 40%-a szén, 19%-a kőolaj, 17%-a földgáz, 14%-a nukleáris energia és 10%-a megújuló energia (5. ábra).
5. ábra: Csehország bruttó energiafelhasználásának alakulása (ezer ktoe) / Figure 5.
The development of Czech Republic’s gross inland consumption (thousand ktoe) Forrás: eurostat adatbázis alapján saját szerkesztés (2018) / Source: own construction based
on eurostat database (2018)
Csehország energiatermelése nagyban függ a hazai széntermelés volumenétől. A jövőben ezért komoly kihívás az új szénlelőhelyek feltárása és a technológiai fejlesz- tés. Az energiabiztonság növelése mellett azonban a szénhasználat maga után vonja az üvegházhatást okozó gázkibocsátás növekedését is! Csehország számára az ener- giafüggetlenség elérése igen fontos feladat. Ennek érdekben a kormány alapvetően az atomenergia további növelését támogatja és a közel jövőben új reaktorokat ter- vez építeni. Az atomenergia-termelés kiterjesztése fontos azért is, hogy Csehország megőrizze villamosenergia-exportőri pozícióját, miközben cél a régi szénerőművek megszüntetése. Az orosz földgáz-függőség csökkentésének egyetlen lehetősége az energiahatékonyság fokozása lehet. Csehországban a földgázt elsősorban fűtésre használják; így az épületek energiahatékonysági felújítása jelentősen csökkenthetné a földgázfogyasztást (EXPORT.GOV 2018).
Csehország teljes megújuló energiakínálata 2010-hez képest jelentősen (38%- kal) növekedett és 2016-ban elérte 4310 ktoe-t, melynek 67%-át a biomassza és 14%-át a biogáz tette ki. Csehországban a megújuló energia adta az elektromos áramtermelés 13,6%-át, a szállítás 6,4%-át és a hűtés-fűtés 19,8%-át. Csehország-