CHAPTER 2
World Fisheries
DIETMAR RIEDEL
Fisheries Division, Food a n d Agriculture Organization of the United Nations, Rome, Italy*
I. Historical Data 41
II. Present Catches 4 4
A. Inland Fisheries 6 4
B. Ocean Fisheries 4&
III. Utilization of the Ocean Fish 64
A. Fish Meal 5 6
B. Fish Oils 7 6
C. Miscellaneous 68
IV. Fish Trade ß8
V. Ocean Fisheries in National Economy 70
VI. Food Aspects 0 7
VII. Prospects and Tasks for the Future 73
References 4 7
I. Historical Data
The first efforts to assess the world catch of fish, shellfish, and other edible sea animals can be traced back to the middle of the nineteenth century. In most cases these efforts were made by geographers or ex
perts working on behalf of the fish trade. The figures computed in this way must be considered rather as estimates, since detailed catch statistics were not available at this time. It is, furthermore, not possible to estab
lish whether these catch figures refer merely to fish or if other com
modities were included, as, for instance, whales, shellfish, or even sea
weeds. After World War II, FAO (Food and Agriculture Organization of the United Nations) published for the first time a comprehensive statistical report with regard to catches of fish, including crustaceans, fish, mollusks, and other animals, as well as seaweeds, exclusive of marine mammals (see Fig. 1 ) . Since 1947, such statistics have been published annually.
In comparing the present world catch with earlier years, the enormous increase in production in less than a hundred years is most noteworthy.
It rose from 2 million metric tons in 1850 to 30 million metric tons in 1956, 27 million of which could be ascribed to ocean fish. Table I surveys
* Permanent address: Danzigerstrasse 87, Wiesbaden-Sonnenberg, Germany.
41
42 D I E T M A R R I E D E L
P L A N T S j e t c . M I X E D and unidentified F I S H E S
F R E S H W A T E R SALMONS, F L A T F I S H E S
e t c . S C O M B R I - E L A S M O - F O R M E S B R A N C H I I
MISCELLANEOUS T E L E O S T E A N S
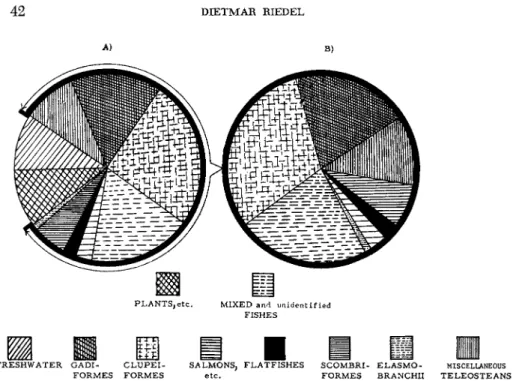
FIG. 1. A. Composition of world fish catch (including Crustacea, Molluscs, and plants). B. Composition of world sea fish catch, as to groups of fish.
TABLE I
ESTIMATES OF WORLD CATCH
Year
Total world catch (million metric tons)
Estimates
by Reference
1850 1.5-2.0 Meseck (1957)
1900 4.0 Meseck (1957)
1920 9.5 Meseck (1957)
1929 10.5 Staub, W. Staub (1951) 1932 10.2 Fels, Ε. Fels (1932) 1935 12.8 Staub, W. Staub (1951)
1938 20.5 FAO Yearbook
U.S. Fish and 1939 15.0 Wildlife Service
1944 17.8 Lübbert, Η. Lübbert (1950)
1948 19.09 FAO Yearbook
1953 24.91 FAO Yearbook
1955 28.12 FAO Yearbook
1956 29.60 FAO Yearbook
1957 29.96 FAO Yearbook
1958 33.72 FAO Yearbook
2. W O R L D F I S H E R I E S 43
this development on the basis of figures presented by various research workers in the field.
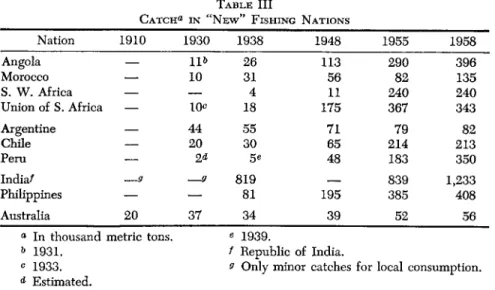
This appreciable growth in the food production of the seas is the result not only of an increased catch in the traditional fishing countries (Table I I ) , but also of the appearance of a number of new fishing nations which, at the start of World War II, figured hardly at all in the statistics (Table I I I ) .
The countries listed in Table I I were able to increase their total catch
TABLE II
TOTAL FISH CATCH» IN TRADITIONAL FISHING NATIONS
Nation 1910 1930 1938 1948 1955 1958 Japan 1,283 3,198 3,562 2,431 4,913 5,399
China0 2,000
— — —
2,518 6,050Soviet Union 1,000
—
1,523 1,490 2,500 2,800United States 1,000 1,463 2,253 2,410 2,739 2,741 Norway 515 995 1,153 1,504 1,813 1,739 United Kingdom 1,162 1,114 1,198 1,206 1,100 1,015
Germany0 168 314 776 d 846 845
a In thousand metric tons.
0 1910—estimated.
c Figures for 1910-38—Germany with prewar boundaries, for 1948-58, figures represent East and West Germany.
d Figures for 1948: West Germany—409,000 metric tons.
TABLE III
CATCH« IN N E W " FISHING NATIONS
Nation 1910 1930 1938 1948 1955 1958
Angola — I P 26 113 290 396
Morocco
—
10 31 56 82 135S. W. Africa — — 4 11 240 240
Union of S. Africa — 10c 18 175 367 343
Argentine — 44 55 71 79 82
Chile — 20 30 65 214 213
Peru — 5* 48 183 350
Indian —9 9 819 839 1,233
Philippines
—
— 81 195 385 408Australia 20 37 34 39 52 56
a In thousand metric tons. e 1939.
*> 1931. / Republic of India.
c 1933. ο Only minor catches for local consumption.
d Estimated.
44 D I E T M A R R I E D E L
in the lapse of half a century by 10 million metric tons. The "new" nations listed in Table II expanded fisheries chiefly in the postwar period—2 million metric tons since 1938, but 1.5 million as compared with 1948.
Thus, while the traditional fishing countries increased their fish catch, in comparison with 1938, by approximately 6 0 % , the catch in more re
cently developed areas grew 2 0 0 % in that same period. This is a clear indication of the successful efforts made by these countries to cover some of their animal protein needs from resources available in adjacent waters.
II. Present Catches
Approximately 360 million square kilometers of the earth's surface, i.e., more than 7 0 % of the total area of the globe, are covered by seas.
Due to hydrographic conditions in close relationship with the develop
ment by men of utilizable fish resources of the ocean so far, only the so-called continental shelf areas have been exploited to any degree. These shelves run more or less parallel to the coastlines of the continents but vary in width. The limit of this shelf area is generally given as the 200- meter depth line extending seaward. Adjoining this is the continental slope. Since the shelf areas generally comprise only 7% of the total ocean surface, this greatly narrows down those sea expanses which might be readily exploited. This restriction of the actual fishing area is, how
ever, partly removed by modern trawlers, which frequently can operate down to depths of 500 to 600 meters, prerequisites being, naturally, that available fish resources are ample enough to allow an economic catch and that hydrographic conditions (bottom profile) allow such fishing opera
tions. The catching of pelagic fish on the high seas at depths of more than 800 meters, e.g., deep-sea tuna, is at present of subordinate importance.
This means that an overwhelming proportion of ocean fishing is done in the vicinity of coasts.
The most important fishing equipment used in exploitation of the shelf areas is listed here in the order of importance: the various types of trawls; purse seine; drift (gill) net; manifold types of line fishing with different kinds of bait, etc.
In the immediate vicinity of the coast (inshore fisheries), correspond
ing equipment, but of smaller size, better adapted to small coastal vessels, is encountered. In addition, stationary types of catching devices such as traps, fences, and dams, play a role. In fresh-water fishing, special equip
ment generally is developed, although in its basic features it corresponds closely to that used for marine purposes. It is interesting to note that,
2. W O R L D F I S H E R I E S 45 with the obvious exceptions of catching fish by means of birds, both ocean and fresh-water fishing equipment exhibit certain general common characteristics, encountered in almost every fishing country.
The present total catch of fish and shellfish is reported as 29 million metric tons; certain estimates, in fact, give figures as high as 35 million metric tons. Geographic analysis shows that by far the largest proportion of this catch, approximately 25 million metric tons, that is, 9 1 % of the total, comes from the Northern Hemisphere. The southern part of the globe accounts for only 9%—2 million metric tons. The basic cause for this, naturally, is hydrographic conditions, which make the Northern Hemisphere poor in variety, but rich in quantity. In addition, the con
tinually growing removal through fishing undoubtedly has the secondary effect of enhancing the natural productivity. This interpretation would have been inconceivable, if attention were not focused on the important fact that the population density close to fishing areas of the Northern Hemisphere far exceeds that of the Southern Hemisphere. The effect of needs and economy, consequently, enter into the picture and most likely are reflected in the growth of the catches in this northern area.
The highest-yielding fishing grounds of the Northern Hemisphere are located in the northern section of the Atlantic and Pacific oceans—specif
ically along the west coast of North America, and on the East Asiatic con
tinental shelves, as well as those of western Europe and of northwestern North America.
The catching areas along the west coast of North America include the Bering Strait and stretch along the coast of Alaska and British Columbia, and as far south as the equator. Here the great encounter takes place between the cold Alaska Current and the warm North Pacific Drift. In the northeast, this fishing region meets the outlying fringes of the East Asiatic region. This includes part of the same Bering Strait, the coastal waters of Kamtchatka and those of the Kuriles, of Sakhalin, the waters surrounding the Japanese islands, and extending into the East China and South China Seas. The main part of this region also covers the merging of major ocean currents—the warm Kuro Shio from the south and the cold Oya Shio coming from the Sea of Okhotsk and the Bering Sea.
The third major area for marine fisheries is the American northeastern coastal region, stretching from Labrador down to Cape Hatteras and in
cluding the rich Newfoundland banks. This is the area where the cold Labrador Current mixes with western outrunners of the warm Gulf Stream.
46 D I E T M A R R I E D E L
Finally, the northwestern European fishing region is located where the warm Gulf Stream directly encounters various cold currents from the north. To this region belong the White Sea, Barent's Sea, the North Sea, the eastern part of the North Atlantic, the Baltic, the English Channel, the Bay of Biscay and also, in part, the coastal waters of Northwest Africa.
If the world catch (average 1955-57) is referred to individual con
tinents, their share of the total is shown in Table IV.
TABLE I V
QUANTITY AND PERCENTAGE OF TOTAL WORLD CATCH OF FISH PER CONTINENT OR MAJOR DIVISION THEREOF ( END OF FIFTDZS )
Continent or region Million metric tons % of total
Asia 12.13 42
Europe 7.78 27
North America 4.09 13
Soviet Union 2.55 9
Africa 1.76 6
South America 0.85 2.5
Oceania 0.12 0.5
29.28 Ίοο
This list bears out in full the predominance of the Northern Hem
isphere. The obvious increases in the catches of South America and southern Africa, however, should not be forgotten.
A . I N L A N D F I S H E R I E S
The world catch of fresh-water fish amounts roughly to 3 million metric tons, one-tenth of the total fish catch. It should not be overlooked, however, that the fresh-water fish include varieties of high value, which in several countries are in great preference. They could, however, under no circumstances take over the position held by ocean fish. There are a few remarkable exceptions in this respect, e.g., Yugoslavia, Israel, etc.
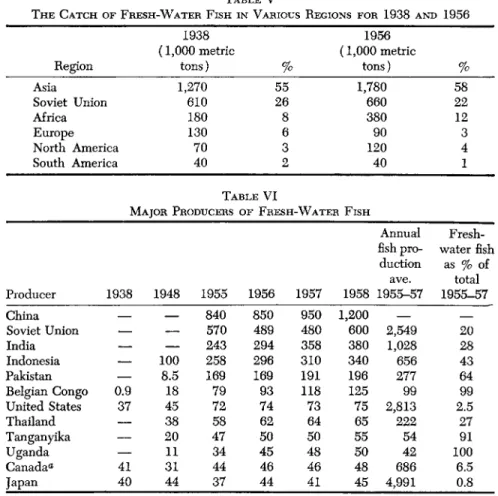
The catch of fresh-water fish in different regions of the earth is shown in Table V.
These figures allow a comparison between prewar and postwar con
ditions. The percentage figures indicate the relative importance of each continent and the Soviet Union as to fresh-water fish yield.
With the exception of Europe, the yield from lakes, rivers, and other fresh-water bodies could be greatly augmented. The decline in European fresh-water fisheries can be directly attributed to the growing degree of
2. W O R L D F I S H E R I E S 47 pollution of major rivers and to constructional activities of a technical nature in the areas supplying and channeling water to lakes and rivers.
Table VI gives the catch figures for countries that are major producers of fresh-water fish.
TABLE V
T H E CATCH OF FRESH-WATER FISH IN VARIOUS REGIONS FOR 1938 AND 1956
1938 195(5 (1,000 metric (1,000 metric
Region tons) % tons) %
Asia 1,270 55 1,780 58
Soviet Union 610 26 660 22
Africa 180 8 380 12
Europe 130 6 90 3
North America 70 3 120 4
South America 40 2 40 1
TABLE V I
MAJOR PRODUCERS OF FRESH-WATER FISH
Annual Fresh- fish pro- water fish
duction as % of ave. total Producer 1938 1948 1955 1956 1957 1958 1955-57 1955-57 China
— —
840 850 950 1,200— —
Soviet Union
— —
570 489 480 600 2,549 20India
— —
243 294 358 380 1,028 28Indonesia
—
100 258 296 310 340 656 43Pakistan
—
8.5 169 169 191 196 277 64Belgian Congo 0.9 18 79 93 118 125 99 99 United States 37 45 72 74 73 75 2,813 2.5 Thailand
—
38 58 62 64 65 222 27Tanganyika
—
20 47 50 50 55 54 91Uganda
—
11 34 45 48 50 42 100Canada0 41 31 44 46 46 48 686 6.5 Japan 40 44 37 44 41 45 4,991 0.8
a Excluding Newfoundland.
Fresh-water fish are caught in running waters, such as brooks and rivers, in lakes or ponds, and are also raised by cultivation. Generally, fish from all these three sources are combined in the statistical figures given for fresh-water fisheries. A few countries provide detailed informa
tion about the relative importance of each of these sources (Table V I I ) . Certain difficulties arise in presenting the fisheries statistics for brack-
48 D I E T M A R R I E D E L
ish-water areas. Should fish caught in lagoons be considered salt-water or fresh-water fish? Fish originating in such waters certainly do not repre
sent insignificant quantities. Quite extensive fish cultivation with very good yields is to be found in such brackish-water areas. It should also be noted that some ocean fish are raised in salt-water ponds for food purposes.
TABLE V I I
ORIGIN OF FRESH-WATER FISH (AVERAGE 1 9 5 5 - 5 7 )a
From rivers,
canals, and From Fish Country streams lakes cultivation Total
United States 42 31 — 73.0
Japan — — 11.0 40.0
Italy — 3.5 — 10.3
Poland0 1.2 3.6 — 7.5
Israel — 1.1 7.2 8.3
Egypt 6.8 29.2
—
37.3Thailand — — 34.9 288.0
ab Values given in thousand metric tons.
From brackish waters, 2.7.
B . O C E A N F I S H E R I E S
The present world catch of sea fish amounts to approximately 26.1 million metric tons—average 1955-57—according to the figures given by the F A O . The importance of the various fishing areas to the total world catch becomes evident through Table VIII.
TABLE V I I I
RELATIVE IMPORTANCE OF MAJOR MARINE AREAS
Million Million
metric metric
Ocean region tons % Ocean region tons % Mediterranean and
N.W. Pacific 7.7 30 Black Sea 1.0 4 N.E. Atlantic« 7.5 29 E. Central Pacific 0.7 2.5 N.W. Atlantic 3.1 12.0 N.E. Pacific 0.4 1.5 Indo-Pacific 3.0 11.5 W. Indian Ocean0 0.3 1.0 W. Central Atlantic0 1.0 4 E. Centr. Atlantic 0.1 0.25 S.E. Atlantic 1.0 4 S.W. Pacific 0.1 0.25
a Includes the North Sea and the Baltic.
&
Includes the Caribbean.
c Includes the Red Sea and the Arab Sea.
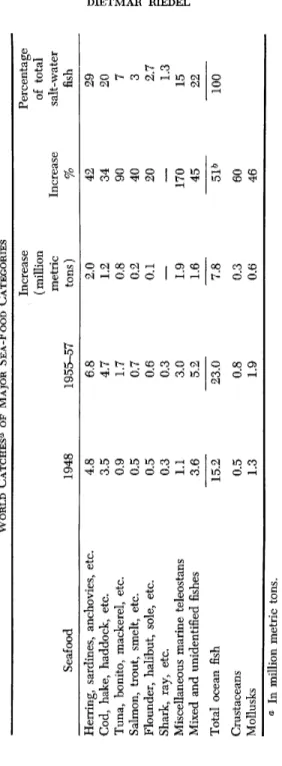
2. W O R L D F I S H E R I E S 49 The share and percentage of major economic fish species in the total world catch (fresh-water fish excluded) becomes evident through Table IX. All figures given are approximate. The largest increases in the post
war period refer to catches of tuna, mackerel, etc., approximately 9 0 % , when 1957 is compared with 1948. Herring, salmon, and flatfish follow next in the order indicated. Catches of sharks and rays have stagnated.
Remaining species (mixed and unidentified fishes) show a catch growth of 4 5 % above the 1948 figure. This is all given in relative figures. In ab
solute terms the herring group leads, with 2 million metric tons, followed by the two mixed groups of various teleosteans (unspecified and un
identified fishes), 1.9 million metric tons and 1.6 million metric tons, respectively (Table I X ) .
1. Herring and Related Fishes
Herring and herring-like fishes, such as sardines and anchovies, un
doubtedly constitute the dominant group of the world fish catch. This is explained by their mass occurrence in all parts of the globe. They appear in big shoals, thus making intensive and profitable fishing possible. Not only can modern fishing equipment be used, but such traditional sta
tionary fishing devices as traps and fences are also effective, particularly in areas where they can be installed in the pathways of migrating anad- romous species or where these species seasonally and regularly appear for spawning or feeding.
The economic importance of herring and related species is evident from Table X . The total catch of herring, sardines, anchovies, etc., amounts to approximately 7 million metric tons, constituting no less than one-fourth of the total world sea-fish catch. Table X indicates the break
down in percentages. All figures are approximate. Some comments re
garding major species seem justified.
The Atlantic herring (Clupea harengus) and its Pacific counterpart (Clupea pallasi) are the dominant representatives of the family Clu- peidae. While C. harengus inhabits the coastal waters on both sides of the North Atlantic and constitutes the basis of a profitable and coveted fishing industry on the European side particularly, C. pallasi is its coun
terpart in the North Pacific, although in no way comparable in quantity.
Ethmidium maculatum takes over the role of the Pacific herring along the Pacific coast of South America where it is caught in noteworthy quan
tities, relatively speaking, by Chile (150 metric tons, i.e., 0.5% of the total fish catch) and by Peru (18,600 tons, i.e., 17% of this nations ocean
TABLE IX WORLD CATCHES« OF MAJOR SEA-FOOD CATEGORIES Increase Percentage (million of total metric Increase salt-water Seafood 1948 1955-57 tons) % fish Herring, sardines, anchovies, etc. 4.8 6.8 2.0 42 29 Cod, hake, haddock, etc. 3.5 4.7 1.2 34 20 Tuna, bonito, mackerel, etc. 0.9 1.7 0.8 90 7 Salmon, trout, smelt, etc. 0.5 0.7 0.2 40 3 Flounder, halibut, sole, etc. 0.5 0.6 0.1 20 2.7 Shark, ray, etc. 0.3 0.3 — — 1.3 Miscellaneous marine teleostans 1.1 3.0 1.9 170 15 Mixed and unidentified fishes 3.6 5.2 1.6 45 22 Total ocean fish 15.2 23.0 7.8 51*> 100 Crustaceans 0.5 0.8 0.3 60 Mollusks 1.3 1.9 0.6 46 a In million metric tons. h Figure represents an average of increased percenta ges listed above.
50 DIETMAR RIEDEL
2. WORLD FISHERIES 51
CATCH OF HERRING TABLE X AND RELATED FISHES IN SELECTED AREAS AND COUNTRIES^ Area 1938 1948 1955 1956 1957 1955-57 Percentage of herring catch Total ocean fish 1955-57
Herring fishes (%) Africa — 130 440 550 700 563 9.4 1,763 32 America, North — 1,180 1,280 1,480 1,200 1,320 22.0 4,030 33 America, South — 20 140 180 300 207 3.4 853 24 Asia — 840 1,100 1,060 1,290 1,150 18.5 12,127 9.5 Europe — 2,310 2,760 2,960 2,610 2,777 46.7 7,780 36 Total — 4,480 5,720 6,230 6,100 6,017 100 26,553 26 Norway 663 964 1,140 1,380 1,020 1,180 17 1,917 60 United States 840 825 1,039 1,159 957 1,052 15.5 2,813 38 Soviet Union — 330 680 780 980 810 12 2,549 32 Japan 1,128 567 744 677 764 728 10.5 5,025 14.5 W. Germany — 173 340 273 280 298 4.5 767 38 Canada0 186 308 226 306 229 254 3.7 720 35 S.W. Africa — 3 227 231 228 229 3.3 241 92 Denmark 14.5 30 196 188 226 203 2.9 474 42 India 17 — 124 114 293 177 2.6 1,028 17 Spain 149 127 144 161 165 157 2.3 759 21 United Kingdom 284 277 182 151 131 155 . 2.3 1,055 14.5 Morocco 19 43 63 76 111 83 1.2 105 79.5 Netherlands 115 165 158 139 134 144 2.1 306 47 Angola 3 17 11 155 243 136 2.0 369 37.5 Portugal 121 81 98 106 121 108 1.6 454 23.5 Union S. Africa — 50 122 76 108 102 1.5 335 30.5 Philippines — — 103 101 99 101 1.5 403 25 Iceland 156 150 54 101 118 91 1.3 500 18 a Source: Food and Agriculture Organization of the United Nations (1957a). b Excluding Newfoundland.
52 D I E T M A R R I E D E L
fishing. It is called a mackerel by the Chileans and "machete" by the Peruvians.
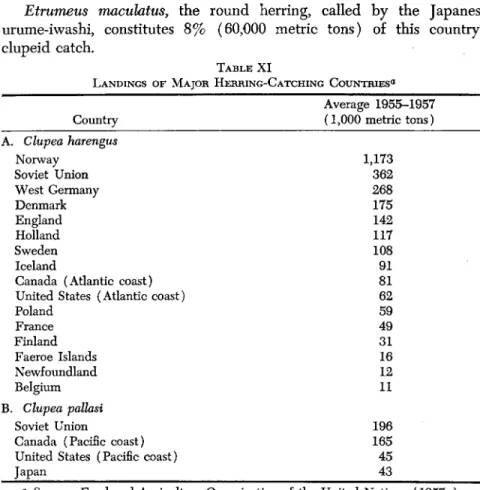
Etrumeus maeulatus, the round herring, called by the Japanese urume-iwashi, constitutes 8% (60,000 metric tons) of this country's clupeid catch.
TABLE XI
LANDINGS OF MAJOR HERRING-CATCHING COUNTRIES0
" Average 1955-1957 Country (1,000 metric tons) A. Clupea harengus
Norway 1,173 Soviet Union 362 West Germany 268 Denmark 175 England 142 Holland 117 Sweden 108 Iceland 91 Canada (Atlantic coast) 81
United States (Atlantic coast) 62
Poland 59 France 49 Finland 31 Faeroe Islands 16 Newfoundland 12 Belgium 11 B. Clupea paUasi
Soviet Union 196 Canada (Pacific coast) 165
United States (Pacific coast) 45
Japan 43
a Source: Food and Agriculture Organization of the United Nations (1957a).
The Brevoortia species serves as a classic example of a fish species that is caught exclusively for the industrial production of flour and oil.
The annual catch on the Atlantic coast of the United States, the chief region where this species is taken, at present amounts to 855,000 metric tons (average 1955-57), i.e., more than 8 2 % of the United States catch of herring fishes.
To the group of anadromous and brackish-water clupeids belong the species mentioned in Table XII. Also indicated in this table are the parts of the world in which these fishes are important commercially.
2. W O R L D F I S H E R I E S 53 Sardines constitute approximately one-fourth of the total world catch of herring fishes, i.e., 1.6 million metric tons, consisting chiefly of the species Sardina (Clupea), Sardinops, and Sardinella.
TABLE X I I
ANADROMOUS AND BRACKISH-WATER CLUPEIDS
Species A. Anadromous species
Pomofobus spp. (Alewives) Shad6 (Clupea ahsa, C. finta)
(Caspiahsa spp., Ahsa spp.) B. Brackish-water species
Chanos chanos (milkfish) Hilsa ilisha
Chief area for fishings
United States ( 2 3 ) ; Canada ( 7 . 2 ) Soviet Union ( 4 4 ) ; United States ( 6 . 7 ) Canada ( 0 . 7 ) ; Korea ( 0 . 7 )
Formosa ( 2 4 )
Pakistan ( 3 4 ) and other S.E.
Asian countries
a6 Figures in parentheses indicate catch in 1,000 metric tons, average 1 9 5 5 - 5 7 . Shad is important to the Soviet fishing industry in the Caspian and Black Seas.
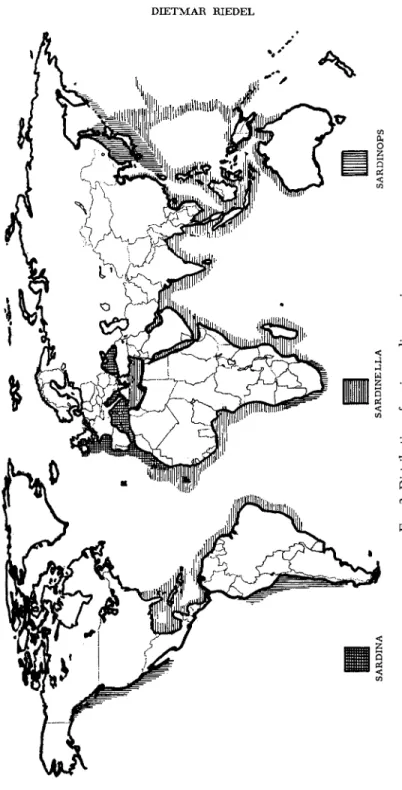
In relation to the volume of fishing and with regard to geographic distribution, the genus Sardina plays a leading role in European waters (southwest Atlantic coast, the Mediterranean, the Black Sea, and the northwest African coast (see Fig. 2 ) . Portugal catches the largest quan
tity (Table X I I I ) of Clupea (Sardina) pilehardus, compared to other countries. Morocco and Spain follow next.
TABLE X I I I
AVERAGE 1 9 5 5 - 1 9 5 7 CATCHES OF Clupea pihhardus
Percentage of total catch Country ( 1 , 0 0 0 metric tons) of herring fishes
Portugal 1 0 2 9 4
Morocco 8 3 9 9
Spain 7 8 . 5 5 0
France 3 3 . 6 3 7
The species Sardinops is caught mainly off the Pacific coast of the Americas, off the southeast Atlantic coast, and around the Japanese islands. The catches vary immensely, however: the average for 1955-57 was 76,400 metric tons, with 7,400 metric tons in 1956, and 191,500 tons in 1957.
Sardinella has by far the widest distribution. Complete statistical data are, however, available only for India ( S . longiceps and other species).
54 DIETMAR RIEDEL
FIG. 2. Distribution of major sardine species.
2. W O R L D F I S H E R I E S 55
The annual catch of Spain is 3,500 tons (average 1955-57). It should be noted, however, that the actual percentage of Sardine^ in the clupeid catch must be considerably higher, as this species is far more prevalent than it has been possible to establish statistically so far.
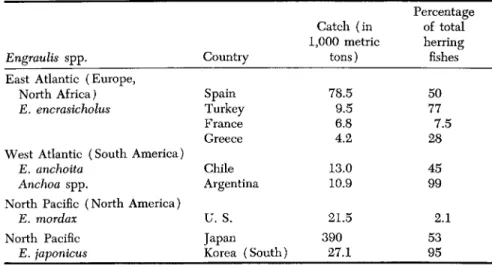
The Engraulidae family shows a similar distribution (with few ex
ceptions) to that of the Clupeidae (see Table X V ) .
TABLE X I V
AVERAGE 1955-1957 CATCH OF VARIOUS Sardinops SPP.
1,000
Metric Percentage of total catch
Country tons of herring fishes Species Southwest Africa 229 100 S. oceUata
Japan 208 28 S. mehnostica
Union of S. Africa 102 100 S. oceUata United States« 39.4 3.7 S. caerulea
Chile 15.8 55 S. sagax
Peru*> 88.8 84 S. sagax plus Engraulis encrasicholus
Australia 0.1 50 S. neopilchardus
Venezuela 19.5 99 S. sagax
Formosa 25.0 50 S. mehnostica
a In 1938-50 3,700 metric tons, constituting 90% of the Pacific clupeid catch of the United States.
0 Including anchovies, etc.
0 Including anchovies, etc.
TABLE XV
STATISTICS FOR CATCHES ( 1 9 5 5 - 1 9 5 7 ) OF MEMBERS OF THE ENGRAULIDAE FAMELY IN VARIOUS COUNTRIES
Percentage Catch (in of total 1,000 metric herring
Engraulis spp. Country tons) fishes
East Atlantic (Europe,
North Africa) Spain 78.5 50
E. encrasicholus Turkey 9.5 77
France 6.8 7.5
Greece 4.2 28
West Atlantic (South America)
E. anchoita Chile 13.0 45
Anchoa spp. Argentina 10.9 99
North Pacific (North America)
E. mordax U. S. 21.5 2.1
North Pacific Japan 390 53
E. japonicus Korea (South) 27.1 95
56 D I E T M A R R I E D E L
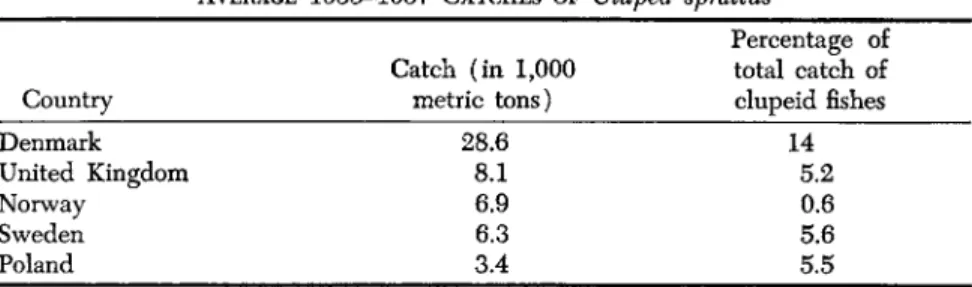
Sprats are typical inhabitants of the North European Atlantic coastal areas. The chief species is C. sprattus.
TABLE XVI
AVERAGE 1 9 5 5 - 1 9 5 7 CATCHES OF Clupea sprattus
Percentage of Catch (in 1 , 0 0 0 total catch of Country metric tons) clupeid fishes
Denmark 2 8 . 6 1 4
United Kingdom 8 . 1 5 . 2
Norway 6 . 9 0 . 6
Sweden 6 . 3 5 . 6
Poland 3 . 4 5 . 5
Two hundred thousand metric tons of sprats and sprat-like fishes are caught by the Soviet Union in the Caspian, the Sea of Azov, and the Black Sea. They belong mainly to Clupea sprattus var. phalevicus and ClupeoneUa spp.
2. Codfish and Related Species
With a total world catch amounting to 5 million metric tons, i.e., 21.5%, codfish take second place in world fisheries statistics. The division of this catch is shown by continent in Table XVII, and by country in Table XXI.
TABLE XVII
AVERAGE 1 9 5 5 - 1 9 5 7 CATCHES OF CODFISH AND RELATED SPECIES
Total catch of cod Percentage of and related species total world catch Continent or region (million metric tons) of codfish
Europe 2 . 8 3 6 0 . 5
Soviet Union 0 . 6 2 1 3
North America 0 . 7 1 1 5
Asia 0 . 3 3 7
South America 0 . 1 1 2 . 5
Africa 0 . 0 8 2
Oceania 0 . 0 1
—
4 . 6 9 1 0 0
Cod (Gadus callarias) is, with herring ( C . harengus), the most im
portant commercial species of the North Atlantic. Owing to its geograph
ical distribution, which covers the waters of Western Europe from Por
tugal to the White Sea (including the North and Baltic Seas), Iceland, and southern Greenland, as well as the east coast of North America, all
2. W O R L D F I S H E R I E S 57
the fishing nations bordering on these areas participate in catching this species (Table X V I I I ) .
TABLE XVIII
CATCH OF COD (Gadus callarias)
Catch average Percentage of cod 1955-1957 in total amount of Ocean area Country (1,000 metric tons) codfish North East Atlantic Soviet Union 572.3 94
(including Baltic, England 372.4 59 North, and Barents Norway 246.2 60
Seas) Iceland 229.6 85
West Germany 91.5 48.5
Portugal 70.7 86
Spain 36.0 23
Denmark 49.8 68
France 65.8 48.5
Faeroe Islands 82.5 91
Sweden 27.9 60
Northwest Atlantic United States 15.7 7 (including Greenland Canada 103.2 58
waters) Newfoundland 177.7 82
Greenland 28.2 99
Gadus macrocephalus is the North Pacific counterpart of Gadus cal- larias. It does not, however, by any means approach the economic im- portance of the latter, as Table X I X clearly indicates.
TABLE XIX
CATCH OF PACIFIC COD (Gadus macrocephalus)
Percentage of Catch average Pacific cod in 1955-1957 total amount of Ocean area Country (1,000 metric tons) codfish
North Pacific Japan 46.80 16
United States 5.57 2
Canada 2.13 3
Korea 2.87 8
Theragra chalcogramma, (Alaskan) pollack, is, in view of the annual catch figures, the principal cod species of the North Pacific, while its Atlantic counterpart, Gadus poUachius, plays an insignificant role, as Table X X shows.
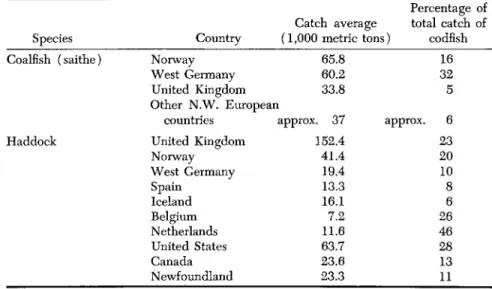
Second place in the North Atlantic cod fisheries is taken by Gadus virens (coalfish) and G. aegleftnus (haddock). See Table X X I .
58 D I E T M A R R I E D E L
While the various cod species (Gadidae) are primarily located in the Northern Hemisphere, their place in the southern part of the globe is taken by the Merlucciidae with several species of the genus Merluccius.
TABLE XX
COMPARATIVE IMPORTANCE OF POLLOCK AND ALASKAN POLLOCK IN ANNUAL CATCH OF CODFISH, 1 9 5 5 - 1 9 5 7
Percentage of Catch average the total amount Ocean area Country ( 1 , 0 0 0 metric tons) of codfish Pacific (Alaska pollock) Japan 2 4 9 8 4
Korea 3 4 . 1 9 3
Atlantic (pollock) Canada 1 7 . 1 9 . 7
United States 1 1 . 8 5 . 2
Europe 7
(Norway, Sweden, United Kingdom, and Spain)
TABLE XXI
AVERAGE CATCHES ( 1 9 5 5 - 1 9 5 7 ) OF COALFISH AND HADDOCK IN THE NORTH ATLANTIC
Percentage of Catch average total catch of Species Country ( 1 , 0 0 0 metric tons) codfish Coalfish (saithe) Norway 6 5 . 8 1 6
West Germany 6 0 . 2 3 2 United Kingdom 3 3 . 8 5 Other N.W. European
countries approx. 3 7 approx. 6
Haddock United Kingdom 1 5 2 . 4 2 3 Norway 4 1 . 4 2 0 West Germany 1 9 . 4 1 0 Spain 1 3 . 3 8 Iceland 1 6 . 1 6 Belgium 7 . 2 2 6 Netherlands 1 1 . 6 4 6 United States 6 3 . 7 2 8 Canada 2 3 . 6 1 3 Newfoundland 2 3 . 3 1 1 The species Μ. merluccius, the hake, could almost be looked upon as a link between the North and the South, as it is important for both the South European Atlantic and for the Mediterranean countries as well as some Northwest African states (Table X X I I ) .
Merluccius capensis is of special importance for the South African
2. W O R L D F I S H E R I E S 59 region (Union of South Africa and South West Africa), where it repre
sents the entire catch of codfish and amounts to 60,000 and 400 metric tons respectively.
Merluccius hubbei constitutes 9 0 % (23,000 metric tons) of the catch of codfish in Argentine.
TABLE X X I I
IMPORTANCE OF HAKE CATCH ( 1 9 5 5 - 1 9 5 7 ) IN EUROPE AND AFRICA
Continent Country
Merluccius merluccius ( 1 , 0 0 0 metric tons)
Percentage of total amount of
codfish
Europe Spain® 1 5 . 3 1 0
United Kingdom 1 4 . 6 2 Portugal 1 2 . 0 1 4 . 5
Greece 2 . 0 9 9
Yugoslavia 0 . 3 9 9
Africa Angola 0 . 2 9 9
Morocco 0 . 2 9 9
a In addition, small hake ("pescadilla")—64,900 metric tons ( 4 1 % ) .
Merluccius bilinearis substitutes to a certain degree for M. merluccius along the South Atlantic coast of the United States. With an annual catch of 42,000 metric tons, it represents 1 8 % of all codfish caught on the Atlantic coast of the United States.
Merluccius gayi holds special importance for Chile, as it represents 100% (84,500 metric tons) of this country's catch of codfish. This same species is also of some importance in New Zealand waters.
Finally, the species M. productus on the southern Pacific coast of the United States deserves mention, although the catch (500 metric tons) represents an economically negligible quantity.
3. Tuna, Mackerel, and Rented Species
In third place on the list of economically important ocean fishes come the tuna, mackerel, and related species. Together, they amount to 1.68
(average 1955-57) million metric tons ( 6 . 5 % ) of the total sea-fish catch.
Table X X I I I shows how this group is broken down according to continent.
Because of the often quite cosmopolitan character of several tuna species (Thunnus spp., Euthynnus spp., Neothunnus spp., Germo spp., Sarda spp., etc.), the same species frequently play a role in the fisheries of countries located in widely separated parts of the globe and in widely different seas. The total world catch of tuna fish in the restricted sense
60 D I E T M A R R I E D E L TABLE X X I I I
T H E WORLD CATCH OF TUNA, MACKEREL, AND RELATED SPECIES ( 1 9 5 5 - 1 9 5 7 )
Percentage of the total Average catch world catch of tuna, Continent or region (million metric tons) mackerel, etc.
Asia 1 . 0 2 6 0
Europe 0 . 2 3 1 4
Soviet Union 0 . 0 1 0 . 5
North America 0 . 1 8 1 0 . 5
South America 0 . 1 4 8 . 5
Africa 0 . 0 9 5 . 5
Oceania 0 . 0 2 1 . 0
1 . 6 9 1 0 0
was, on the average for 1955-57, 580,000 metric tons. Table X X I V shows how this quantity is broken down among the various fishing nations.
TABLE X X I V
BREAKDOWN OF 1 9 5 5 TUNA CATCH BY COUNTRY
Tuna catch 1 9 5 5 Percentage of total world Country 1 , 0 0 0 metric tons0 catch of tuna fishes
Japan 2 6 6 4 6 . 2
United States0 1 4 8 2 6 . 0
Peru 6 0 1 0 . 8
Spain 3 6 6 . 1
France 1 7 3 . 1
Norway 1 2 2 . 1
Portugal 8 . 0 1.4
Morocco 8 . 0 1 . 4
Formosa 7 . 0 1.2
Angola 7 . 0 1.2
5 6 9 . 0 1 0 0
a Source: La Peche Maritime 5 / 1 9 5 8 . Rounded figures.
&
Largely from Central and South American waters.
On the basis of 1956 catch figures, the following three tuna species are most important (figures indicate 1,000 metric tons): yellowfin tuna (157), skipjack (164), and albacore ( 3 3 ) .
The leading mackerel-fishing nation is Japan (261.9) (figures in 1,000 metric tons and average for 1955-57), followed by India (42.7), France (36.1), the United States (20.7), the Union of South Africa (20.1), Spain (14.0), the Netherlands (13.9), Portugal (13.2), and Norway (12.2).
2. W O R L D F I S H E R I E S 61 The Pacific bonito (68,969 metric tons, average for 1954-56) consti
tutes 8 5 % of the Peruvian catch. Spain leads the catch of the Atlantic bonito (the pelamid) with an annual landing (1955-57) of 22,200 metric tons.
4. Salmon and Salmonid Fishes
The salmon fishes (salmon, trout, smelt, etc.) play an important role almost exclusively in the Northern Hemisphere, particularly in the North
TABLE X X V
CATCH OF SALMON, TROUT, AND S M E L T0
Percentage of total Continent Average catch 1955-57 world catch of or region (1,000 metric tons) salmon fishes
North America 225 34
Soviet Union (Pacific) 163 25
Asia 200 30
Europe 70 11
658 100
a In these figures fresh-water salmon are also included. This catch is minor, how
ever, and—compared to the marine production—negligible.
Pacific. Here the total annual catch amounts to 700,000 metric tons. The figures for the various continents are given in Table XXV.
The Pacific salmons constitute the bulk of the catch of this group of fishes. The outstanding genus is Oncorhynchus in the Northern Pacific.
Number of (lOOOmT) mother ships
Number of fishing boats
• 6 0 0
•- 5 0 0 - 4 0 0
•· 3 0 0
•· 2 0 0 -· 1 0 0
I 1 1 j 1 1 , 1
1952 53 54 55 5 6 57
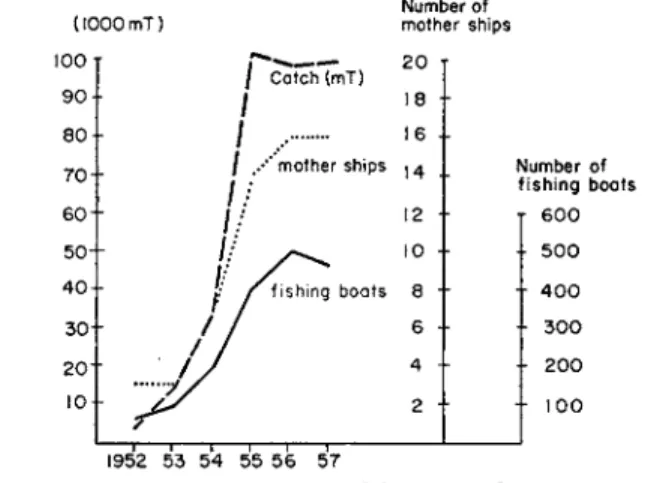
FIG. 3. The growth of Japanese salmon fisheries in the postwar period (abbrevia
tion mT = metric tons).
62 D I E T M A R R I E D E L
The United States, Japan, and the Soviet Union all participate in these fisheries. The following species are commercially important: O. tschawyt- scha, O. keta, O. kisutsch, O. nerka, O. gorbuscha, O. mason.
Japan lands the largest quantity of salmon, 201,233 metric tons (aver
age for 1955-57), constituting 9 4 % of its total catch of salmonid fishes, followed by the Soviet Union (163,000 metric tons = 9 8 % ) , the United States (141,000 metric tons = 9 5 % ) and Canada (56,100 metric tons = 9 0 % ) (Fig. 3 ) .
The Atlantic genus Salmo, contrary to its Pacific counterpart, Oneor- hynchus, plays quite an insignificant role. For all practical purposes, there is only one species—S. solar, an anadromous type. In the coastal waters of the North European countries about 4,000-7,000 metric tons are caught annually.
5. Ffotfishes
With a total catch of 640,000 metric tons, i.e., 2.4 % of the world fish
eries, the flatfishes (flounder, halibut, sole, etc.) take fifth place in the statistics (Table X X V I ) .
TABLE X X V I CATCH OF FLATFISHES
Average catch Percentage (1955-1957) of of total
Continent flatfishes world catch
or region (1,000 metric tons) of flatfishes
Europe 195 31
Asia 160 25
Soviet Union 145 23
North America 135 21
635 100
The leading flatfish-catching nations are listed in Table XXVII.
Statistically measured, plaice (Pleuronectes pkxtessa) takes the first place among flatfishes.
6. Elasmobranchs
Shark and rayfish represent only about 1% (310,000 metric tons—
average 1955-57) of the total world catch. The countries listed in Table X X I X contributed most.
7. MisceUaneous Fishes
In the Yearbook of Fishery Statistics of the FAO, the following fish types are lumped together under the heading "Miscellaneous Marine
2. WORLD FISHERIES 6 3
TABLE XXVII LANDINGS OF FLATFISHES
Average catch 1955-1957 Country (1,000 metric tons)
Soviet Union* 142.7
Japan 142.2
United States 75.1
Canada0 and Newfoundland 53.7
United Kingdom 56.9
Denmark 41.9
Netherlands 19.4
a Ninety-three per cent refers to the Pacific area.
0 Twenty-six per cent landed in the Pacific coast.
TABLE XXVIII
FLATFISH CATCHES AS TO SPECIES
Average catch (1956) Species (1,000 metric tons)0
Pleuronectes phlessa 93
Hippoglossus stenolepis 38
Flounders (various species) 27
Paralichthys olivaceus 13
Hippoglossus hippoglossus and
Reinhardtius hippoglossus 10
Pleuronectes flesus 8
a Rounded figures. The flatfish production of the Soviet Union is not included, as figures broken down this way are not available.
TABLE XXIX CATCH OF ELASMOBRANCHS
Average catch (1955-1957) Country (1,000 metric tons)
Japan 94.5
United Kingdom 28.3
India 21.8
Norway 20.8
France 15.1
Pakistan 13.0
Taiwan 14.8
South Korea 12.6
Spain 12.2
Others 76.9
310
64 D I E T M A R R I E D E L
Teleosteans." To this group belong barracudas (Sphyraena spp.), perches (Sebastes spp., Sebastodes spp., Epinephelus spp., among others), jacks (Caranx spp., Trachurus spp., Serioh spp.), croakers (Sciaena spp., among others), pompanos, breams (Sparidae, etc.), basses (Serranidae), mullets (Mugilidae), various eel species, wolf fish, gurnards, garfish, etc.
From the many species included in this group, four are here singled out (Table X X X ) as important for their quantity.
TABLE X X X
SOME IMPORTANT TELEOSTEAN CATCHES
Catch in 1956 Species (1,000 metric tons)
Jacks 366
Saury 332
Horse mackerel 307
Redfish 260«
a Source: Approximately a fourth each, landed by the United States and Iceland, and 40% by West Germany and 5% by the United Kingdom.
A considerable part ( 1 8 % ) of the world catch is composed of not too closely identified fish species. Of the 5.2 million metric tons of fish put together under this heading, 1.7 million refer to China. Landed by Japan are 280,000 metric tons, 250,000 metric tons by the Philippines, and, finally, 100,000 metric tons by Burma.
8. Survey of Cardinal Fish Species
Taking into account the deficiencies of such a survey, an effort is made in Table X X X I to specify those species which constitute a substan
tial part of the world catch. This list carries clear evidence that the her
ring (Clupea harengus) stands out as the leading exploited species, closely followed by the cod (Gadus caUarias).
111. Utilization of the Ocean Fish
Hardly half of the world catch ( 4 2 % ) is offered the consumer in fresh (raw) condition. About one-fourth ( 2 4 % ) is converted into salted, smoked, or marinated products manufactured from various species.
Eighteen per cent goes into the production of oil and meal. Eight per cent is marketed frozen and 9 % is canned. The remaining 3 % represent miscellaneous products (Fig. 4 ) . A more comprehensive and detailed discussion on the role of fish processing will be found in Volume II.
2. W O R L D F I S H E R I E S 65 Fish meal and fish oil have become important in the past twenty years, the former as a valuable protein source for domestic animal feed
ing (see Volume II, chapter 9 ) and the latter as the raw material of the edible fat industry.
TABLE X X X I
CARDINAL SPECIES OF WORLD FISH CATCH0
Species (1,000 metric tons)
Clupea harengus 2,534
Gadus calhrias 2,425
Brevoortia spp. 333
Clupea pilchardus 486
Engraulis japonicus 376
Caranx spp. 366
Colohbis saira 332
Trachurus trachurus 307
Gadus aeglefinus 279
Scomber japonicus 266&
Theragra chalcogramma 266
Sebastes marinus 260
Sardinops oceUata 255
Oncorhynchus spp. 234
Sardinops mehnostica 206
Gadus virens 194
Katsuwonus pelamis 1,640
Neothunnus macropterus 157
Engraulis enchrasicholus 105
Thunnus alalunga 99
Sarda chilensis 84
Pleuronectes platessa 93
Merluccius gayi 78
Sardinops sagax 68
Clupea pallasi 66
Merluccius capensis 60
Merluccius merluccius 47
Gadus macrocephalus 46
Merluccius bilinearis 42
a Years of reference 1955 and 1956, respectively. The production of the Soviet Union is not included. When figures from this source become available, changes might occur, although presumably not of major importance. 0
Only the Japanese catch.
A. F I S H M E A L
The present world production of fish meals is of the magnitude of 1.4 million metric tons (1955-57). This corresponds to an increase of 2 4 0 %
66 D I E T M A R R I E D E L
since 1938 (0.6 million tons). The most important producing countries are listed in Table XXXII.
FRESH CURING MEAL CANNING FREEZING MISCEL-
FISH AND LANEOUS OIL
FIG. 4 . World utilization pattern for fish, including shellfish. Percentage of live weight.
TABLE XXXII MANUFACTURE OF FISH MEAL
Production
( 1 , 0 0 0 metric Increase
tons) 1 9 3 ^ - 5 5 / 5 7 Major Country ( 1 9 5 5 - 5 7 ) « (times) source United States 3 5 4 . 8 2 . 9 Menhaden
Norway 2 1 8 . 6 3.1 Herring
Japan 1 4 2 . 8 1.8 Miscellaneous
West Germany 7 4 . 1 2 . 0 Herring0
England 8 5 . 7 2.1 Miscellaneous
Angola 7 2 . 0 7 2 0 Horse mackerel Canada 5 2 . 3 3.1 Sardine, herring Denmark 5 0 . 1 1 0 1 Miscellaneous Soviet Union 4 0 . 9 4 . 8 Miscellaneous South West Africa 4 6 . 3 — Sardinec Iceland 3 9 . 5 2 . 7 Miscellaneous Union of South Africa — — Sardine0
Peru0 2 2 . 5 — Horse mackerel
a0 Rounded figures.
Herring meal is largest in quantity.
c Includes small quantities of pilchard meal.
<* 1 9 5 4 - 1 9 5 6 .
2. W O R L D F I S H E R I E S 67
Β . F I S H O I L S
The amount of oil extracted from fish tissue—so-called body oil—
grew, compared to the period before World War II, from 273,000 metric tons to 343,000 metric tons (i.e., 1 2 1 % ) . This is not as spectacular as the increase in the manufacture of fish meal. Liver oils—particularly im
portant to the pharmaceutical industry—with 76,000 metric tons before the war and 74,000 metric tons in 1957, showed no increase.
The main producer of body oils in this case also is the United States, where 82,800 metric tons of body oil (average 1955-57) were manufac
tured, 8 5 % of which was extracted from menhaden. Compared to the prewar production, this represents an appreciable growth of almost 67,000 metric tons (5.2 times). The total United States production of body oils, however, has declined from 101,000 metric tons in 1938 to an average of 82,800 for 1955-^57.
Noteworthy is the drop in volume in the Japanese body oil industry, i.e., from 57,000 metric tons in 1938 to an average of 25,000 tons for 1955- 57. The present volume is only 4 6 % of the prewar figure. Prior to World War II, this Japanese industry utilized mostly a substantial part of the sardine catch. This catch, however, has declined about 6 5 % , a fact which no doubt has had a direct effect on the body oil production.
The corresponding Norwegian production, on the other hand, shows a considerable increase. In 1938, 26,000 metric tons of body oils were manufactured, as compared to an average of 81,200 metric tons for 1955- 57. This means a rise of 210%. Herring and capelin (Mallotus villosus) serve primarily as raw material. The latter, in fact, constitutes more than 9 5 % of the Norwegian salmonid catch—on the average, 59,200 metric tons (1955-57). The body oil production (in 1,000 metric tons) of some other countries is listed (average figures for 1955-57):
West Germany, 23.3; Canada, 18.3; Denmark, 16.3; Soviet Union, 12.6; Iceland, 10.6; South West Africa, 10.8; Union of South Africa, 9.3;
Angola, 5.3.
The most important producer of liver oil is Norway (20,300 metric tons), followed by England (13,070), Iceland (10,300), Japan (7,700), and West Germany (6,530 metric tons). The figures represent the aver
age for 1955-57. In all European countries the raw material comes, above all, from the Gadidae family, while the Japanese industry to a high degree
( 5 0 % ) utilizes shark livers.
68 D I E T M A R R I E D E L C. M I S C E L L A N E O U S
Mention should be made of a few special technical products made from fish, waste, and scraps from filleting establishments, smoking plants, and other types of processing plants. Caviar is an additional food item.
The production of fish glues in the United States amounted to ap
proximately 8,000 hectoliters annually in 1948. No later figures are avail
able. The Japanese industry annually produces about 3,200 metric tons of raw material for the making of gelatin from fish. The manufacture of agar-agar is of the same order of magnitude (1955-57: 1,700 metric tons).
The production of caviar is almost exclusively a monopoly of the Soviet Union, thanks to the rich yield of sturgeon in the Caspian and its affluents. The yearly production is between 4,000 and 5,000 metric tons (in 1956: 4,600 tons).
IV. Fish Trade
At present, world trade accounts for about one-fourth of the annual catch of fish and other seafood, exclusive of the whale catch. It may be in the form of fresh or processed items for human consumption or of technical products such as meals and oils.
The various continents share in this trade as Table X X X I I I indicates.
TABLE X X X I I I
INTERNATIONAL SEAFOOD TRADE®
Import (1,000 Export (1,000
Country metric tons) % metric tons) %
Europe 1,388 56 1,337 54
North America 526 21 509 21
Asia 314 13 266 11
Africa 116 5 255 10
South America 90 4 76 3
Oceania 23 1 17 1
2,457 TOO 2,460 100
a Source: Food and Agriculture Organization of the United Nations (1952-53).
Year of reference: 1950-53 (average).
Countries exporting and importing fish, and which have some sig
nificance in world trade, are listed in Table XXXIV.
As an example of the international trade in fish and fish products, the situation as regards canned tuna is outlined in Table XXXV.
The major exporters of canned tuna are listed in Table XXXVI.
TABLE XXXIV FISH TRADE IN SELECTED COUNTRIES (1953 FIGURES )A Exporting countries
Trade (1,000 metric tons) Importing Trade (1,000 metric tons) Exporting countries Export Import Net countries Import Export Net Norway 512 33 479 United States 482 109 373 Canada 272 12 260 West Germany 364 30 334 Iceland 164
—
164 United Kingdom 386 65 320 Denmark 172 59 113 France 113 41 72 Netherlands 164 80 84 Soviet Union6 47 1.3 45.7 South West Africa 76 0.04 75.9 Spain 27 21 6 Angola 73 1.5 71.5 Spain Union South Africa 75 15 60 Faeroe Islands 40—
40 Peru 32 0.5 31.5 Portugal 55 25 30 India 31 4 27 Australia 21 12 9 a Source: see Table XXXIII, footnote a. All figures relate to the trade in fresh fish, preserves, technological products, and other articles based on fish. Not included here are the quantities involved in so-called indirect export. 0 Source: United Nations (1953).2. WORLD FISHERIES 69