1
Biometry, shell resistance and attachment of zebra and quagga mussels at the 1
beginning of their co-existence in large European lakes 2
3
Csilla Balogha,b, Zoltán Serfőzőa,b, Abraham bij de Vaatec, Ruurd Noordhuisd, Jarosław 4
Kobake* 5
aCentre for Ecological Research, Balaton Limnological Institute, Hungarian Academy of 6
Sciences, Tihany, Klebelsberg Kuno u. 3., Hungary 7
bMTA Centre for Ecological Research, GINOP Sustainable Ecosystems Group, 8237 Tihany, 8
Klebelsberg Kuno u. 3., Hungary 9
cWaterfauna Hydrobiological Consultancy, Oostrandpark 30, NL‐ 8212 AP Lelystad, The 10
Netherlands 11
dDeltares, P.O. Box 177, 2600 MH Delft, The Netherlands 12
eNicolaus Copernicus University, Faculty of Biology and Environmental Protection, 13
Department of Invertebrate Zoology, 87-100 Toruń, Lwowska 1, Poland, e-mail:
14
jkob73@umk.pl, phone: +48 56 611 2647, fax: +48 56 611 4772 15
*Corresponding author 16
C.B and Z.S. equally contributed to this work 17
18 19
*Manuscript
Click here to view linked References
2 Abstract
20
In invasive dreissenid communities, the zebra mussel usually appears earlier and then is 21
displaced by the quagga mussel. We analysed length-weight allometric relationships, 22
attachment strength (2 days, 1 week and 1 month of exposure), shell crushing resistance and 23
glycogen content across the entire size range of both species in large shallow European lakes 24
where this displacement has recently occurred. In Lake Balaton (Hungary) and Ijsselmeer 25
(The Netherlands), the soft tissue dry weight increment of zebra mussels per unit length 26
decreased after the quagga mussel invasion and became lower than that of quagga mussels. In 27
Lake Markermeer (The Netherlands), having relatively worse environmental conditions, dry 28
weight increment per unit length was always higher in quagga mussels than in zebra mussels, 29
but no negative change in dry weight increment occurred in zebra mussels during the quagga 30
mussel invasion. Small zebra mussels had more resistant shells and stronger attachment than 31
quagga mussels. These differences were reduced (shell hardness) or reversed (long-term 32
attachment) in larger individuals. Zebra mussels had lower glycogen content than quagga 33
mussels across the entire size range. Thus, the quagga mussel advantage over zebra mussel 34
likely consists in the faster dry weight increment per unit length and higher storage product 35
contents of the former, due to its lower investments in attachment strength and shell crushing 36
resistance.
37 38
Keywords: Dreissena polymorpha, Dreissena rostriformis bugensis, allometric relationships, 39
attachment strength, shell resistance, glycogen 40
41
3 Introduction
42
Sessile Ponto-Caspian dreissenids, the zebra (Dreissena polymorpha (Pallas, 1771)) and 43
quagga (Dreissena rostriformis bugensis Andrusov, 1897) mussels share similar habitats and 44
food requirements (Quinn et al. 2013). They are invasive in Europe and North America, 45
causing habitat changes and economic losses (Pimentel et al., 2005; Oreska and Aldridge, 46
2010; Ricciardi and MacIsaac, 2011). While in North America both species appeared within a 47
few years, in Europe (apart from their native area) only the zebra mussel has occurred since 48
the 19th century (Bidwell, 2010) until the recent spread of the quagga mussel in the second 49
half of the 20th century (Van der Velde et al., 2010). Despite the faster spread of the zebra 50
mussel, its populations are usually reduced or displaced within a few years after the 51
appearance of the quagga mussel (Ricciardi and Whoriskey, 2004; Karatayev et al., 2011).
52
This phenomenon also occurs in great lakes of Europe (Orlova et al., 2004; Heiler et al., 2012;
53
Matthews et al., 2014; Balogh et al., 2018) and North America (Patterson et al., 2005), that 54
are commonly being invaded and affected by both species. Nevertheless, a few notable 55
exceptions of the co-existence of the two dreissenids exist (Zhulidov et al., 2010; Strayer and 56
Malcom, 2013).
57
The competitive superiority of the quagga over zebra mussel is an intriguing issue.
58
Morphological (shell thickness), behavioural (attachment, anti-predator responses) and 59
physiological (growth, depending on filtration, respiration and/or thermal tolerance) 60
differences between them have been postulated as feasible explanations (Orlova et al., 2005;
61
Peyer et al., 2009; Naddafi and Rudstam, 2013a, b, D’Hont et al., 2018).
62
Shell and byssus strengths are influenced by the energy budget of mussels (Babarro et al., 63
2008). They affect resistance to hydrodynamic forces and anti-predator defense (Bell and 64
Gosline, 1997; Czarnołęski et al., 2006). The zebra mussel was found to allocate relatively 65
more energy to shell development compared to the quagga mussel (Roe and MacIsaac, 1997;
66
4
Casper and Johnson, 2010). However, these studies compared shallow water zebra mussel 67
populations with deep water quagga mussels, thus including a confounding factor (Roe and 68
MacIsaac, 1997), or focused mainly on large individuals (mean length: 22 mm) (Casper and 69
Johnson, 2010), while the impact of species on length vs. shell strength relationship was not 70
investigated. Zebra mussels also had higher short time (<48 h) attachment strength than 71
quagga mussels (Peyer et al., 2009), whereas no differences between them were found in 2-3- 72
month attachment (Peyer et al., 2009). Furthermore, Grutters et al. (2012) found limited 73
differences in the number of byssal threads produced by the two species. However, these 74
studies only included small individuals (<12 mm) and no changes in attachment with 75
individual size/age have been compared between both species so far. Nevertheless, it seems 76
that zebra mussels allocate more energy to increase shell strength and attachment under 77
predation stress, which, by contrast, may allow the quagga mussel to exhibit relatively faster 78
soft tissue growth, resulting in its competitive advantage in areas of low predation pressure 79
(Naddafi and Rudstam, 2013a, b).
80
The faster growth rate of the quagga mussel (Jarvis et al., 2000; Diggins, 2001;
81
Stoeckmann, 2003; D’Hont et al., 2018; Metz et al., 2018) was attributed to lower energetic 82
expenditure on maintenance (respiration) and higher filtration rate (Baldwin et al., 2002;
83
Stoeckmann, 2003), which however was not confirmed by Kemp and Aldridge (2018).
84
Carbohydrates, particularly glycogen, are prominent energy sources of dreissenids used 85
to maintain physiological state under low food conditions (Palais et al., 2011), hence it is 86
proposed as a condition marker (Bódis et al., 2014), reflecting another potential cause of the 87
quagga mussel dominance in mixed communities. Glycogen level varies seasonally, 88
diminishing from late autumn to spring and reaching its maximum in late summer-early 89
autumn following the temperature and nutrient increase (Sprung, 1995; Palais et al., 2011). To 90
our knowledge, glycogen storage has not yet been compared between the two dreissenids.
91
5
Although many studies concern the topic, the advantage of the quagga over zebra mussel 92
is not clearly known or understood. It is still not known whether any differences between the 93
two dreissenids, which would explain the success of the quagga mussel, are intrinsic species 94
properties, or appear in the response to the competitive pressure from the other species.
95
Therefore, we raise the issue to compare the length-weight allometric relationships, shell 96
crush resistance, attachment strength and energy storage of the two dreissenids along the body 97
length increase over a fine resolution scale. This novel approach led us to deeper insight into 98
the dynamics of development of both species, which can contribute to explaining the ongoing 99
displacement of the zebra by quagga mussel.
100
We studied all three large lakes in central and western Europe, which have been invaded 101
by the quagga mussel and still had viable zebra mussel populations during the study course:
102
Lakes Markermeer and IJsselmeer in The Netherlands, as well as Lake Balaton in Hungary 103
(Bij de Vaate et al., 2013; Balogh et al., 2018). Traits of co-existing mussel populations were 104
compared with corresponding historical data obtained before the quagga mussel invasion. We 105
applied a unified sampling strategy and biomass calculation in all the lakes because the lack 106
of this is still the obstacle to making a comprehensive picture of the properties of dreissenid 107
invasion (Strayer et al., 2019).
108
Our hypothesis was that the zebra mussel would exhibit lower increment of soft tissue 109
weight per unit length compared to the quagga mussel, irrespective of the competitor presence 110
(suggesting the general superiority of the latter species), or, alternatively, this parameter 111
would decrease in the presence of the new competitor (suggesting a negative impact of the 112
newcomer). Moreover, we hypothesized that the zebra mussel would attach more strongly to 113
the substratum, develop a shell more resistant to crushing and contain lower amount of 114
glycogen, which could explain its slower increment of the soft tissue weight. Finally, we 115
expected that these differences between species could be size (i.e. age) and time dependent.
116
6 117
Material and Methods 118
Sampling sites and the history of dreissenid introductions 119
Lake IJsselmeer and Lake Markermeer (The Netherlands) are parts of a former estuarine bay, 120
called Zuiderzee, dammed in 1932 and turned into a freshwater lake called Lake IJsselmeer 121
(Fig. 1). Wide parts of this lake were turned into land and the remaining part was separated 122
into two large water bodies, northern Lake IJsselmeer and southern Lake Markermeer, by 123
another dam in 1975 (De Jong and Bij de Vaate, 1989).
124
During the study period (2008-12), water quality surveys in both lakes took place with a 125
four week interval as part of a national monitoring program conduted by the Dutch Ministry 126
of Infrastructure and the Environment (Table S1). Transparency was measured as Secchi disk 127
depth and water samples were taken with a pump at 1 m below the surface to analyse 128
concentrations of total suspended matter, chlorophyll-a (by spectrophotometry) and total 129
phosphorus (by Continuous Flow Analysis) according to Noordhuis (2007).
130
Lake IJsselmeer has mainly sandy sediments, and the concentration of suspended solids 131
varies considerably between the southern and central part (Table S1). The lake was 132
eutrophicated until the 1980s, but phosphorus concentration dropped substantially in the 133
second half of the 1980s (Noordhuis, 2007). Lake Markermeer has clay sediments that erode 134
into silt-sized particles, resulting in higher concentrations of suspended matter when 135
compared to Lake IJsselmeer (Table S1). Suspended silt interacts with phytoplankton, 136
resulting in relatively poor food conditions for dreissenids (Penning et al., 2013; De Lucas 137
Pardo et al., 2015). Nevertheless, average concentration of seston in the lake also depends on 138
the location (Table S1) and season (Fig. S1) and has been relatively low during our study. The 139
biggest difference in the concentration of suspended solids between both lakes was observed 140
in spring, while it disappeared in late summer and early autumn (Fig. S1). Since 1990, trophic 141
7
level in both lakes has been similar and slowly decreased. In 2011-12, they approached 142
mesotrophic conditions (R. Noordhuis, unpublished data).
143
Zebra mussel colonisation of Lake IJsselmeer started soon after it was separated from the 144
sea (Van Benthem Jutting, 1954). In 2006, the quagga mussel was first observed in the 145
Netherlands (Molloy et al. 2007), and soon thereafter it appeared in Lakes IJsselmeer (2007) 146
and Markermeer (2008) (Bij de Vaate and Jansen, 2009; Matthews et al., 2014).
147
Lake Balaton (Fig. 1) has soft bottom sediments (Lóczy, 1894; Miller and Wagner, 148
1978). Its shoreline has large expanses of reeds, is reinforced with rip-rap and includes 149
numerous piers and harbours, providing suitable substrata for dreissenid colonization.
150
Environmental data (Table S1) for Lake Balaton (Hungary) were monitored according to 151
Somogyi et al. (2017). Seston in Lake Balaton consists mainly from resuspended fine mineral 152
particles (0.2–10 μm) and biogenic lime. The organic content in the suspended matter is very 153
low (<4%) (Entz and Sebestyén, 1942; Entz, 1981; Máté, 1987). A trophic gradient exists 154
from the eutrophic western part to the oligo-mesotrophic eastern basin (Istvánovics et al., 155
2007; Tátrai et al., 2008). Temperature in Lake Balaton, particularly in summer, was clearly 156
higher than in the Dutch lakes (Table S1).
157
In 1932, the zebra mussel was introduced into Lake Balaton from the Danube River, 158
possibly via ship transport (Sebestyén, 1938). Ca. 75 years later, the quagga mussel was 159
detected in the lake (Majoros, 2009; Balogh and G.-Tóth, 2009). It was most probably 160
imported through the same route as the zebra mussel, as it was earlier observed in the 161
Hungarian part of the Danube River (Szekeres et al., 2008).
162 163
Sampling and preliminary processing of mussels 164
We colected mussels from the sandy or clay lake bottom with a trawl net (depth 3 m) or cut 165
from the rip-rap (depth 0.5 m) at 6 sites in Lake IJsselmeer and 4 sites in Lake Markermeer 166
8
(Fig. 1). There were no differences in species distribution or biometric traits (volume x length 167
relationship) between these substratum types (A. bij de Vaate, personal information), so all 168
mussels were pooled for further analyses. Sampling took place between 2008-12, from 169
January/March until October/December each year, except in 2012 when sampling took place 170
from January until June. In Lake Balaton, we collected mussels from the western part of the 171
lake, where both species still co-exist. We sampled mussels from the rip-rap (depth: 1.2-1.5 172
m) in July 2005 (before the quagga mussel appearance) and, together with quagga mussels, in 173
August 2015 (Fig. 1). After sampling, we transported mussels to the laboratory, cleaned them 174
of epibionts, contaminants and mud, and identified to the species level.
175
In selected years, we have determined the biovolume of mussels (the volume of fouling 176
bivalves per unit area) to indicate the load of the fouling community (Smit and Dudok van 177
Heel, 1992). Briefly, biovolume was calculated from the measured density (ind. per unit area) 178
and population size structure using an empirical body volume vs. length relationship equation.
179
To determine this relationship, body volume was measured as an equivalent of the water 180
volume displaced by an animal. The mussel biovolume combines mussel size and density, 181
showing the level of their crowding on the substratum per unit bottom area. We also 182
calculated the percentage shares of both dreissenid species in the community.
183 184
Soft tissue dry weight measurement 185
We measured mussel lengths and soft tissue weights to determine the rate of their soft tissue 186
growth per unit length depending on species, location and time. We assumed that in within- 187
species comparisons (zebra mussels before and after the competitor invasion or each species 188
between the years), higher soft tissue weight increments would indicate a better condition (the 189
ability to develop higher biomass), whereas in between-species comparisons (between two co- 190
existing dreissenids) may also point to a different allocation of available resources.
191
9
We measured mussel length to the nearest 1 mm with a calliper (Lake Balaton) or ruler 192
(Dutch lakes). Soft tissue was removed from 10-40 animals per size class (size classes every 1 193
mm for a range of 7-26 mm) after boiling them for 1-2 min in a microwave at 800 W (A. bij 194
de Vaate, personal information). Then the soft tissue was dried for 24 h at 80 ºC and weighed 195
yielding the average soft tissue dry weight (DW). The average soft tissue ash free dry weight 196
(AFDW) was obtained after incineration during 4 h at 450 ºC. These average values per each 197
size class were used as data points in further analyses following the protocol by Bij de Vaate 198
(1991).
199 200
Attachment and shell strength measurement 201
Mussel attachment and shell strength allow for the assessment of resistance to environmental 202
dangers (predators, hydrodynamics) (Czarnołęski et al., 2006; Naddafi and Rudstam, 2013a).
203
We collected mussels from the rip-rap of Lake Balaton in August 2015. After a 2-week 204
acclimation period under laboratory conditions, we placed animals onto circular 205
polypropylene (pp) plates (diameter 85 mm, thickness 5 mm) with a raised edge (6 mm), 15 206
mixed sized individuals per plate. The plates were covered with plastic 1-mm mesh to prevent 207
animal loss and placed (each species separately) in aerated 200-L tanks (4 plates per tank, 6 208
tanks per each species and each of the 3 exposure times – see below). Each tank was 209
independently connected to Lake Balaton with a flow-through system (flow rate: 62 L/h), so 210
the water quality experienced by the exposed mussels were the same as outdoors. We 211
randomized the positions of the experimental tanks with both species within the laboratory 212
room to reduce the effect of unknown external stimuli. The conditions during the acclimation 213
and experiment (equal in all experimental tanks) were as follows: temperature: 20-24°C;
214
suspended material: 1.5-3 mg/L; chlorophyll-a: 1.5-3 μg/L. The tanks were uniformly 215
illuminated with natural light coming through the window of the laboratory room, at natural 216
10
photoperiod (14L:10D). After two days, when the animals had attached to the plastic surface, 217
the mesh was removed. We measured the attachment strength of mussels after two days (i.e.
218
immediately after removing the mesh), one week and one month of exposure (different 6 219
tanks on each term). Only individuals found attached to the substratum were analysed.
220
We measured byssal attachment and shell strength of mussels with a digital force gauge 221
FH 50 (Sauter GmbH, Balingen, Germany). The device was connected with forceps to the 222
mussel and pulled gently perpendicularly to the plate until it was detached from the 223
substratum. This approach simulates an attack of a predator attempting to detach its prey from 224
the substratum. Then, we measured the length of the detached mussel, opened its shell and 225
broke both valves with the force gauge to record the force needed to crush them. The shell 226
strength of each individual was expressed as the mean of both valves.
227 228
Glycogen content measurement 229
Mussels were collected from the rip-rap of Lake Balaton in August 2018. We selected 3 230
individuals of each species per each 1-mm size class (across the range of 6-23 mm). They 231
were fast dried on filter paper, frozen and kept in plastic boxes at -80 °C until use. Their soft 232
tissues were pulled out from the melted samples and hand-homogenized them in microtest 233
tubes with plastic pestles.
234
We measured glycogen (total carbohydrate) content according to Van Handel (1965), 235
adapted to mussels by De Zwaan and Zande (1972). We added a mixture containing 1 mL 236
96% ethanol, 200 µL distilled water and 20 µL saturated Na2SO4 to 40 µL of each sample and 237
heated it at 95 °C for 4 min in a block thermostat. Then the sample was cooled down in a 238
fridge at 4 °C and centrifuged at 2000 g for 20 min. The pellet was dried at 95 °C and filled 239
up to 50 µL with distilled water. To prepare the calibration line, we diluted 20 mg/mL glucose 240
(used as a standard) stock in a 5-14-fold range having 10 different concentrations of the 241
11
solution. Within this range, the reaction was linear with the glucose concentration. We 242
incubated the standards and samples with 1 mL of anthrone reagent (0.15% anthrone [Alfa 243
Caesar, Kalsruhe, Germany] solution in 76% sulfuric acid) at 90°C for 20 min. The samples 244
were kept on ice for 15 min to stabilize the colour of the reaction and measured within 10 min 245
at 620 nm in a Hitachi U-2900 spectrophotometer (Hitachi Ltd, Tokyo, Japan). Glycogen 246
content was expressed as a glucose equivalent in mg glucose/g soft tissue wet weight ratio.
247 248
Data analysis 249
The relationship between mussel size and weight is described by the allometric equation:
250
W = a Lb where W – mussel weight (dry weight (DW) or ash free dry weight (AFDW), L – 251
mussel length, a, b – constants). We linearized this equation by log-transforming all length 252
and weight measurements for further analyses. The higher value of the allometric coefficient 253
b indicates the higher increment of soft tissue weight per unit length. Thus, we assumed the 254
higher allometric coefficient to be associated with the greater relative investment of energetic 255
resources into soft tissues during the animal growth.
256
To analyse length-weight relationships of mussels in Lakes IJsselmeer and Markermeer, 257
we pooled samples from each year to avoid random month to month fluctuations and focus on 258
interannual differences depending on changing shares of dreissenids in the community. We 259
tested mussel DW and AFDW with a General Linear Model (GLM) with (1) Lake, (2) 260
Species and (3) Sampling Year as fixed categorical factors and (4) Mussel Length as a 261
continuous independent variable. All main effects and interactions between Species and other 262
variables were included in the model.
263
To analyse length-weight relationships of mussels in Lake Balaton (DW and AFDW) we 264
used a GLM with (1) Species/Year as a fixed categorical factor with three levels: (i) quagga 265
mussels sampled in 2015, (ii) zebra mussels co-occurring with quagga mussels in 2015 and 266
12
(iii) zebra mussels sampled in 2005, before the quagga mussel appearance and (2) Mussel 267
Length as a continuous independent variable.
268
Attachment strength and shell strength were log-transformed before the analyses, as they 269
are also likely to depend on dimensions (attachment on the number and diameter of byssal 270
threads and shell strength on its thickness). To check factors affecting mussel attachment, we 271
applied a GLM with (1) Species and (2) Exposure Time (2 days, 1 week, 1 month) as fixed 272
categorical factors, (3) Tank as a random factor nested within Species (included to avoid 273
pseudoreplications, as each tank contained a group of mussels) as well as (4) Mussel Length 274
(log-transformed) and (5) Shell Strength as continuous independent variables. Mussel length 275
was included in the model to control for its influence on attachment strength (Kobak 2006) 276
and check its potential effect on interspecific differences in attachment. We assumed that 277
attachment strength can vary within a short timeframe, depending on current conditions 278
(Kobak, 2006), whereas shell strength is a lifetime parameter, reflecting the entire life of an 279
animal. Therefore, it was possible that shell strength would shape attachment, e.g. by 280
reflecting animal condition or its past experiences with predation pressure (Czarnołęski et al.
281
2006). All main effects, the interaction between the fixed factors as well as interactions 282
involving Species and the continuous variables were included in the model.
283
To check factors affecting mussel shell strength, we applied a GLM with (1) Species as a 284
fixed categorical factor, (2) Tank as a random factor nested within Species and (3) Mussel 285
Length (log-transformed) as a continuous independent variable. All exposure times were 286
pooled for this analysis as it was unlikely that such a short timeframe would affect the 287
strength of a shell developed throughout a mussel life. All main effects and an interaction 288
between the fixed factor and continuous variable were included in the model.
289
To analyse differences in glycogen content (log-transformed), we used a GLM with (1) 290
Species as a fixed factor and (2) Mussel Size as a continuous independent variable.
291
13
For significant interactions of continuous variables with categorical factors, we compared 292
the regression slopes for particular levels of grouping variables with one another according to 293
Sokal and Rohlf (1995). If two slopes did not differ from each other (indicating parallel 294
regression lines), we checked whether the lines differed in their vertical position using 295
ANCOVAs. The results of these post-hoc comparisons were sequential-Bonferroni corrected 296
to control for Type I error inflation. Calculations were carried out with SPSS 22.0 (IBM inc.).
297 298
Results 299
Length-weight relationship 300
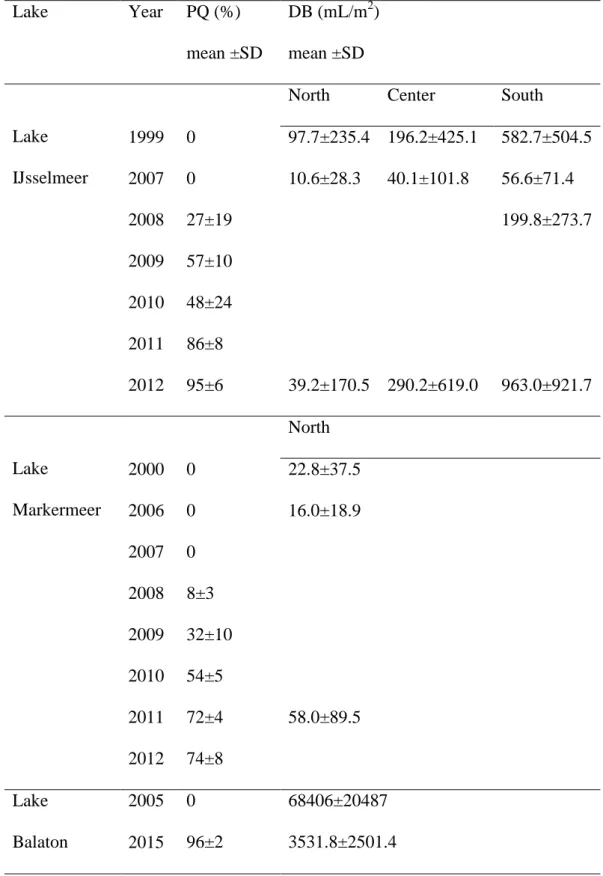
During the study period, a shift from the zebra to quagga mussel dominance occurred in all 301
the lakes (Table 1). The biovolumes observed in Lake Balaton were much higher than in 302
Lakes IJsselmeer and Markermeer. Moreover, a considerable increase in mussel biovolume 303
was observed in Lake IJsselmeer, following the collapse that had occurred between 1999 and 304
2007 (Table 1).
305
The GLMs have shown significant Lake x Year x Species x Length interactions for both 306
DW (F2, 200 = 3.73, P = 0.026) and AFDW (F2, 200 = 7.21, P = 0.001, see Table S2 for detailed 307
results) of the Dutch lake populations. Thus, both species grew differently in both lakes and 308
their length-weight relationships changed with time.
309
In Lake IJsselmeer, the weight increment per unit length of zebra mussels were greater 310
than that of quagga mussels in 2008 and 2009, whereas this tendency was reversed in 2010 311
and 2011 (Fig. 2, Fig. S2). The highest weight increments per unit length were observed in 312
2008-9 for zebra mussels and 2010 for quagga mussels (Table S3). The body weight of both 313
species gradually decreased in consecutive years, as shown by significant differences in 314
vertical position among lines with the same slopes (Table S3).
315
In Lake Markermeer, the weight increment per unit length was higher in quagga than in 316
14
zebra mussels in 2009 (only AFDW), 2010 and 2012. In the other cases (year 2011 and DW 317
in 2009), body weight of quagga mussels was uniformly greater than that of zebra mussels 318
across the entire size range (Fig. 2, Fig. S2). Body weight of both species increased from 2009 319
till 2011, with no differences in allometric coefficients (i.e. slopes) between the consecutive 320
years (Table S3).
321
Significant Species x Length interactions in the GLMs (DW: F2, 47 = 7.59, P = 0.001, 322
AFDW: F2, 47 = 3.81, P = 0.029, see Table S4 for detailed results) indicated that length-weight 323
relationships differed between both species in Lake Balaton. DW and AFDW of quagga 324
mussels increased faster per unit length compared to zebra mussels (Fig. 3, Fig. S3). The DW 325
increment of zebra mussels co-occurring with quagga mussels (in 2015) was lower than that 326
exhibited by this species before the appearance of quagga mussels (in 2005). AFDW of zebra 327
mussels co-occurring with quagga mussels was constantly lower than in 2005 across the entire 328
size range. It should be noted that large (length >15 mm) zebra mussels were very rare in the 329
2015 samples, despite collecting thousands of animals.
330 331
Attachment strength 332
Mussel attachment was affected by species, exposure time and mussel length, as shown by a 333
significant interaction between these factors in the GLM (F2, 1206 = 8.26, P < 0.001, see Table 334
S5 for detailed results). After 2 days, zebra mussels were more strongly attached than quagga 335
mussels irrespective of their length (Fig. 4A), which resulted in a significant difference in 336
vertical position between the parallel regression lines for both species (t606 = 3.28, P = 0.001).
337
After 1 week, the attachment of both species did not differ from each other (Fig. 4B). After 1 338
month, a significant difference appeared between the regression slopes for both species (t212 = 339
4.08, P < 0.001). The increment of attachment strength per unit length was greater in quagga 340
than in zebra mussels. In consequence, small zebra mussels were more strongly attached than 341
15
small quagga mussels, whereas the opposite was true for the largest individuals (Fig. 4C).
342
The shell strength appeared to correlate positively (as shown by the positive value of the 343
estimated parameter B = 0.074 ±0.058 SE for the shell strength effect) with attachment 344
strength, though this relationship was rather weak (shell strength main effect: F1, 1206 = 4.48, P 345
= 0.034).
346 347
Shell strength 348
Zebra mussels had harder shells than quagga mussels (Fig. 5), though this difference 349
decreased with size, as shown by a significant Species x Length interaction in the GLM (F1, 350
1216 = 8.40, P = 0.004, see Table S6 for detailed results). Thus, the increment of shell strength 351
per unit length was greater in quagga mussels than in zebra mussels.
352 353
Glycogen content 354
A significant Species effect in the GLM (F1, 89 = 12.32, P = 0.001, see Table S7 for detailed 355
results) reflected the higher glycogen content in quagga mussels (Fig. 6) across the entire size 356
range studied (as the length effect was non-significant: F1, 89 = 2.94, P = 0.090).
357 358
Discussion 359
Soft tissue increment per unit length is faster in quagga than zebra mussels 360
We observed a gradual replacement of zebra by quagga mussels in all three lakes studied. A 361
similar process took place within 4-13 years in most of the European and North American 362
freshwater bodies in which they co-occur (Mills et al., 1996; Orlova et al., 2004; Ricciardi and 363
Whoriskey, 2004; Patterson et al., 2005; Dermott and Dow, 2008; Nalepa et al., 2010;
364
Zhulidov et al., 2010; Bij de Vaate et al., 2013; Heiler et al., 2012; Matthews et al., 2014).
365
Comparison of our data obtained at various stages of the quagga mussel invasion allowed us 366
16
to get insight into the process of the species displacement. Notable intra- and interspecies 367
differences in soft tissue weight increment per unit length were observed during the process of 368
invasion.
369
Higher soft tissue weight increment per unit length may have two causes: (1) higher 370
energetic allocation into soft tissue growth or (2) different proportions in linear growth in the 371
two species (i.e. the heavier species might increase more in width and/or height than the other, 372
having the same length increment). Beggel et al. (2015) and Kerembrun et al. (2018) provided 373
data on zebra and quagga mussel shell proportions, showing that quagga mussels have 374
narrower and taller shells than zebra mussels of the same length. Nevertheless, detailed 375
calculations based on the numerical data by Kerembrun et al. (2018) indicate that the overall 376
shell volume of a quagga mussel is smaller (though only slightly) than that of a zebra mussel 377
of the same length. Thus, we can argue that the heavier soft tissue mass of the quagga mussel 378
must be attributed to its higher content in the shell volume rather than to the larger shell 379
volume per unit length. The higher amount of soft tissue may allow faster maturation, more 380
efficient reproduction (gonad mass and gamete production), feeding (gill size), movement 381
(muscle mass) and/or accumulation of storage materials. Thus, the high soft tissue amount and 382
its fast increment per unit length is likely to be beneficial for a mussel (Metz et al., 2018).
383
At the beginning of the quagga mussel invasion in Lake IJsselmeer (years 2008-9), zebra 384
mussels had higher weight increments than after the establishment of the newcomer (2010- 385
11). In Lake Balaton, we also observed a reduction in zebra mussel soft tissue increment per 386
unit length after the appearance of the quagga mussel and the higher value of this parameter 387
exhibited by the latter species. This suggests that either (1) quagga mussels negatively 388
affected zebra mussels (so individuals of the same length had less soft tissue), or (2) some 389
external factors negatively affected zebra mussels, whereas quagga mussels remained less 390
influenced. The body weight of all size classes of both species in Lake IJsselmeer tended to 391
17
decrease with time. Perhaps, it could follow from the increasing overall dreissenid biovolume 392
during the study period in this lake (Table 1) and/or from the resulting considerable decrease 393
in chlorophyll-a concentration observed in the southern part of the lake (Table S1).
394
In Lake Markermeer, quagga mussels had higher body weight and/or its increment rate 395
per unit length than zebra mussels from the beginning of their appearance. In this lake, 396
intrinsic differences between both species, rather than a relationship between them, seemed to 397
be responsible for the advantage of the former. The hypothesis of the intrinsic difference 398
between the species being related to the displacement in this lake is supported by (1) the fact 399
that the displacement took place despite the absence of a negative change in the zebra mussel 400
length-weight relationship after the appearance of its competitor, (2) the relatively constant 401
advantage of quagga over zebra mussels from the beginning of the invasion of the former, and 402
(3) the improvement of the relative soft tissue weight of zebra mussels in 2010-11, despite the 403
increasing quagga mussel population. In addition, the relatively low densities and small size 404
of the mussels of both species in this lake suggest other limitation parameters than 405
intraspecific competition. These are probably related to high silt content of suspended matter 406
and flocculation of algae with silt particles (De Lucas Pardo et al., 2015). The absence of a 407
reduction in the zebra mussel body weight increment after the appearance of its congener in 408
Lake Markermeer might also result from the generally lower increments observed in this lake, 409
which could prevent detection of any further decrease in this parameter. The quagga mussel 410
has been found to have generally larger body weight/shell ratio than zebra mussel (Mills et al., 411
1996; Jarvis et al., 2000; Diggins, 2001; Stoeckmann, 2003; Karatayev et al., 2010), which, 412
similarly to the results of our study, indicates its higher investment into soft tissue growth.
413
The different pattern of dreissenid length-weight relationships in Lake Markermeer may 414
result from the high concentration of suspended particles (Vijverberg et al., 2011) particularly 415
in spring (Fig. S1, Table S1), which negatively affects the living conditions and growth of 416
18
dreissenids (Mandemakers, 2013; Penning et al., 2013). The superiority of the quagga mussel 417
in such a turbid lake may result from their higher resistance to such conditions. The faster 418
growth rate of the quagga mussel compared to its congener was reported under stressful 419
conditions (low food quantity and quality) in the field (Karatayev et al., 1998; Baldwin et al.
420
2002; Stoeckmann, 2003; Orlova et al., 2005) and experimental studies (Stoeckmann and 421
Garton, 2001; Baldwin et al., 2002). It was attributed to lower metabolic rate and faster 422
filtration (Baldwin et al., 2002; Stoeckmann, 2003), advantageous mainly in suboptimal 423
conditions (Karatayev et al., 1998; Madon et al., 1998; Stoeckmann and Garton 2001;
424
Baldwin et al., 2002; Stoeckmann, 2003; Orlova et al., 2005). On the other hand, in the 425
southern part of Lake IJsselmeer, the amount of suspended particles was moderate (Table S1) 426
and the largest dreissenid community existed (Table 1). The more sandy sediments in this lake 427
in comparison to Lake Markermeer may result in the higher food quality of the suspended 428
matter. Also, this part of the lake is closest to the mouth of the River IJssel, which supplies 429
most of the nutrients to Lake IJsselmeer. Nevertheless, a study involving a greater number of 430
lakes differing in turbidity is needed to confirm the importance of this factor.
431
To summarize, in the view of all the lakes studied here, the displacement of the zebra 432
mussel takes place irrespective of whether they respond to the appearance of the quagga 433
mussel with changes in soft tissue growth parameters or not. Therefore, other parameters are 434
likely to lead to the superiority of quagga mussels. These can include generally faster soft 435
tissue weight increment per unit length under poor environmental conditions, shown in our 436
study. Quagga mussels were showed to grow faster and therefore exhibit higher fitness than 437
zebra mussels under a range of densities of both coexisting species (Metz et al., 2018).
438
Moreover, the quagga mussel better tolerates low temperature and food concentration 439
(Karatayev et al., 1998; Baldwin et al., 2002; Stoeckmann, 2003; Orlova et al., 2005). Thus, it 440
can reproduce at lower temperatures (4-9 °C, Roe and MacIsaac, 1997; Thorp et al., 1998;
441
19
Claxton and Mackie, 1998; Stoeckmann, 2003; Nalepa et al., 2010) and therefore colonize 442
substrata earlier in spring (Balogh et al., 2018). On the other hand, according to D’Hont et al.
443
(2018), quagga mussels may be able to dominate the dreissenid community even when they 444
settle later in spring than zebra mussels. Furthermore, the quagga mussel survives at a lower 445
oxygen concentration (Karatayev et al., 1998).
446 447
Attachment strength and shell resistance are greater in zebra than in quagga mussels 448
The 2-day attachment of zebra mussels was significantly stronger than that of quagga 449
mussels. This supports the short-term results of Peyer et al. (2009) and shows that the zebra 450
mussel invests more energy into initial adhesion. This strategy allows it to gain faster 451
protection against environmental dangers, such as predators or hydrodynamics. Moreover, the 452
youngest zebra mussels invested more energy into their shell hardness and long-term 453
attachment than quagga mussels. Roe and MacIsaac (1997) and Casper and Johnson (2010) 454
also reported zebra mussels to allocate relatively more energy to shell than to soft tissue 455
growth compared to the quagga mussel. However, in our study, larger quagga mussels made 456
up for this difference and approached (shell strength) or exceeded (attachment) the values 457
measured for large zebra mussels. The long-term attachment strength of quagga mussels 458
surpassed that of zebra mussels at the size of ca. 12-13 mm (Fig. 4C). In contrast, Peyer et al.
459
(2009) showed no difference in long-term (2-3 months) attachment strength between the 460
species. Also, Grutters et al. (2012), comparing byssal production at different temperatures, 461
found the advantage of zebra mussels only at 25 °C. The difference between these results and 462
our study could be due to the fact that we tested the whole size range of mussels, up to 24 mm 463
in length. We showed that neither species can be actually considered as having stronger long- 464
term attachment. Instead, quagga mussels exhibit faster increment of attachment per unit 465
length (though starting from a lower initial value for the smallest individuals), resulting in the 466
20
stronger adhesion of the largest specimens. It should be noted that byssogenesis is influenced 467
by multiple environmental cues: temperature, salinity, dissolved oxygen, light, 468
hydrodynamics, adhesion surface and season (Rajagopal et al. 1996, 2005, 2006; Clarke and 469
McMahon, 1996; Kobak, 2001; 2006; Peyer et al., 2009), which can also modify the results.
470
Stronger attachment and more resistant shell can protect mussels from predation (Naddafi 471
and Rudstam, 2013a). Anti-predator defences involving stronger attachment (Côté 1995;
472
Reimer and Tedengren, 1996; Dolmer, 1998; Nagarajan et al., 2006) and thicker shells have 473
also been described for marine mussels (Leonard et al., 1999; Smith and Jennings, 2000;
474
Freeman and Byers, 2006). However, only specifically adapted fish (e.g. cyprinids), birds and 475
large invertebrates (crayfish, crabs) are capable of consuming dreissenids (Molloy et al., 476
1997). Fish and bird predation affects the dreissenid population in Lake Balaton (Ponyi, 1994;
477
Specziár et al., 1997; Balogh et al., 2008). In Lake IJsselmeer, predation pressure by ducks on 478
zebra mussels as well as impact on densities used to be relatively high during the 1980s and 479
early 1990s (van Eerden et al., 1997), when availability of alternative prey was low. Their 480
stomach contents contained as much as 95% zebra mussels in winter (de Leeuw and van 481
Eerden, 1995). In more recent years, abundance of aquatic macrophytes has increased, and 482
stomachs of ducks contained less mussels and more gastropods and amphipods (Van Rijn et 483
al., 2012). Proportions of both dreissenid species in the stomachs were roughly similar to their 484
proportions in the mussel community on the lake bottom at that time.
485
Fish and bird predation concerns mainly small and medium sized (8–17 mm) dreissenids 486
(Czarnołęski et al. 2006). De Leeuw and van Eerden (1992) showed that tufted ducks Aythya 487
fuligula fed on smaller zebra mussels in Lake IJsselmeer using a suction technique, which was 488
more profitable than picking up larger mussels individually. Thus, large mussels are relatively 489
less susceptible to predation compared to small individuals. Our results indicate that small 490
zebra mussels seem better protected against predation than quagga mussels of the same size.
491
21
Moreover, Naddafi and Rudstam (2013a, b) found stronger responses (increase in shell 492
thickness and attachment strength) of zebra mussels to the presence of predators compared to 493
quagga mussels. Nevertheless, despite of their apparently better anti-predation protection, 494
zebra mussels are still being displaced by their congeners. Naddafi and Rudstam (2013a, b) 495
suggested that different energy partitioning by the two dreissenid species into growth and 496
anti-predation defences might explain the competitive advantage of the quagga mussel. By 497
decreasing the allocation of energy into attachment and shell building, quagga mussels are 498
able to invest more resources into growth and/or reproduction, resulting in faster growth and 499
greater soft tissue weight increments per unit length, also shown in our results. This may be 500
advantageous for an animal which, due to its hard shell and gregarious occurrence, is likely to 501
be exposed to generally lower predation risk compared to soft zoobenthos.
502
The stronger attachment of zebra mussels can be advantageous in areas exposed to 503
variable physical conditions, e.g. water currents and waves (e.g. upper littoral). Zebra mussels 504
are commonly observed in such locations, e.g. at a shallow depth (Karatayev et al., 2013) or 505
on shells of actively moving unionid mussels (Bódis et al., 2014). Conversely, quagga 506
mussels are more often found at higher depths and/or on muddy bottoms with more stable 507
conditions (Mills et al., 1996; Coakley et al., 1997; Berkman et al., 1998, 2000; Peyer et al., 508
2011). On the other hand, no differences in the distribution of both species were observed in 509
Lakes IJsselmeer and Markermeer (A. bij de Vaate, personal observation).
510
The strong attachment and resistant shell also makes the zebra mussel more durable than 511
the quagga mussel during transport with vessels and sailing equipment that might have 512
resulted in its higher spread rate at the initial invasion stage, particularly over long distances 513
and between water bodies (Karatayev et al., 2011; Collas et al., 2016). Further, this durability 514
likely delays displacement of the zebra by quagga mussel and allows for the co-existence of 515
the two species at some places (Patterson et al. 2005; Watkins et al. 2007; Nalepa et al. 2010).
516
22
Habitat partitioning was also found in some co-existing intertidal marine mussels (Harger, 517
1970; Witman and Suchanek, 1984; Gardner and Skibinski, 1991; Willis and Skibinski, 518
1992). Among them, marine counterparts of dreissenids, Mytillus trossulus and M.
519
californianus, have different attachment strength, which is associated with their location on 520
wave-exposed shores (Witman and Suchanek, 1984; Bell and Gosline, 1997).
521 522
Quagga mussels accumulate more energy storage products than zebra mussels 523
We showed that zebra mussels had significantly lower level of glycogen than quagga mussels.
524
Lower glycogen content may reflect unfavorable conditions inhibiting production of storage 525
materials by zebra mussels and/or exhausting these resources. Quagga mussels under the same 526
conditions seem capable of keeping higher levels of storage materials and thus sustaining 527
better physiological condition. This corresponds to the reduction in the abundance of zebra 528
mussels during the initial stage of the quagga mussel invasion in Lake Balaton (Balogh et al., 529
2018). Lower glycogen content could reduce reproduction, and hence provide an advantage 530
for the quagga mussel to displace the zebra mussel from the common habitat. Moreover, the 531
difference in glycogen content between the species accounts for our earlier finding of the 532
higher soft tissue weight increment per unit length observed in quagga mussels, supporting 533
the hypothesis that this species accumulates its soft tissue weight faster than its congener.
534 535
Summary and conclusions 536
Zebra mussels in our study had generally lower weight increment per unit length, lower 537
glycogen content, more resistant shells and higher initial attachment strength than quagga 538
mussels. Moreover, small zebra mussels exhibited stronger long-term adhesion than quagga 539
mussels. The displacement of zebra by quagga mussels occurred in all the lakes, irrespective 540
of whether a negative change in the weight increment per unit length of the zebra mussel 541
23
appeared in the presence of its congener or not. Thus, the displacement between the 542
dreissenids is likely to depend on some intrinsic differences between the species, including 543
lower energetic investment of the quagga mussel into processes other than growth and 544
reproduction (i.e. attachment and shell strength), its higher content of storage products and/or 545
higher resistance to negative environmental factors. Nevertheless, its negative impact on the 546
zebra mussel also cannot be excluded, at least occasionally. The differences between the 547
species act mainly at early stages of mussel life, when intra- and interspecific competition for 548
space and food is most important due to common detachment events and searching for 549
suitable sites (Kobak et al., 2009). The faster growth at this stage, enabled due to weaker 550
development of anti-predation structures, may promote the competitive success of the quagga 551
mussel over its congener. Older quagga mussels offset their initial lower attachment strength 552
and shell resistance with faster growth, suggesting that after establishing permanent 553
attachment sites they start to allocate more energy into these processes as well.
554 555
Acknowledgements 556
Mrs. Ildikó Starkné Mecsnóbel, Ms Brigitta Baranyai, Ms. Judit Tóth, Éva Koltai and Balázs 557
Kutasi provided excellent technical assistance in experimental work. We are indebted to 558
Balázs Németh for generous share of the TSM data of Lake Balaton. The study was 559
financially supported by the GINOP-2.3.2-15-2016-00019, the MAHOP-2.1.1.-2016-2017- 560
00005.
561 562
References 563
Baldwin, B.S., Mayer, M.S., Dayton, J., 2002. Comparative growth and feeding in zebra and 564
quagga mussels (Dreissena polymorpha and Dreissena bugensis). Implications for North 565
American lakes. Can. J. Fish. Aquat. Sci. 59, 680–694.
566
24
Balogh, C., G-Tóth, L., 2009. A Balaton bevonatlakó gerinctelen állatvilágának vizsgálata a 567
2008. évben. In: Bíró, P., Banczerowsky, J.A. (Eds.), Balaton kutatásának 2008. évi 568
eredményei. MTA, Budapest, pp. 45-53.
569
Balogh, C., Muskó, I.B., G-Tóth, L., Nagy, L., 2008. Quantitative trends of zebra mussels in 570
Lake Balaton (Hungary) in 2003-2005 at different water levels. Hydrobiol. 613, 57-69.
571
Balogh, C., Vláčilová, A., G.‐Tóth, L., Serfőző, Z., 2018. Dreissenid colonization during the 572
initial invasion of the quagga mussel in the largest Central European shallow lake, Lake 573
Balaton, Hungary. J. Great Lakes Res. 44, 114–125.
574
Babarro, J.M.F., Reiriz, M.J.F., Labarta, U., 2008. Secretion of byssal threads and attachment 575
strength of Mytilus galloprovincialis: the influence of size and food availability. J. Mar.
576
Biol. Assoc. UK 88, 783-791 577
Beggel, S., Cerwenka, A.F., Brandner, J., Geist J., 2015. Shell morphological versus genetic 578
identification of quagga mussel (Dreissena bugensis) and zebra mussel (Dreissena 579
polymorpha). Aquat. Inv. 10, 93-99.
580
Bell, E.C., Gosline, J.M., 1997. Strategies for life in flow: tenacity, morphometry, and 581
probability of dislodgment of two Mytilus species. Mar. Ecol. Prog. Ser. 159, 197–208.
582
Berkman, P.A., Haltuch, M.A., Tichich, E., Garton, D.W., Kennedy, G.W., Gannon, J.E., 583
Mackey, S.D., Fuller, J.A., Liebenthal, D.L., 1998. Zebra mussels invade Lake Erie muds.
584
Nature 393, 27–28.
585
Berkman, P.A., Garton, D.W., Haltuch, M.A., Kennedy, G.W., Febo, L.R., 2000. Habitat shift 586
in invading species: Zebra and quagga mussel population characteristics on shallow soft 587
substrates. Biol. Inv. 2, 1–6.
588
Bidwell, J.R., 2010. Range expansion of Dreissena polymorpha: a review of major dispersal 589
vectors in Europe and North America. In: Van der Velde, G., Rajagopal, S., Bij de Vaate, 590
A. (Eds.), The zebra mussel in Europe. Backhuys Publishers, Leiden, Margraf Publishers, 591
25 Weikersheim, Germany. pp. 69–78.
592
Bij de Vaate, A., 1991. Distribution and aspects of population dynamics of the zebra mussel, 593
Dreissena polymorpha (Pallas, 1771), in the Lake IJsselmeer area (The Netherlands).
594
Oecologia 86, 40-50.
595
Bij de Vaate, A., van der Velde, G., Leuven, S.E.W.R., Heiler, K.C.M., 2013. Spread of the 596
quagga mussel (Dreissena rostriformis bugensis) in western Europe. In: Nalepa, T.F., 597
Schloesser, D.W. (Eds.), Quagga and zebra mussels: biology, impacts, and control. CRC 598
Press, Boca Raton, Florida, USA, pp. 83-92.
599
Bij de Vaate, A., Jansen, E.A., 2009. De verspreiding van de quaggamossel in de 600
Rijkswateren. Spirula 368, 72-75.
601
Bódis, E., Tóth, B., Sousa, R., 2014. Impact of Dreissena fouling on the physiological 602
condition of native and invasive bivalves: interspecific and temporal variations. Biol. Inv.
603
16, 1373-1386.
604
Casper, A.F., Johnson, L.E., 2010. Contrasting shell/tissue characteristics of Dreissena 605
polymorpha and Dreissena bugensis in relation to environmental heterogeneity in the St.
606
Lawrence River. J. Great Lakes Res. 36, 184–189.
607
Clarke, M., Mcahon, R.F., 1996. Effects of current velocity on byssal-thread production by 608
the freshwater mussel, Dreissena polymorpha. Can. J. Zool. 74, 63–69.
609
Claxton, W.T., Mackie, G.L., 1998. Seasonal and depth variation in gametogenesis and 610
spawning of Dreissena polymorpha and Dreissena bugensis in eastern Lake Erie. Can. J.
611
Zool. 76, 2010–2019.
612
Coakley, J.P., Brown, G.R., Ioannou, S.E., Charlton, M.N., 1997. Colonization patterns and 613
densities of zebra mussel Dreissena in muddy offshore sediments of western Lake Erie, 614
Canada. Water Air Soil Pollut. 99, 623–632.
615
Collas, F.P.L., Karatayev, A.Y., Burlakova, L.E., Leuven, R.S.E.W., 2018. Detachment rates 616
26
of dreissenid mussels after boat hull-mediated overland dispersal. Hydrobiologia 810(1), 617
77-84.
618
Côté, I.M., 1995. Effects of predatory crab effluent on byssus production in mussels. J Exp.
619
Mar. Biol. Ecol. 188, 233–241.
620
Czarnołęski, M., Kozłowski, J., Kubajak, P., Lewandowski, K., Müller, T., Stańczykowska, 621
A., Surówka, K., 2006. Crosshabitat differences in crush resistance and growth pattern of 622
zebra mussels (Dreissena polymorpha): effects of calcium availability and predator 623
pressure. Arch. Hydrobiol. 165, 191–208.
624
De Jong, J., Bij de Vaate, A., 1989. Dams and the environment: The Zuiderzee damming.
625
International Commission on Large Dams (IOCLD) Bulletin, pp. 66. Paris.
626
De Lucas Pardo, M.A., Sarpe, D., Winterwerp, J.C., 2015. Effect of algae on flocculation of 627
suspended bed sediments in a large shallow lake. Consequences for ecology and sediment 628
transport processes. Ocean Dynam. 65, 889-903.
629
Dermott, R., Dow, J., 2008. Changing benthic fauna of Lake Erie between 1993 and 1998. In:
630
Munawar, M., Heath, R. (Eds.), Checking the Pulse of Lake Erie. Goodwords Books, New 631
Delhi, India, pp. 409–438.
632
De Leeuw, J.J., Van Eerden, M.R., 1992. Size selection in diving tufted ducks Aythya fuligula 633
explained by differential handling of small and large mussels. Ardea 80, 353-362.
634
De Leeuw, J.J., Van Eerden, M.R., 1995. Duikeenden in het IJsselmeergebied. Herkomst, 635
populatie-structuur, biometrie, rui, conditie en voedselkeuze. Flevobericht 373, RWS 636
Directie IJsselmeergebied, Lelystad.
637
De Zwaan, A., Zande, D.I., 1972. Body distribution and seasonal changes in the glycogen 638
content of the common sea mussel Mytilus edulis. Comp. Biochem. Physiol. 43, 53-58.
639
D’Hont, A., Gittenberger, A., Hendricks, A.J., Leuven, R.S.E.W., 2018. Drivers of dominance 640
shifts between invasive Ponto-Caspian dreissenids Dreissena polymorpha (Pallas, 1771) 641
27
and Dreissena rostriformis bugensis (Andrusov, 1897). Aquat. Inv. 13, 449-462.
642
Diggins, T.P., 2001. A seasonal comparison of suspended sediment filtration by quagga 643
(Dreissena bugensis) and zebra (D. polymorpha) mussels. J Great Lakes Res 27, 457–466.
644
Dolmer, P., 1998. The interactions between bed structure of Mytilus edulis L. and the predator 645
Asterias rubens L. J Exp. Mar. Biol. Ecol. 228, 137–150.
646
Entz, G., Sebestyén, O., 1942. The life of Lake Balaton. Királyi Magyar Természetudományi 647
Társulat, Budapest, Hungary.
648
Entz, B. 1981. Windgeschwindigkeit, Schwebstoffmengen und Lichtverhältnisse im 649
Balatonsee. BFBBericht 42, 69–78.
650
Freeman, A.S., Byers, J.E., 2006. Divergent induced responses to an invasive predator in 651
marine mussel populations. Science 313, 831–833.
652
Gardner, J.P.A., Skibinski, D.O.F., 1991. Biological and physical factors influencing 653
genotype-dependent mortality in hybrid mussel populations. Mar. Ecol. Prog. Ser. 71, 235–
654
243.
655
Grutters, B.M.C., Verhofstad, M.J.J.M., van der Velde, G., Rajagopal, S., Leuven, R.S.E.W., 656
2012. A comparative study of byssogenesis on zebra and quagga mussels: the effects of 657
water temperature, salinity and light-dark cycle. Biofouling 28, 121–129.
658
Harger, J.R.E., 1970. The effect of wave impact on some aspects of the biology of sea 659
mussels. Veliger 12, 401–414.
660
Heiler, K.C.M., Brandt, S., Albrecht, C., Hauffe, T., Wilke, T., 2012. A new approach for 661
dating introduction events of the quagga mussel (Dreissena rostriformis bugensis). Biol 662
Inv. 14, 1311–1316.
663
Istvánovics, V., Clement, A., Somlyódy, L., Specziár, A., G-Tóth, L., Padisák, J., 2007.
664
Updating water quality targets for shallow Lake Balaton (Hungary), recovering from 665
eutrophication. Hydrobiologia 581, 305-318.
666
28
Jarvis, P., Dow, J., Dermott, R., Bonnell, R., 2000. Zebra (Dreissena polymorpha) and quagga 667
mussel (Dreissena bugensis) distribution and density in Lake Erie 1992–1998. Can Tech 668
Rep. Fish. Aquat. Sci. 2304, 1-46.
669
Karatayev, A.Y., Burlakova, L.E., Padilla, D.K., 1998. Physical factors that limit the 670
distribution and abundance of Dreissena polymorpha (Pall.). J Shellfish Res. 17, 1219–
671
1235.
672
Karatayev, A.Y., Burlakova, L.E., Mastitsky, S.E., Padilla, D.K., Mills, E.L., 2011.
673
Contrasting rates of spread of two congeners, Dreissena polymorpha and Dreissena 674
rostriformis bugensis at different spatial scales. J. Shellfish. Res. 30, 923–931.
675
Karatayev, A.Y., Mastitsky, S.E., Padilla, D.K., Burlakova, L.E., Hajduk, M.M., 2010.
676
Differences in growth and survivorship of zebra and quagga mussels: size matters.
677
Hydrobiologia 668, 183-194.
678
Karatayev, A.Y., Burlakova, L.E., Padilla, D.K., 2013. In Quagga and zebra mussels: biology, 679
impacts, and control. Nalepa, T.F., Schloesser, D.W. (Eds.), General overview of zebra and 680
quagga mussels: what we know and do not know. CRC Press, Boca Raton, Florida, USA, 681
pp. 695–703.
682
Kemp, J.S., Aldridge, D.C., 2018. Comparative functional responses to explain the impact of 683
sympatric invasive bivalves (Dreissena spp.) under different thermal regimes. J. Mollus.
684
Stud. 84, 175-181.
685
Kerambrun, E., Delahaut, L., Geffard, A., David, E., 2018. Differentiation of sympatric zebra 686
and quagga mussels in ecotoxicological studies: A comparison of morphometric data, gene 687
expression, and body metal concentrations. Ecol. Environ. Safety 154, 321-328.
688
Kobak, J., 2001. Light, gravity and conspecifics as cues to site selection and attachment 689
behaviour of juvenile and adult Dreissena polymorpha Pallas, 1771. J Moll. Stud. 67, 183–
690
189.
691
29
Kobak, J., 2006. Factors influencing the attachment strength of Dreissena polymorpha 692
(Bivalvia). Biofouling 22, 141–150.
693
Kobak, J., Poznańska, M., Kakareko, T., 2009. Effect of attachment status and aggregation on 694
behaviour of the zebra mussel, Dreissena polymorpha, Bivalvia. J. Moll. Stud. 75, 109- 695
117.
696
Leonard, G.H., Bertness, M.D., Yund, P.O., 1999. Crab predation, waterborne cues, and 697
inducible defences in the blue mussel Mytilus edulis. Ecology 80, 1–14.
698
Lóczy, L., 1894. A Balaton környékének geológiai történetéről és jelenlegi geológiai 699
jelentőségéről. Földrajzi Közlöny 22, 1-62.
700
Mandemakers, J., 2013. The impact of suspended sediments and phosphorous scarcity on 701
zebra mussel and quagga mussel growth. Wageningen. Master’s thesis, Utrecht University 702
/ NIOO-KNAW. pp. 1-50.
703
Madon, S.P., Schneider, D.W., Stoeckel, J.A., Sparks, R.E., 1998. Effects of inorganic 704
sediment and food concentrations on energetic processes of the zebra mussel, Dreissena 705
polymorpha: implication for growth in turbid rivers. Can. J. Fish. Aquat. Sci. 55, 401-413.
706
Majoros, G., 2009. Invazív kagylófajok terjeszkedése a Balatonban: esetismertetés és a 707
probléma felvetése. Halászatfejlesztés. Fish. Aquacult. Dev. 32, 57-64.
708
Matthews, J., Van der Velde, G., Bij de Vaate, A., Collas, F.P.L., Koopman, K.R., Leuven, 709
R.S.E.W., 2014. Rapid range expansion of the invasive quagga mussel in relation to zebra 710
mussel presence in The Netherlands and Western Europe. Biol. Inv. 16, 23-42.
711
Máté, F., 1987. Mapping of recent sediments in Lake Balaton. A Magyar Állami Földtani 712
Intézet évi jelentése az 1985. évről. 367–379.
713
Metz, O., Temmen, A., von Oheimb, C.M., Albrecht, C., Schubert, P., Wilke, T., 2018.
714
Invader vs. invader: intra- and interspecific competition mechanisms in zebra and quagga 715
mussels. Aquat. Inv. 13, 473-480.
716
30
Miller, G., Wagner, F., 1978. Holocene carbonate evolution in Lake Balaton (Hungary) a 717
response to climate and impact. Special Publ. Internat Assoc. Sedimentol. 2, 57-81.
718
Mills, E.L., Rosenberg, G., Spidle, A.P., Ludyanskiy, M., Pligin, Y., May, B., 1996. A review 719
of the biology and ecology of the quagga mussel (Dreissena bugensis), a second species of 720
freshwater Dreissenid introduced to North America. Am. Zool. 36, 271–286.
721
Molloy, D.P., Karatayev, A.Y., Burlakova, L.E., Kurandina, D.P., Laruelle, F., 1997. Natural 722
enemies of zebra mussels: predators, parasites, and ecological competitors. Rev. Fish. Sci.
723
5, 27–97.
724
Molloy, D.P., bij de Vaate, A., Wilke, T., Giamberini, L., 2007. Discovery of Dreissena 725
rostriformis bugensis (Andrusov 1897) in Western Europe. Biol. Inv. 9, 871–874.
726
Naddafi, R., Rudstam, L.G., 2013a. Predator-induced behavioural defences in two 727
competitive invasive species: the zebra mussel and the quagga mussel. Anim. Behav. 86, 728
1275–1284.
729
Naddafi, R., Rudstam, L.G., 2013b. Predator diversity effects in an exotic freshwater food 730
web. Plos One 8, e72599.
731
Nagarajan, R., Lea, S.E.G., Goss-Custard J.D., 2006. Seasonal variations in mussel, Mytilus 732
edulis L. shell thickness and strength and their ecological implications. J. Exp. Mar. Biol.
733
Ecol. 339, 241–250.
734
Nalepa, T.F., Fanslow, D.L., Pothoven, S.A., 2010. Recent changes in density, biomass, 735
recruitment, size structure, and nutritional state of Dreissena populations in southern Lake 736
Michigan. J. Great Lakes Res. 36, 5–19.
737
Noordhuis, R., 2007. Water quality and ecological changes in Lake Markermeer-IJmeer.
738
Landschap 2014, 13-21.
739
Oreska, M.P., Aldridge, D.C., 2010. Estimating the financial costs of freshwater invasive 740
species in Great Britain: a standardized approach to invasive species costing. Biol Inv. 13, 741
31 305–319.
742
Orlova, M.I., Muirhead, J.R., Antonov, P.I., 2004. Range expansion of quagga mussels 743
Dreissena rostriformis bugensis in the Volga River and Caspian Sea basin. Aquat. Ecol.
744
38, 561–573.
745
Orlova, M.I., Therriault, T.W., Antonov, P.I., Shcherbina, G.K., 2005. Invasion ecology of 746
quagga mussels (Dreissena rostriformis bugensis): A review of evolutionary and 747
phylogenetic impacts. Aquat. Ecol. 39, 401–418.
748
Patterson, M.W.R., Ciborowski, J.J.H., Barton, D.R., 2005. The distribution and abundance of 749
Dreissena species (Dreissenidae) in Lake Erie, 2002. J. Great Lakes Res. 31, 223-237.
750
Palais, F., Mouneyrac, C., Dedourge-Geffard, O. Giambérini. L., Biagianti-Risbourg, S., 751
Geffard, A., 2011. One-year monitoring of reproductive and energy reserve cycles in 752
transplanted zebra mussels (Dreissena polymorpha). Chemosphere 83, 1062-1073.
753
Penning, W.E., Pozzato, L., Vijverberg, T., Noordhuis, R., Bij de Vaate, A., Van Donk, E., 754
Dionisio Pires, M., 2013. Effects of suspended sediments on seston food quality for zebra 755
mussels in Lake Markermeer, The Netherlands. Inland Waters 3, 437-450.
756
Peyer, S.M., McCarthy, A.J., Lee, C.E., 2009. Zebra mussels anchor byssal threads faster and 757
tighter than quagga mussels in flow. J Exp. Biol. 212, 2027–2036.
758
Peyer, S.M., Hermanson, J.C., Lee, C.E., 2011. Effects of shell morphology on mechanics of 759
zebra and quagga mussel locomotion. J. Exp. Biol. 214, 2226-2236.
760
Pimentel, D., Zuniga, R., Morrison, D., 2005. Update on the environmental and economic 761
costs associated with alien-invasive species in the United States. Ecol. Econom. 52, 273- 762
288.
763
Ponyi, J., 1994. Abundance and feeding of wintering and migrating aquatic birds in two 764
sampling areas of Lake Balaton in 1983-85. Hydrobiologia 279/280, 63-69.
765
Quinn, A., Gallardo, B., Aldridge, D.C., 2013. Quantifying the ecological niche overlap 766
32
between two interacting invasive species: the zebra mussel (Dreissena polymorpha) and 767
the quagga mussel (Dreissena rostriformis bugensis). Aquat. Conserv. Mar. Freshwat.
768
Ecosyst. 24, 324–337.
769
Rajagopal, S., Van der Velde, G., Van der Gaag, M., Jenner, H.A., 2005. Factors influencing 770
the upper temperature tolerances of three mussel species in a brackish water canal: size, 771
season and laboratory protocols. Biofouling 21, 87–97.
772
Rajagopal, S., Venugopalan, V.P., van der Velde, G., Jenner, H.A., 2006. Mussel colonization 773
of a high flow artificial benthic habitat: Byssogenesis holds the key. Mar. Environ. Res. 62, 774
98-115.
775
Rajagopal, S., Van der Velde, G., Jenner, H.A., Van der Gaag, M., Kempers, A.J., 1996.
776
Effects of temperature, salinity and agitation on byssus thread formation of zebra mussel;
777
Dreissena polymorpha. Neth J. Aquat. Ecol. 30, 187–195.
778
Reimer, O., Tedengren, M., 1996. Phenotypical improvement of morphological defences in 779
the mussel Mytilus edulis induced by exposure to the predator Asterias rubens. Oikos 75, 780
383–390.
781
Ricciardi, A., Whoriskey, F., 2004. Exotic species replacement: Shifting dominance of 782
dreissenid mussels in the Soulanges Canal, upper St. Lawrence River, Canada. J North 783
Am. Benthol. Soc. 23, 507–514.
784
Ricciardi, A., MacIsaac, H.J., 2011. Impacts of biological invasions on freshwater 785
ecosystems. In: Richardson, D. M. (Eds.), Fifty Years of Invasion Ecology: The Legacy of 786
Charles Elton. Wiley-Blackwell, West Sussex, UK, pp. 211-224.
787
Roe, S.L., MacIsaac, H.J., 1997. Deepwater population structure and reproductive state of 788
quagga mussels (Dreissena bugensis) in Lake Erie. Can. J. Fish. Aquat. Sci 54, 2428–
789
2433.
790
Sebestyén, O., 1938. Colonization of two new fauna-elements of Pontus-origin (Dreissena 791