6.1 INTRODUCTION
The disintegration of economic blocs or countries always results in a sharp decrease in economic interaction between their past constituencies. These trends may vary regarding their speed, magnitude, nature, and the degree to which different countries are affected. The decline may last decades and have a sizeable underlying inertia. Hence, the main question concerns the way in which these disintegrative trends are managed, whether the partners can find alternative forms of cooperation, and whether the future development can counterbalance the centrifugal forces.
Accordingly, the likely professional hunch regarding the current economic trends in the post-Soviet space would be an ongoing gradual decline in cooperation. ‘Only’ 27 years after the dissolution of the Soviet Union, any other outcome of this research would constitute a major sur- prise. Nonetheless, there are many forms and variations of decline, which is why the quantitative research has to be supplemented by a cautious and in-depth interpretation. What are the structural drivers, models of development and growth in the region? Are there any alternative powers of gravity? Do the countries try to suppress disintegrative trends, and how do they overcome their consequences? What role do the political considerations and the integration projects play? Looking beyond the statistics may provide a more justified view of where this long-lasting trend may lead, and what kind of sustainable cooperation can be formed between the post-Soviet countries in the years to come.
6. ADHESIVE AND CENTRIFUGAL FORCES IN THE POST-SOVIET ECONOMIC SPACE
András Deák
This chapter provides an overview of the economic interlinkages be- tween post-Soviet countries and their major trends. Section one briefly outlines key economic drivers within the region since the early 1990s.
Section two delves into the statistics of the issue, relying primarily on foreign trade indicators as the most reliable and accessible sources, but also foreign direct investments (FDI) and, where applicable and relevant, labour movements and financial transfers. The third section discusses the role of post-Soviet integration projects and simultaneously the issue of alternative gravity centres, like the EU and China. The chapter concludes by sharing some thoughts on the integrability of regional countries.
6.2 THE SPECIFICS AND DYNAMICS OF THE POST-SOVIET ECOSPHERE
There are two conventional views on post-Soviet economic coopera- tion. The one with the stronger political-macroeconomic focus interprets regional ties as a Soviet legacy, where value chains and industrial ties inherited from Soviet Union times prevail. According to this view, this cooperation is doomed to decline since, with Soviet technology becoming increasingly obsolete, countries are turning to other, lucrative markets.
Politics may slow down this process by making financial sacrifices, but in the longer run structural drivers point towards disintegration.1 The other view, based more distinctly on corporate strategies, looks at the region as a whole. Foreign multinationals, car makers, agricultural and pharmaceutical producers, and banks do not enter Russia, Kazakhstan or Ukraine separately. They establish their assembly lines for a handful of regional markets due to similar cultural segmentation of demand, lower customs levels, infrastructural and geographic proximity, or simply to gain access to bigger markets. For emerging local companies, foreign expansion almost always starts by entering the neighbouring countries through trade or investments. According to this discourse, some regional ties are normal and can be exploited with synergies, opening up possi- bilities for a new kind of regional cooperation.2
Elaborating on this scene, we have some ‘strange species’ in this re- gion, like Belarus, which created its ‘long survival story’ with a partially upgraded, but unreformed economy.3 Preserving its Soviet industrial patterns, it launched a brutal export offensive based on the CIS area and
1 Aslund 2013.
2 Deuber and Romanova 2015.
3 See Ioffe and Yarashevich 2011.
achieved relatively high growth rates. Belarus still conducts more than 60% of its foreign trade with post-Soviet countries, and its share of total intra-regional turnover grew from 7.3% to 23.5% between 1994 and 2016.
Consequently, when one examines post-Soviet economic cooperation, it is reasonable to treat the region as a particular ecosphere with the local countries or corporations as its subjects. Each subject accommodates to its surroundings, implementing its strategy in a post-Soviet sphere that plays various roles in different contexts. Some may coexist with this environment, some have moved to the borderlands and only partially depend on it, while the larger subjects can even try to transform the place where they live. The totality of these strategies coupled with a good deal of path dependency constitute the region and determine its future patterns. Accordingly, it is important to take stock of these peculiarities, and identify some of the paradigms of the given ecosphere.
1. Russia has a monolithic share among the post-Soviet economies. In 2017 it represented 75.3% (IMF data at current prices) of the regional GDP, up from 67% in 1992.4 The second-ranked Kazakhstan had a mere 7.9%, despite steadily catching up after the Soviet breakup. For com- parison purposes, it is like a European Union, where the 19 Eurozone countries (in 2016 their combined share was 72.9%) create a single entity and form an economic region with the other 9 EU members.
The post-Soviet regional set-up is concentrated around Russia, in- dependently of Moscow’s ambitions or policies.
2. The regional growth rate lags behind the global rate, as these coun- tries could not establish a sustainable model for catching up. Between 1992 and 2016, annual average growth rates were 2.2% within the post-Soviet area versus the global 3.7%. What is more, the post-Soviet recovery from the 2008–09 crisis was even more sluggish. The average annual regional weighted growth between 2008 and 2016 represented 1.3%, two percentage points below the global level. All of this suggests that old cooperation patterns still retain some of their relevance, and have not been replaced by new mechanisms and development drivers.
3. The only means of relative prosperity has been through hydrocarbon exports. If we add Belarus to the group of net energy exporters (from the macroeconomic point of view this is justified since its economic
4 In terms of data sources, unless indicated otherwise, under post-Soviet space I have included the 12 former Soviet countries (not the Baltic states). I have used IMF World Economic Outlook and World Bank data for GDP and general macroeconomic indicators. For foreign trade and some intra-regional comparisons, I have referred to CISStat, which does not include data on Turkmenistan and Uzbekistan. In this regard, unless indicated otherwise, post-Soviet (or alternatively CIS) foreign trade includes only 10 countries. The foreign trade data for Georgia after 2009 has been supplemented with data from the national statistical provider. FDI data has been collected from UNCTAD and some expert and national providers. Other sources are indicated in the text.
growth has a slightly positive correlation with with oil price hikes due to Russian implicit subsidies5), the average performance of the six energy exporters exceeds one of the importers on a GDP PPP per capita basis almost threefold (17,198 USD vs 6273 USD in 2015). Hydrocarbon exports are strongly disintegrative in terms of regional cooperation.
While in the short run they may provide a certain complementary impetus between exporters and importers due to high regional ener- gy intensities and price hikes, in the medium and longer run exports go to the advanced economies outside the region. Furthermore, rent revenues from oil and gas push elite mindsets towards less cooperative outcomes, where national economies can stand alone and complex value chains in manufacturing and processing industries and services are less important.
4. Power legitimization through economic growth and prosperity have not become an exclusive priority in the region. While in Western de- veloped countries elite legitimization tends to rely heavily on eco- nomic performance, regional political systems often pursue nation building and/or great power agendas in order to maintain their social support. While in some cases local elites opted for economic consoli- dation instead of national self-identification (Belarus in the 1990s and early 2000s) or could pursue these policies in parallel (Kazakhstan), these two trends often substitute each other. The wish for economic consolidation provided the most efficient stimulus for integration efforts by far.
5. The state remains a key actor in most of these countries independently of its capabilities. Paternalistic expectations are high in these societies, while dirigist solutions and heavy reliance on state ownership, when applicable, remain popular among the elites. At the same time, market reforms and liberalization are rare occurrences in the region (a partial exception being Georgia). These features correlate well with the more authoritarian political systems of the energy exporters, while lead- ing to permanent economic and social imbalances in other countries (namely Ukraine, Kyrgyzstan, and Moldova).
Although these characteristics paint a gloomy, inward-looking picture of the post-Soviet space, the regional megatrend had been one of liber- alization and gradual opening until the 2014 sanctions and protectionist shifts in Russia. The combined foreign trade of the CIS countries (except Turkmenistan and Uzbekistan) grew 8.3 times between 1994 and 2014, twice as fast as global trade. Eight countries from the region joined the
5 According to the IMF, the 2015 oil price drop had a modest but negative impact on Belarusian GDP growth, ranging between 0 and 0.5 per cent. IMF Staff Report – Belarus 2015, p. 8.
WTO with significant liberalization commitments. The level of foreign direct investments caught up to the lowest level of the CEE range on a per capita basis after 2005 in the more developed countries, like Russia and Kazakhstan (UNCTAD). Keeping in mind the relatively slow average GDP growth and the low initial basis, the openness of these economies has grown significantly since the late Soviet years. This is natural given that the Soviet Union was a closed entity, only loosely connected to the world economy. After 1991, in the midst of the Soviet economic collapse, these countries were only able to find markets, capital and modern know-how outside the region.
At the same time, local economic setups have only partially evolved into export-driven models. Unlike the new EU member states from CEE, where foreign trade/GDP indicators have doubled or tripled and had risen above 150% (except in Poland and Latvia) by 2016, the post-Soviet average remained around 80% (World Bank). Foreign multinational companies have never acquired system-building characteristics in the local econ- omies. While they could acquire significant shares in some sectors, the backbone of national performance was provided by companies with do- mestic owners and by state-owned actors. Foreign multinationals engaged the region primarily driven by different motivations from those in the CEE countries. In the latter case efficiency-seeking, and access to a low-wage, educated workforce above all, constituted the primary objective, while in the post-Soviet space resource- and market-seeking considerations remained dominant.6 Apart from the quasi-unreformed Belarus and Turkmenistan, the region’s economies constitute various kinds of hybrid capitalist formations, where the mental and policy patterns of Socialism remain relatively strong, while the most fundamental systematic and institutional transformative steps have been taken and are effective.
Intra-CIS economic relations have to be examined on the basis of these ambiguous fundaments. With the exception of Belarus and some smaller states, economic opening meant that intra-CIS relations grad- ually lost their importance within external ties. The regional share of intra-CIS turnover in total foreign trade decreased from 34.5% to 19.1%
between 1994 and 2016. This did not indicate a decrease in absolute terms on the current USD basis, as the total trade volumes grew almost three- fold. Compared to local combined GDPs, the share of intra-CIS trade has retained much of its share today, and in some cases it may even have increased since the early 1990s. This comes as no surprise given the high level of barter trade within the region, and particularly the artificially low energy prices until the late 2000s. These price rises influenced the data
6 This hypothesis was also positively tested by broad surveys among companies in four CIS countries. See Kudina and Jakubiak 2012.
tremendously both at the total foreign level, and at the intra-CIS trade levels in particular.
Given the economic collapse in the 1990s and the determined search for alternative markets, the fall in regional cooperation during the first decade was understandable. What is more noteworthy is that the intra-CIS trade share was unable to grow thereafter during the years of recovery and high growth in the 2000s: it constituted 27.8% in 2000 and only 21.5% in 2008. During this period, there was an opportunity to establish new forms of regional cohesion, and revitalize former value chains and sectoral cooperation. Nonetheless, economic consolidation brought a further decrease in post-Soviet trade and FDI flows, and external ties proved to be more sustainable than intraregional ones. A good explana- tion for this is the intensive growth in the global economy. The decade preceding the financial crisis was the Golden Age of the world economy.
An abundance of capital in advanced financial markets pushed Western FDI to semi-peripheral, emerging markets. High growth rates implied rising raw material prices, creating favourable conditions for energy and metal exports, and boosting local mining sectors. Between 2000 and 2007, Russian hydrocarbon exports increased by 42.5% in volumetric terms, Azeri oil production tripled, while Kazakh production doubled. During these years, external markets were in pretty good shape, explaining some of the decline in intra-CIS shares.
In this regard, the years after 2008 are particularly interesting. The fall in the intra-CIS share in total trade decelerated significantly, decreasing from 21.5% to just 19.1% between 2008 and 2016. The main decrease occurred in 2014, with the Russia-Ukraine conflict clearly playing a con- siderable role. Nonetheless, some symptoms emerged before 2014. After the financial crisis, the risk appetite for emerging markets decreased considerably. Post-Soviet energy production also started to plateau:
Russian export volumes grew by just 13.8%, Kazakh oil production by 23.6% until 2017, while Azeri drilling started to gradually decline. This is a strong indication that the region is reaching the limitations of its extensive growth. It does not mean that high prices could not boost the region again temporarily. What it does mean is that regional countries cannot increase their production much further, their production costs will likely rise through reserve substitution, and these two factors will imply less rent and budgetary income measured at constant oil and gas prices in the years to come.7
2014 may constitute another milestone in terms of Russia’s shift to- wards import substitution and a more protectionist stance. While this
7 A more detailed analysis of Russia is provided by Gustafson 2012.
trend has emerged in the wake of Western sanctions and Moscow’s coun- ter-sanctions, the liberalization agenda had been losing ground prior to the Ukrainian crisis. The implementation of the WTO rules remained rather isolated and did not expand into a wave of economic liberalization, as in China. The protectionist agenda has long been propagated at the level of the Kremlin primarily by Sergey Glazyev, senior advisor to the President.
Given the protectionist Zeitgeist even in the Western hemisphere, it is reasonable to say that protectionism will remain a major temptation in the post-Soviet space, and it remains to be seen how it will affect in- tra-regional cooperation.
6.3 THE STEPPING STONES OF DECLINE
Foreign trade is the most accessible and reliable indicator of regional co- operation. As Table 3 shows, the share of intra-CIS trade fell in all ten of the countries under study, apart from Tajikistan (for which, along with the Caucasus Republics, the base year of 1994 is somewhat misleading because of their respective armed conflicts). Nonetheless, the magnitude of decline is rather different from country to country. Belarus, and to a lesser extent Armenia, retained their heavy reliance on CIS markets, namely Russia to an overwhelming degree. Intra-CIS foreign trade is less concentrated in the case of Tajikistan and Kyrgyzstan, for which Kazakhstan constitutes their biggest export outlet and the second larg- est source of imports. In all of the other cases, the significance of the CIS decreased gradually with some fluctuations.
The first factor worth examining is energy trade, as it constitutes the primary reason for decline. In the case of Azerbaijan and Kazakhstan, the drop is most likely connected to the rise in their oil production. With Astana heavily and Baku excessively dependent on hydrocarbon exports,
the bulk of their production goes outside the region,8 so their performance can easily be attributed to this single fact. This may also be true of Russia, although it has a more complex relationship in this matter due to its role as a major supplier of gas and oil to the region.
Nonetheless, CIS energy trade has a high level of price responsive- ness, and high energy prices may trigger a robust downward trend in trade volumes. In 2003, at a time of low energy prices, 43% of Russia’s exports to the CIS consisted of mineral fuels. Given the low gas and, in the case of Belarus, low oil export prices, these shares are comparable to the extra-CIS levels (the respective share for non-CIS exports was 59.5%).
This went up to 55.3% (72.7%) by 2011, only to plummet by 2017 to 33%
(63.4%). Nonetheless, while Belarusian and Armenian imports remained flat in terms of volume, Moldovan imports fell substantially and Ukrainian imports shrank even further, with the result that its consumption of oil and gas has practically halved during the last 15 years. The transformation
8 In 2017, 89.5% of Azeri and 69.3% of Kazakh exports were mineral fuels. In the Kazakh case, only 4.4% of all mineral exports went to the CIS.
1994 1996 1998 2000 2002 2004 2006 2008 2010 2012 2014 2016
Azerbaijan 53.2 39.6 37.8 20.9 23.3 25.4 26.0 7.2 14.4 10.8 9.4 16.0
Armenia 59.6 35.4 27.7 20.8 26.7 24.7 28.6 30.0 28.0 29.6 28.8 30.3
Belarus 64.0 66.2 68.6 65.5 62.4 63.4 54.9 56.0 56.8 58.2 59.1 60.9
Georgia** 78.9 45.0 34.8 34.7 40.4 39.4 38.8 33.7 32.6 31.7 31.3 28.9 Kazakhstan 59.6 60.3 43.1 36.6 32.2 31.1 26.9 26.2 26.2 25.2 23.7 28.5 Kyrgyzstan 65.8 65.5 49.4 48.3 45.8 51.6 52.1 54.0 50.1 53.5 49.7 42.3
Moldova 72.0 64.0 52.5 42.9 45.1 46.0 38.6 36.4 34.9 34.6 28.5 23.8
Russia 23.9 23.2 21.8 18.6 16.9 18.3 14.7 14.5 14.6 14.8 12.7 12.5
Tajikistan 31.3 49.6 49.6 64.0 50.5 44.3 41.2 44.1 44.8 45.0 45.6 50.1
Ukraine 64.0 58.1 44.3 43.9 38.2 38.5 39.4 37.6 40.5 38.9 29.7 19.3
Table 3: The share of intra-CIS trade in external trade, 1994–2016, %*
Source: CISStat, Geostat
* Complete data unavailable for Turkmenistan and Uzbekistan;
** data for years after 2009 from Geostat.ge
from low prices and high volume trade to global pricing had a negative effect on turnover. Soft pricing still plays a considerable role in keeping Russian exports to Belarus and Armenia high.
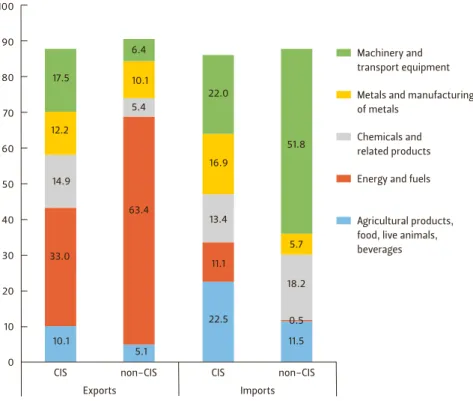
Besides and partly because of the shrinking share of energy in Russian exports, the product structure of Moscow’s foreign trade within the CIS remains relatively ‘evenly distributed’. It does not have a distinguished profile, hinting at the existence of complex value chains. This is in marked contrast to its non-CIS turnover. Russia’s energy supplier status vis-à-vis other, European and Asian countries is well-reflected in its trade statis- tics: almost two-thirds of its exports consist of fuels and more than half of its imports comprise machinery and transport equipment (Figure 4).
At the same time, the Russian CIS trade structure does not have the same trenchant features of division of labour. Due to the decreasing share of energy, little complementarity has remained in the intra-CIS trade struc- ture. It looks more like trade between entities of similar economic setups.
While this does not exclude the existence of some verticality of particular sectors, successful integrations are based on broad complementarity and/
or complex value chains, penetrating the whole economy. This might impose a considerable constraint on future deepening of cooperation between the parties.
100
90
80
70
60
50
40
30
20
10
0
17.5
12.2
14.9
33.0
10.1
CIS
Exports Imports
22.0
16.9
13.4
11.1
22.5
CIS 63.4
5.1 5.4 10.1 6.4
non-CIS
51.8
5.7
18.2
0.5 11.5
non-CIS
Machinery and transport equipment
Chemicals and related products
Agricultural products, food, live animals, beverages Energy and fuels Metals and manufacturing of metals
Figure 4: The product structure of Russian foreign trade with CIS and non-CIS countries in 2017, %.
Source: Russian Customs Service
Another surprising phenomenon is the distribution of intra-CIS trade between countries. Normally when a system falls apart, the relations between its smaller and distinct entities suffer more than those with its bigger units. Nonetheless, as shown in Table 4, it was not Russia that was boosting its share within post-Soviet trade, but Kazakhstan and Belarus.
The Kazakh data, as well as the steep decline in Ukrainian proportions can be partly attributed to their respective rise and fall in GDP shares.
The Belarus data is somewhat misleading, as its intra-CIS trade almost completely covers Russia (above 85%). Furthermore, the relative rise in shares of EAEU members between 2005 and 2016 may be a result of trade diversion due to the customs union (as indicated later in this chapter).
The relatively low data for Russia, especially if compared to Moscow’s significantly higher share in post-Soviet GDPs, raises some doubts re- garding the business underpinnings of its reintegration efforts. Despite all of the integration measures at the political and macroeconomic level, it was unable to boost its role as the centre of trade within the region.
This is likely and primarily a consequence of Moscow’s political conflicts and economic statecraft policies, and the use of trade embargoes with- in the region. Most notably, bilateral trade with Ukraine, once a major constituency of intra-CIS relations, fell by 74.2% between 2013 and 2016.
Meanwhile, Russian trade ties with EAEU members or in politically neutral cases have remained intact or have even deepened, as was the case with Belarus and Kazakhstan.
Table 4: The distribution of CIS foreign trade between 10 countries, 1994–2016, % Source: CISStat
1994 2005 2016
Azerbaijan 1.6 2.0 2.1
Armenia 0.7 0.6 1.2
Belarus 7.3 15.5 23.5
Georgia 0.8 1.2 2.1
Kazakhstan 8.3 10.4 13.4
Kyrgyzstan 0.9 0.8 1.8
Moldova 1.8 1.2 1.1
Russia 50.2 43.8 44.5
Tajikistan 0.7 0.9 1.5
Ukraine 27.7 23.6 11.0
Another important issue is inward foreign direct investments (iFDI) and their trade creation. Given the methodological and reporting prob- lems, it would be difficult to identify FDI flows on a bilateral, or even on an intra-regional basis. Suffice it to say that according to the Russian Central Bank, the combined level of the CIS in Russian outward FDI was ranked in only 21st place on a nominal basis – an obviously absurd figure.
Hence Table 5 presents only combined iFDI levels on a per capita basis, in an attempt to map out some possible ways in which foreign investments affected post-Soviet trade levels. As mentioned above, average post-Soviet iFDI levels remain moderate, suggesting that new value chains did not fundamentally reshape the economic landscape. Energy exporters tend to have higher iFDI stocks and this may play a role in changing economic orientations. Turkmenistan is the most radical example of how Chinese gas investments boosted iFDI and created a new and exclusive trade rela- tionship in less than a decade (in 2017 83.6% of Turkmen exports went to China, and the Russian share in its foreign trade was 3.7%). However, in the case of the other countries, there are no convincing indications that iFDI influences trade and interconnects the subjects.
6.4 THE EURASIAN ECONOMIC UNION AND ITS POTENTIAL CHALLENGERS – THE EU AND CHINA
The Eurasian Economic Union (EAEU) is a grand project to reintegrate certain regional countries, replaying the EU integration roadmap. It cur- rently has five members – Russia, Belarus, Kazakhstan, Kyrgyzstan and Armenia. In 2010 the three former countries ‘recreated’ the customs un- ion, and in 2015 they established the Eurasian Economic Union, formally introducing the common market with the ‘four freedoms’ (movement of goods, capital, services and labour) within it. The Union aims to abolish administrative and non-tariff barriers from trade and other movements, creating a single market by 2025.
1997–00 2001–04 2005–08 2009–12 2013–16
Azerbaijan 330.0 667.1 1,050.4 951.1 2,079.6
Armenia 92.3 254.9 793.7 1,571.6 1,551.0
Belarus 107.0 178.9 425.7 1,211.6 1,878.9
Georgia 111.8 285.2 1,030.3 2,121.9 3,185.0
Kazakhstan 494.1 1,129.8 2,575.9 5,787.0 7,260.4
Kyrgyzstan 78.0 100.2 179.0 371.0 703.0
Moldova 71.9 164.3 409.9 763.3 877.0
Russian Federation 126.8 577.2 1,995.6 2,930.8 2,446.2
Tajikistan 17.7 30.5 67.1 164.6 232.0
Turkmenistan 174.5 329.6 760.7 2,948.0 5,549.3
Ukraine 60.8 146.6 677.2 1,218.6 1,194.5
Uzbekistan 22.7 36.2 73.8 210.8 293.7
Post-Soviet average (12) 140.6 325.0 836.6 1,687.5 2,270.9 New EU-member average (11) 898.3 2,326.6 5,720.8 7,408.0 7,828.9 Baltic states average (3) 866.8 2,360.2 5,899.7 7,648.1 9,413.9 Table 5: Inward FDI stock per capita levels for the post-Soviet countries, 1997–2016, USD Source: UNCTAD FDI Statistical Database
There are several doubts regarding the future of the EAEU, addressed in greater detail in Part One. The weightiest argument concerns the fate of the Eurasian Economic Community (EurAsEc) between 2000 and 2010, which ended in total disarray. This was due to the fact that the EurAsEc applied the Russian tariff regime as the common external tariff, which was significantly higher than those in many other member countries. Hence, the EurAsEc raised significant barriers in and caused trade diversion from Central Asian states to Russia. At the same time, given the CIS free- trade arrangements, EurAsEc members could enter each others’ market even before, providing no extra benefit for non-Russian producers from the customs union. Consequently, EurAsEc members did not apply the common tariff regime at their external borders in full but only selectively, causing a chain of trade wars within the region and ending up preserving internal customs practices.
The failure was instructive when establishing the EAEU. Obviously, Russia had to offer the other EAEU members some preferential access to its markets. This has been achieved by making three modifications. First, while the Russian tariff regime was taken as the basis for common external tariffs again, Moscow joined the WTO in 2012. This reduces unweighted (weighted) average tariffs, and common tariffs will decrease accordingly from 11.5% (13%) in 2011 to 7.9% (5.8%) by 2020. Consequently, even if tariffs may have risen moderately since 2015 for Kazakhstan, Armenia and Kyrgyzstan, by 2020 they will erode back close to their former national levels. In this regard, the region remains on the path of economic opening.
Second, the abolishment of non-tariff barriers is far more important than the decrease in the already diminishing customs tariffs. According to surveys and an econometric analysis conducted by the Centre for Integration Studies of the Eurasian Development Bank in 2015, non-tar- iff barriers amounted to 39.8% ad valorem in Kazakh exports to Belarus, 14% of the value of its exports to Russia. Lower, but dimensionally similar values were published for other directions.9 The bulk of the trade dis- putes since 2015 have been related to these non-tariff barriers, primarily referring to different technical, sanitary and phytosanitary standards.
Enhancing access to the Russian market would compensate for the tem- porary Kazakh, Kyrgyz, and Armenian loss on the tariff issue and provide them with long-term advantages. The major problem here is that the ef- fective Soviet system of standards (GOST) stipulates mandatory technical regulations, while the WTO’s agreements apply SPS and TBT regulatory mechanisms, based on much more flexible voluntary principles. Most of the regional countries, including Russia, Kazakhstan and Belarus accepted
9 Vinokurov et al. 2015.
legislation calling for adherence to the EU’s SPS regulations. This would eliminate many of the current health and safety standard problems and enhance competitiveness both within the EAEU and outside. At the same time, the conversion is proceeding slowly and the establishment of the EAEU has created new problems, raising the issue of harmonization be- tween the five members. Another option in order to speed up standardiza- tion would be the use of mutual recognition agreements (MRAs) regarding each other’s mandatory technical regulations. As the example of the EU shows, both of these practices may take decades, perhaps even between entities sharing a common past.10
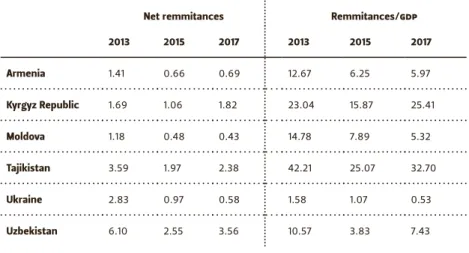
The third issue among Russia’s economic offer is the broadening of the customs union to a common market with four freedoms. Obviously, these issues and the related risks were the major short-term motiva- tions for some countries, most notably for Kyrgyzstan and Armenia to enter the EAEU. Given that the EAEU provides free movement of labour for members’ citizens, both countries received legal guarantees of free work migration to Russia and Kazakhstan. As Table 6 shows, remittances from Russia make a considerable contribution to local GDPs in the case of Armenia, Moldova and Uzbekistan, while they are essential constituencies in Kyrgyzstan and Tajikistan. Those who joined the EAEU are equipped with some legal guarantees that these transfers remain largely free of labour force regulations.
10 Tarr 2016.
Table 6: Net remittances from Russia and their share in the respective GDPs of post-Soviet countries, 2013–17, bln USD, %
Source: IMF, CBR
Net remmitances Remmitances/GDP
2013 2015 2017 2013 2015 2017
Armenia 1.41 0.66 0.69 12.67 6.25 5.97
Kyrgyz Republic 1.69 1.06 1.82 23.04 15.87 25.41
Moldova 1.18 0.48 0.43 14.78 7.89 5.32
Tajikistan 3.59 1.97 2.38 42.21 25.07 32.70
Ukraine 2.83 0.97 0.58 1.58 1.07 0.53
Uzbekistan 6.10 2.55 3.56 10.57 3.83 7.43
With the exception of Russia, the EAEU amounts to the integration of the more interdependent countries within the CIS. Nonetheless, its integration levels remain far below the indicators of the European Union.
In 2013, only three countries within the EU had more non-EU trade than intra-EU turnover (the UK, Malta and Greece), and the average share of intra-EU trade was 62%. At the same time, as can be seen in Table 3, only the Tajik and Belarusian intra-CIS trade levels exceeded 50% in 2016, and a major proportion of the respective national economic interests lay outside the CIS or EAEU. Hence, the EU may be a false benchmark both regarding expectations and as a future model for development.
There have been two major enhancers of EAEU progress to date. First, the formation of the EAEU went hand-in-hand with liberalization and global economic integration efforts. Russia’s WTO accession was a major game changer in the odyssey of post-Soviet economic integrations, while the future conformity with WTO/EU SPS standards would also mark a step towards the global competitiveness of local industries. Hence, if the EAEU were to become a facilitator of regional liberalization and potentially add some extras within its borders, it could preserve its role as a sizeable institutional entity in Eurasia. This effort has been further underlined by the recent EAEU trade policy offensive and conclusion of a free trade agreement with Vietnam, another cooperation agreement with China, and attempts to sign similar treaties with Iran and Serbia. Putin also offered free trade agreements to a number of partners in the name of the EAEU, such as Turkey and the EU. These measures and declarations to a great extent aim to broaden recognition of the EAEU and raise its pres- tige. Consequently, their substantive parts have to be viewed with some caution at this point, and all the more so when considering that trade liberalization goes against Moscow’s current turn towards import sub- stitution and protectionism. This may also become a major challenge for the EAEU. Theoretically, Moscow cannot raise its customs tariffs so easily because of its WTO and EAEU membership. Nonetheless, the protectionist stance may endanger the implementation of past EAEU commitments re- garding trade facilitation or could make this process much more complex vis-à-vis other members.
The negative results of Moscow’s protectionism can be counter-bal- anced by the EAEU’s other enhancer, through access to the relatively big Russian market and even more importantly to Moscow’s concessions and subsidies. In this regard, the EAEU can also be seen as a quasi-Comecon,11
11 The Council for Mutual Economic Assistance (Comecon) was an economic organization that existed between 1949 and 1991, established by the Soviet Union and the Eastern Bloc countries. While Comecon functioned as a way of dismantling Western economic influence within the Soviet Bloc, the Eastern European communist countries often used it as a channel for requesting additional Soviet aid and economic concessions.
where the major rationale for member countries is to establish an en- hanced dialogue with Russia and monetize its goodwill. This happens on a permanent basis with Armenia and Belarus, which receive low-price energy. Moscow also pledged development aid and preferential invest- ments to Kyrgyzstan, and maintains security guarantees and access to the arms market in the case of Armenia.
Despite all of these dedicated efforts on the part of Russia, past expe- riences show that an integration trajectory cannot be maintained beyond certain limits by relying exclusively on ad hoc subsidies and sectoral co- operation. In this regard, the future of the EAEU lies in the abolishment of trade and other barriers and the member states’ adherence to the rules. In this respect, the Russian ‘counter-sanctions’ since 2014 on a wide range of agricultural and food products from Western countries posed a major test. None of the member states joined the ban. This goes against the common trade policy principle, according to which all similar decisions should be taken at the EAEU level. Legally, the problem can be resolved by strictly applying the rules of origin agreement concluded within the CIS and in force in all EAEU countries. At the same time, local exporters in Belarus and potentially in other member countries slipped through these loopholes and re-exported Western products to Russia as domestic ones. Moscow had to react with the same technical and sanitary measures, repeating the problems that had arisen with the EurAsEc.
The analysis of EAEU achievements in the last three years is further complicated by the major economic fluctuations caused by the 2014 cri- sis in Ukraine, sanctions, and the drop in the oil price.12 Nonetheless, one of the major issues concerning measurement relates to the way in which the EAEU rearranges the regional ties with alternative centres of econom- ic gravity. On the Western frontier, the EU and its neighbourhood policy posed a challenge to Russian reintegration efforts, while in Central Asia China has become a huge magnet. Besides the EAEU, approximation to these economic entities is the driver that could change the post-Soviet inertia and may have a decisive role in the future of the region.
12 Vinokurov (2017) provides a positive assessment for the first couple of years.
1995 1997 1999 2001 2003 2005 2007 2009 2011 2013 2015 2017
Georgia
CIS 40.2 38.6 39.2 37.1 37.0 41.8 35.9 30.4 32.4 34.7 29.6 32.8 EU 18.8 19.7 22.8 25.3 28.6 23.6 28.0 27.9 26.7 26.3 28.7 26.7
Moldova
CIS n/a 59.3 47.2 47.0 46.4 43.0 37.4 35.8 35.5 32.8 25.4 23.0 EU n/a 31.1 43.9 42.1 42.9 43.8 46.9 45.8 45.1 45.6 53.3 54.9
Ukraine*
CIS n/a 49.1 42.5 42.0 37.8 39.1 39.6 39.0 42.0 35.6 24.2 19.8 EU n/a 27.9 30.4 32.1 36.0 32.0 33.0 29.3 29.0 31.2 37.5 41.3 Table 7: EU and CIS shares in Georgian, Moldovan and Ukrainian foreign trade, 1995–2017, %
Source: National statistical providers
* Ukrainian data after 2014 excludes Crimea and the conflict zones of Eastern Ukraine
As shown in Table 7, in the case of the three EU DCFTA countries, CIS- EU competition tends to be in favour of the European Union. CIS shares from total foreign trade fell in all three cases and these decreases were intense, especially in Moldova and Ukraine after 2014. The EU grew in importance, although this was expected and partly the result of its en- largement from EU15 to EU28. In the case of Moldova, one can speak about some sort of European orientation, albeit in a highly peripheral role. This was the only country out of the three EaP states that could compensate for the loss of its CIS trade in the European markets.
In the case of Georgia and Ukraine, the combined CIS and EU shares cover only around 60% of total foreign trade, painting a more fragmented picture without clear trade policy profiles. Paradoxically, Georgian ex- ports to the CIS grew substantially after Tbilisi exited the organization in 2010. Given this setup, it is highly questionable as to what kind of benefits strict adherence to the EU acquis may provide if less than 24% of Georgian exports go to the Union. The case of Ukraine cannot be separated from its conflict with Russia and loss of major industrial centres. Foreign trade statistics between 2013 and 2017 very tellingly reflect these changes. It remains to be seen how the country will overcome the shock and whether it can enter the European markets in the longer run.
Nonetheless, all three countries would need decades of robust growth and catching up in order to enhance economic convergence with the EU.
Unfortunately, there is little evidence that economic development could be maintained in a macroeconomically stable manner. Without such de- velopment, these countries may be stuck with their current status. Free trade with the EU without improving local competitiveness may have where the major rationale for member countries is to establish an en-
hanced dialogue with Russia and monetize its goodwill. This happens on a permanent basis with Armenia and Belarus, which receive low-price energy. Moscow also pledged development aid and preferential invest- ments to Kyrgyzstan, and maintains security guarantees and access to the arms market in the case of Armenia.
Despite all of these dedicated efforts on the part of Russia, past expe- riences show that an integration trajectory cannot be maintained beyond certain limits by relying exclusively on ad hoc subsidies and sectoral co- operation. In this regard, the future of the EAEU lies in the abolishment of trade and other barriers and the member states’ adherence to the rules. In this respect, the Russian ‘counter-sanctions’ since 2014 on a wide range of agricultural and food products from Western countries posed a major test. None of the member states joined the ban. This goes against the common trade policy principle, according to which all similar decisions should be taken at the EAEU level. Legally, the problem can be resolved by strictly applying the rules of origin agreement concluded within the CIS and in force in all EAEU countries. At the same time, local exporters in Belarus and potentially in other member countries slipped through these loopholes and re-exported Western products to Russia as domestic ones. Moscow had to react with the same technical and sanitary measures, repeating the problems that had arisen with the EurAsEc.
The analysis of EAEU achievements in the last three years is further complicated by the major economic fluctuations caused by the 2014 cri- sis in Ukraine, sanctions, and the drop in the oil price.12 Nonetheless, one of the major issues concerning measurement relates to the way in which the EAEU rearranges the regional ties with alternative centres of econom- ic gravity. On the Western frontier, the EU and its neighbourhood policy posed a challenge to Russian reintegration efforts, while in Central Asia China has become a huge magnet. Besides the EAEU, approximation to these economic entities is the driver that could change the post-Soviet inertia and may have a decisive role in the future of the region.
12 Vinokurov (2017) provides a positive assessment for the first couple of years.
1995 1997 1999 2001 2003 2005 2007 2009 2011 2013 2015 2017
Georgia
CIS 40.2 38.6 39.2 37.1 37.0 41.8 35.9 30.4 32.4 34.7 29.6 32.8 EU 18.8 19.7 22.8 25.3 28.6 23.6 28.0 27.9 26.7 26.3 28.7 26.7
Moldova
CIS n/a 59.3 47.2 47.0 46.4 43.0 37.4 35.8 35.5 32.8 25.4 23.0 EU n/a 31.1 43.9 42.1 42.9 43.8 46.9 45.8 45.1 45.6 53.3 54.9
Ukraine*
CIS n/a 49.1 42.5 42.0 37.8 39.1 39.6 39.0 42.0 35.6 24.2 19.8 EU n/a 27.9 30.4 32.1 36.0 32.0 33.0 29.3 29.0 31.2 37.5 41.3 Table 7: EU and CIS shares in Georgian, Moldovan and Ukrainian foreign trade, 1995–2017, %
Source: National statistical providers
* Ukrainian data after 2014 excludes Crimea and the conflict zones of Eastern Ukraine
disadvantageous effects and could fall short of society’s expectations. In such an environment, nostalgia for Soviet markets would remain a basic ideological and economic asset in the hands of Moscow, permanently challenging the adherence and integrity of institutional ties with the EU.
Optimally, the EU and CIS market segments are complementary and can diversify local exports substantially. The CIS still represents markets for declining industrial sectors, especially in the Ukrainian case, can absorb agricultural and food surpluses from Georgia and Moldova, and may serve as a stepping stone for entering the post-Soviet space for EU investors in light industry or some manufacturing branches. Meanwhile, EU markets may save local economies from pro-cyclical crises stemming from Russia and still sweeping through the whole region, as happened in 1998 and 2014. Hence, the rivalry between Russia and the EU and the strict and short-term optionality between the EAEU and EU DCFTA was rather damaging from the economic point of view.
The coexistence of China and CIS/Russia in Central Asia has been sof- tened by the lack of solid institutional optionality. While Moscow actively propagates the EAEU among these countries, China has not elaborated a similar integration pattern, and economic relations largely remain at the bilateral level. At the same time, the lack of visible conflicts masks an even more rapidly changing landscape and shifts in economic orien- tations. As depicted in Table 8, China is a major trade partner in these countries, and became the biggest by far in Kyrgyzstan, Tajikistan and Turkmenistan. Chinese influence is not restricted to trade, however: it actively seeks access to local energy resources, invests in related sectors, acquires ownership through local value chains, especially in retail or light industry, and provides loans and infrastructure construction capabilities under the label of the Belt and Road Initiative.
Table 8: The foreign trade of Central Asian countries with China and the CIS, 2016, bln USD, %13 Source: CISStat, Observatory of Economic Complexity
Kazakhstan Kyrgyzstan Tajikistan Turkmenistan Uzbekistan
Total (bln USD) 62.11 5.57 3.93 11.83 24.31
CIS (%) 28.5 42.26 50.08 n/a 34.81
China (%) 13.62 48.48 44.79 45.04 14.52
13 Data from this region is highly contradictory, especially as far as Tajik, Kyrgyz and Uzbek providers are concerned. This might be partly due to the different registration of product flows for statistical and customs purposes. It is particularly true for Kyrgyz and Uzbek gold and precious metal ore exports, providing up to 40% of the respective flows.
The Chinese influence in the region has general characteristics similar to those of its penetration in Africa and Latin America. Beijing is success- ful in engaging smaller and more vulnerable subjects. As far as the two smaller Central Asian countries are concerned, suffice it to say that China produces their respective annual GDP in less than six hours. The loyalty of the local elites can be bought relatively easily and even the smallest offers in terms of development aid can boost these countries substantially.
The landscape becomes more balanced due to the more diversified ex- ternal relations of the two regional majors, Kazakhstan and Uzbekistan. In Kazakhstan, China’s role has been growing much more gradually than in the other cases. The reasons for this are manifold. Kazakh oil reserves lie in the Western part of the country, in the Caspian Basin, very far away from Chinese industrial centres. Furthermore, the Kazakh oil industry had been largely established and consolidated by the start of Chinese engagement in the mid-2000s. Moreover, the Kazakh leadership pursues a multi-vector foreign and foreign economic policy, where Chinese investments could have only a limited role. Accordingly, Chinese FDI amounted to only 14.8 bln USD (around 7% of the total, or around 10% if Hong Kong is added), primarily concentrated in transportation, mining and finances. In the case of Uzbekistan, the country remained closed and hardly accessible for any foreign investments and with little export potential. The former feature may change due to the rotation in the presidential position, if it were accompanied by some change in economic policy.
What is Russia’s stake, and how does the EAEU relate to the challenges posed by the EU and China in the respective regions? It is widely believed that the EAEU confronts Western and Chinese penetration in different ways in the member states. This has been achieved by mutually exclusive integration projects between the EU and EAEU and underlined by Russia’s deliberate efforts to articulate the EAEU’s position regarding Beijing’s initiatives. The member states try to retain their autonomy in external economic policy as far as possible: Armenia signed a Comprehensive and Enhanced Partnership Agreement with the EU in February 2017, and Astana objected to premature Russian statements on several occasions in the name of the EAEU and demonstratively expressed its wish to maintain its independence within the legal frames. Multi-vector reflexes are also present on the other side: in May 2018 the Moldovan president successfully applied for observer status within the EAEU.14
From a more analytical angle, Moscow’s challenge is much more complex. First, it has to deliver on its past pledges and abolish trade barriers within the EAEU. The fate of EurAsEc permanently haunts the
14 The status of this action remains unclear since it needs internal approval and implementation by other constitutional entities.
EAEU initiative and if the project fails to provide some benefits for the parties, its erosion will be inevitable. Moscow’s rush for international entrenchment of the EAEU, and the attempts to push for recognition in the EU and globally have been made in part to prepare for these negative outcomes. Second, Russia also has to take a position in the liberalization/
protectionism dilemma. At this point, it still seems to be easier to keep the EAEU together with a moderate liberalization agenda. The experienc- es with Russian counter-sanctions, with partners taking considerable distance from Moscow, are highly indicative in this regard. The problem in this respect is that an opening up of the economy has become the less favourable choice in Moscow.
Third, and most importantly, Russia will represent its own economic interests within the EAEU and regarding CIS countries. As Table 9 shows, the CIS countries’ share has been decreasing consistently and substan- tially in the last decade. The CIS region provides roughly just one-tenth of Russian foreign trade and minuscule proportions of FDI. This is in sharp contrast to Russian foreign policy priorities, where the region is designated as the most important area of Moscow’s interests. While the Kremlin certainly channels significant funds for these objectives, and
Table 9: Russian exports to and imports from major regions of the world, 2005–17, mln USD, % Source: Russian customs statistics
Exports 2005 2007 2009 2011 2013 2015 2017
Total (mln USD) 241,451.7 351,928.2 301,666.5 516,480.9 525,976.3 343,511.8 357,766.8
CIS (%) 13.5 15 15.5 15.4 14.1 13.1 13.4
EU (%) 55.2 55.7 53.3 51.6 537 48.2 44.6
APEC (%) 12.4 12.2 15 17.9 18.9 22.8 24.1
Imports 2005 2007 2009 2011 2013 2015 2017
Total (mln USD) 98,707.5 199,753.1 167,348 305,604.5 315,297.5 182,902.3 227,464.2
CIS (%) 19.2 15 13 14.7 12.4 11.6 10.9
EU (%) 44.2 43.7 45.1 41.7 42.6 38.4 38.2
APEC (%) 25.6 31.9 30.9 33.8 34.6 37.9 40.3
state companies may sidetrack their normal business activities, limits are imposed. Hence, it is reasonable to say that CIS and EAEU policies cannot stray too far from mainstream foreign economic policies and definite- ly cannot contradict them for a prolonged period of time. In the event of conflicts, Moscow will likely not harm its own business groups and self-serving interests. Russian foreign policy has to be adapted to struc- tural economic processes from time to time.
6.5 CONCLUSION
The forms of economic integration in the post-Soviet states are relative- ly low. At the current stage, the common market, represented by the EAEU, is ‘state of the art’ regional integration, with reasonable doubts regarding its future potential and capabilities. At the same time, the al- ternative integrative mechanisms in the region are also rather humble:
the EU offers its Eastern partners free trade with legal approximation. The former is definitely loose cooperation in the age of global liberalization of trade, while implementation of the latter certainly exceeds local capacities.
China does not try to integrate regional countries, but establishes bilateral ties and acts according to its interests. Chinese influence transforms the regional balance without harbouring transformative ambitions. In such a landscape Russia can maintain some of its economic leverage given its relative strength because of the lack of competition.
No swift change is to be expected in these respects. The post-Soviet region has a sui generis integrability problem. Political elites are inter- twined with local businesses, corruption is rampant, the regional average TI Corruption Perception Index ranking is 123 out of 180, with all regional countries above 100 apart from Georgia and Belarus. Foreign companies enter the region in order to access its resources and tap local demand, but not in order to set up complex value chains and establish produc- tion capacities with high human added value. The gradual erosion of the region’s weight in the global economy, the low competitiveness, and all the concerns regarding the decline of local processing industries are clear indications of this trend. The region will likely also reach its limitations of extensive growth in hydrocarbon production in the coming decade. The end of this megatrend, stretching from the 1960s through the collapse of the Soviet Union until today, may serve as the last wake-up call for local economic policies.
Given the lack of development drivers and complex, vertically inte- grated value chains, the local economies provide little complementarity
for strong integration. They remain rent-seeking systems based on some sectoral cultures and their export potential. In such an environment, economic integration may prove useful, but limited in its scope. As the experience of APEC demonstrated, economic cooperation is possible on the basis of a system of dense bilateralism, without supranational integra- tion mechanisms. The move away from multilateralism could be further accentuated by the current shift in the region’s economic focus towards the Asia-Pacific region.
This might change the standard business culture and economic behav- iour of the region and Russia. Currently, much of the post-Soviet region distances itself from Europe in terms of foreign trade, FDI, and economic cooperation. Russian and Central Asian business cultures more closely resemble those in the Asia-Pacific region, where political ramifications are still important for business, megadeals with complex verticalities are present, state companies provide the negotiation benchmarks and business goes beyond economics. In this regard, the current regional business cultures may remain as they are, with no change from outside to be expected.