DOKTORAL (PhD) THESIS
ÉVA POGÁNY
MOSONMAGYARÓVÁR 2011
1
UNIVERSITY OF WEST-HUNGARY
FACULTY OF AGRICULTURAL AND FOOD SCIENCES INSTITUT OF ECONOMIC SCIENCES
MOSONMAGYARÓVÁR
Programme leader: scientific leader:
DR. BENEDEK PÁL DR. TENK ANTAL
university professor professor emeritus
doctor of the Hungarian candidate of agric. sciences Academy of Sciences
IMPACT OF HUNGARY’S EU MEMBERSHIP ON THE PROFITABILIY OF MILK AND PORK PRODUCTION OF THE FARMS IN THE WEST-TRANSDANUBIAN REGION
Prepared by:
POGÁNY ÉVA
MOSONMAGYARÓVÁR 2011
1. MAIN OBJECTIVES AND HYPTHESIS OF THE RESEARCH WORK
The continuous yield reduction in the two most important production branches of Hungary’s animal husbandry (cattle and swine), which started in 1990, could not have been stopped during the years after Hungary’s joining the European Union in 2004. During the past 6 years not only the animal stock has greatly reduced, but the quantity of the fabricated products and the income of the farmers, too.
By the end of the decade especially the situation of the swine branch got into a critical situation. Many swine farmers give up production and the swine stock fell to the level after WWII. The situation of the milk producers has not improved much yet. Despite the milk quota system the majority of the dairy farmers have run their farm with losses.
The generally bad picture of the situation has been slightly refined by the fact that a part of the farms dealing with milk production and pig fattening in the West-Hungarian region has lately run the farm profitably in spite of the worsening economic environment. The reason is that their production level is better than the average and their keeping and feeding systems are more effective.
Setting the objectives of the research work we chose the date of 1st May 2004, Hungary’s joining the European Union as a starting point. Hungary’s EU-membership and the regulations of the relevant common agricultural policy created a new situation for the domestic agricultural producers. One of the determining factors of these
3
regulations is supporting the production, but they also consider the farmers’ interest and improving their competition chances. To start with one of the objectives of the research work was to investigate:
how did EU regulations influence the cow stock and milk production at national level in the period of 2004-2009?
The first hypothesis of research (H1) is connected to this target, namely: the reduction in the domestic cow stock and produced milk quantity that has been continuous since 1989, the year of the political transition. Hungary’s EU-membership in 2004 could moderate it but it was not able to stop it. – At the time of Hungary’s joining the EU the allocated milk quota system for the domestic dairy branch did not mean any restrictions neither for the whole branch nor for the individual dairy farmers during past decade.
But the quota support attached to the milk quota system has only partly compensated the income loss induced by increasing production costs since our EU-membership started.
The other target of the investigations towards the situation of the dairy branch is to show the costs-benefit ratio in the dairy farms of the West-Hungarian region in the period after Hungary’s joining the EU and what were the influencing factors like? The basic aim of these investigations was to determine the level of influence of the new regulations on the results of the dairy farms of different size and production level.
The second hypothesis of research (H2): Despite the generally worsening situation (reduction in the number of animals, in milk production, in incomes and competitiveness) in the dairy branch
4
since the political transition there are dairy farms in the country and in the region as well that can run their farm profitably and are competitive on the milk market, although their profitability has considerably reduced during the past 2-3 years.
The third target of the research in the milk branch is to show the role of the support connected to the milk quota in the results of the branch.
Hypothesis connected to this research objective (H3):
because of the continuous increase in the milk productions costs and the hectic milk producer prices (especially low in the past year) the branch result is greatly influenced by supplementary revenues (growing year by year) that complete the prices. Without them much more farms would go bankrupt and would give up milk production.
The other field of research covers the pork branch. The participants involved are in a more serious situation than that of the dairy branch.
The primary aim of research on the pork branch is to show the changes in the number of animals, the yield of production and the cost-benefit-ratio of pork production at national and regional level since Hungary’s joining the European Union. Relevant hypothesis (H4): despite the temporary consolidation during the years 2005-2006 Hungary’s EU- membership could not stop the continuous deterioration of the branch’s performance. The profitability of meat producing farms with performance indices better than the average could not have been rendered.
5
Secondary aim of research on the fattening branch is to compare the results of 11 traditional and industrialized (integrated) systems of production in the West-Transdanubian region in order to show the influence of the different factors.
Relevant hypothesis (H5) means: Despite the worsening situation in the pork producing branch (number of animals, reduction in meat production and profitability) there are farms where the level of production indices and the efficiency of production is much higher than the national average. As a result of their high level of production system (e.g. integrated system of production) they are able to produce profitably for a log period.
The third aim of research on pork production is to determine the parameters that produce the difference in the results of farms of different production systems (traditional and industrialized). Relevant hypothesis (H6): the effect of higher level system can be observed in the results of the two groups of farms (natural indices of performance, labour profitability, return on assets) and as their mutual effect on the profitability of the branch.
In the last phase of the research work we aimed to prepare a vision of future for both branches regarding the possible changes and their impacts to be expected during the coming years.
6
2. MATERIAL AND METHOD
Basic research work was carried out at the Department of Agricultural Economics and Marketing of the Institute for Economic Sciences at the University of West-Hungary during the years 2005-2009.
According to the objectives as set in the introduction investigations covered three levels: at national level: using secondary data it investigated the changes in the primary material produce of dairy and pork branches (number of animals, production volume, cost- yield and cost-benefit-ratio) since Hungary’s joining the European Union. Data required for the investigations and assessments were obtained from the Hungarian Central Statistical Office (further on:
KSH), Agricultural Economic Research Institute (further on: AKI), the Commodity Council (milk and meat), the National Federation of Agricultural Cooperatives and Producers (further on: MOSZ), Statistical Office of the European Communities (further on:
EUROSTAT).
At regional level we used the method of own calculations based on the number of animals and volume of production of the two branches in three counties of the West-Hungarian Region (Gyır- Moson-Sopron, Vas and Zala). We used the data (breakdown by the counties and summarized by the regions) available at the County Offices of KSH, at MOSZ, a Commodity Councils, and at the Ministry of Agriculture and Rural Development (further on: FVM).
Since there has been no official data available about the conditions of
7
cost-yield and cost-benefit-ratio and their periodical changes, we must rely on topic relevant scientific publications (doctoral thesis) from the period before Hungary’s joining the European Union (2004), as they offer a good basis to demonstrate the changes.
At farm-level we managed to collect primary data from several years of dairy or pig fattening farms in both branches in the West-Hungarian Region. For the sake of this survey we prepared branch specific QUESTIONNAIRES (see attachment). According to our set objectives and based on the primary data we were able to carry out overall farm level analysis and to compare them at regional and national level.
From a didactical point of view we investigated the two branches at national level using the data from different sources in the first phase of the data processing period (comparative analysis). So we could learn about the general tendencies of changes. During this investigation we could mainly rely on series of data published yearly by KSH (about numbers of animals, production data, distribution of farms etc.) Data on production costs, purchase price and revenues derive from professional studies prepared by AKI containing pilot farm data basis and overall calculations. The research work, covering 10 years (2000-2009), aims to obtain different indices, tendency parameters and interrelations (correlation, regression) with the use of statistical methods.
Analysis serving comparisons at national, regional and general levels - mostly based on primary data– were completed by the data
8
collected during long-range investigations in the dairy and fattening farms during the years 2004-2009.
Putting the questions for the questionnaire interviews to meet the aims of the thesis and later on during the data evaluation we went for selecting methods that make the results relevant with the national and regional indices. As a result we will be able to make general conclusions on the basis of parameters gained upon the primary data.
We used the configurations of Microsoft Office Excel 2003 to process the data and to prepare the diagrams.
9 3. RESULTS
3.1. Dairy branch
According to an evaluation prepared by AKI in 2005 the performance of the branch definitely worsened in the first year of Hungary’s EU-membership. One of the reasons is the reduction of milk purchase price in 2004 and the cancelation of the national subsidies from 1st of May forward. Although very favourable crop production yields (fodder crops) and expenditures slightly compensated the unfavourable effects the returns per one litre milk reduced by HUF 2 compared to the previous year.
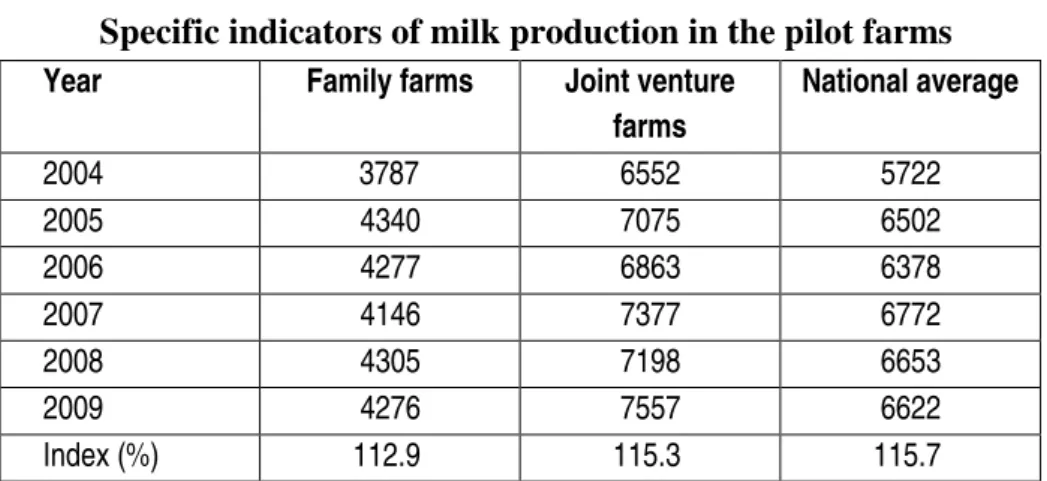
The continuously reducing number of cattle (within the milk cow stock) indicated that economic conditions, as well as cost-benefit- ratio were not beneficial for dairy farmers. Therefore we are going to demonstrate the cost-revenue ratio – based on AKI pilot farm data – of the dairy farms in the period of 2004-2009.
AKI pilot farm investigations basically distinguish two groups:
family (self-employed) and joint venture farms. The national average values were calculated upon the weighted values (Table 1).
10
Table 1 Specific indicators of milk production in the pilot farms Year Family farms Joint venture
farms
National average
2004 3787 6552 5722
2005 4340 7075 6502
2006 4277 6863 6378
2007 4146 7377 6772
2008 4305 7198 6653
2009 4276 7557 6622
Index (%) 112.9 115.3 115.7
Source: AKI Agrárgazdasági Információk. 2005/4; 2007/7; 2008/6.; 2010/10
As we can see specific milk yield of farms in both groups increased during the six years passed after the year of joining though their initial conditions were very different. It is very well to observe that joint venture farms represent very high production level even if compared to European values.
Comparing the figures published by AKI we can see that branch expenditures values of individual and joint venture farms greatly differ. Total costs per cow– at different rates per year –were 80% higher on average and fodder costs per cow were 50 % higher on average in joint venture farms. The difference in labour costs (250- 280%) were higher than that, which can be accounted for the fact that family farms do not put the labour costs for themselves and for their family members to account. Cost increase in milk production of joint venture farms amounted 18%, in fodder production 14% and 66% in labour costs during the 6 years. Fodder costs fluctuated in both groups between 45-50% within the total costs and it rarely exceeded 50%.
11
General costs (general expenses and general economic expenses together) represented a considerable ratio (12-15 %) in the joint venture farms.
On national average the total cost of milk production increased by 18%, fodder cost by 14% and labour costs at 60% during the 6 years after Hungary’s joining the EU. General costs represented 13%
of the total costs.
The production results of the branch were influenced by expenses expressed in money value on one side, and the quantity of outputs (i.e. its value) expressed in the value of produce and returns.
In joint venture farms – where the specific milk yield was 40- 45 %-higher – the realised returns on production were much lower than in the family farms. Despite the outranging indicators (total costs, production value and the prime costs of milk production per cow) they earned very high revenues due to the highest market price ever reached in the period of 6 years in 2008. Level of the revenues seemed to have been determined by the purchase price quotation more definitely than by the expenses.
Comparing the pilot farm data of AKI we can see that the national average data closely approached that of the joint venture farms, which means that joint venture farms have had a main role in this branch. This is valid for both the production volume and the cost- benefit-ratios and position in the market competition that features the whole branch (Figure 1).
12
Joint venture farms Family farms
-20 0 20 40 60 80 100
2004 2005 2006 2007 2008 2009 Önköltség Értékesítési ár Jövedelem
0 10 20 30 40 50 60 70 80 90
2004 2005 2006 2007 2008 2009 Önköltség Értékesítési ár Jövedelem
National average
0 10 20 30 40 50 60 70 80 90
2004 2005 2006 2007 2008 2009
Önköltség Értékesítési ár Jövedelem
Source: AKI Agrárgazdasági Információk 2005/42007/7; 2008/6; 2010/10.
Figure 1: Trends of primary costs – price – and revenues of milk production in different groups in the pilot farms (HUF/l)
It can be well seen on Figure 1 that there is no notable difference in the primary cost of milk production of the different groups although costs per cow differ greatly by both the family and the joint venture farms. The total costs are 80% higher, fodder cost 50% higher at joint venture farms, but labour costs may differ by 250% as well.
13
Differing from the primary costs there are much higher differences in purchase prices of milk (8-10 %). As a result family farms earn the highest revenues per litre milk among all of the producers. One reason is that family farms show gross income since they do not list wages, rates and taxes among their expenses, which could mean a sum of 10 Ft/l altogether.
Returns per one litre milk are obviously the best means to demonstrate the actual cost-benefit-ratio within the dairy branch. This alone could also be misleading then there is a specific difference in production of 3 thousand litres of milk between the two main groups of producers, which can easily compensate the lower specific income.
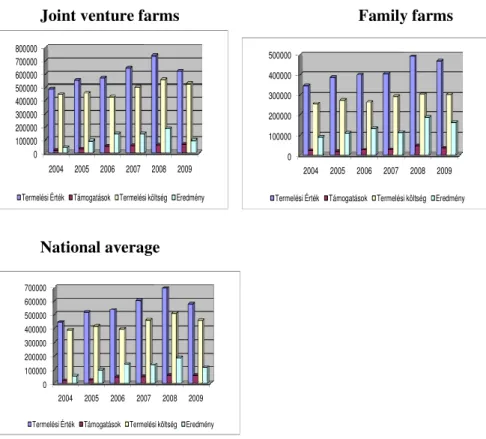
Dairy farms have further incomes and state (quota) subsidies for milk production get more and more important. In order to be able to evaluate the amount of revenues in the branch realistically we present the total costs and returns per cow and the branch performance as the difference in Figure 2.
14
Joint venture farms Family farms
0 100000 200000 300000 400000 500000 600000 700000 800000
2004 2005 2006 2007 2008 2009 Termelési Érték Támogatások Termelési költség Eredmény
0 100000 200000 300000 400000 500000
2004 2005 2006 2007 2008 2009 Termelési Érték Támogatások Termelési költség Eredmény
National average
0 100000 200000 300000 400000 500000 600000 700000
2004 2005 2006 2007 2008 2009
Termelési Érték Támogatások Termelési költség Eredmény
Source: AKI Agrárgazdasági Információk 2005/4; 2007/7; 2008/6; 2010/10.
Figure 2: Trend of revenues in different groups of producers in the dairy branch (HUF/cow)
In selecting the joint dairy farms in the West-Transdanubian region for the sake of primary investigations we intended to choose farms whose size and level of milk production can represent similar farms in the region and the country. We investigated the trend of the cost-revenue ratio in six dairy farms with questionnaire interviews. In the dairy farms involved into the investigations the number of cows was lower than 300 in two, between 300-600 in two, and above 1000
15
in two of the 6 dairy farms. The primary aim of the doctoral thesis was to investigate the factors influencing the revenue ratios of dairy farms in the region after Hungary’s joining the European Union. In order to background the investigations we collected the data from questionnaire interviews during the period of 2004-2008. There is no possibility to introduce the farms under their original names, therefore we use the letter “T” and the numbers ranging from 1-to 6 for the farms involved. All the six farms work in the form of a joint venture, four out of them (T1-T4) was formed from co-operative into Ltd., two (T5-T6) were formed from state farms into shareholders companies.
The total primary milk production costs are made up by fodder costs fodder costs of 55-60%, labour costs 12-15%, amortisation costs 6-10% and further expenditures 5-10% (vet, insurance, energy costs etc.). The increase of 25% in primary costs between 2004 and 2008 is the result of the continuous increase in fodder costs (about 80 %). The reason is that input costs of crop production (material, energy, wages) have increased year by year, followed by the fodder prices. Other expenses increase a bit more moderate and their weight is lower within the other costs comparatively.
Having the average milk purchase price per year we can calculate the revenues of milk production. (Table 2)
16
Table 2: Milk production revenues of dairy farms (average of the years 2004-2009)
unit: Ft/l
Item T1 T2 T3 T4 T5 T6
Purchase price 68,25 67,93 68,50 69,35 70,52 70,42 Primary costs 67,83 66,92 66,15 69,43 69,85 70,20
Revenues 0,42 1,01 2,35 -0,08 0,72 0,22
Source: own questionnaire interviews
Although the average values in Table 2 do not reflect properly the changes during the 6 years, but the available yearly data show that the tendency of the milk price increase – besides considerable yearly fluctuations – remains back behind of the increase in primary costs.
The dairy farms’ revenues of milk production differed greatly and were seriously fluctuating during the years 2004-2009. This fluctuation is closely connected to the development of the milk purchase price and its tendency correlates with those of the pilot farms’ data. During the last two years (2008-2009-ben) because of the continuously falling milk purchase prices every farm produced milk with losses, which could however be compensated by the increase of the quota support.
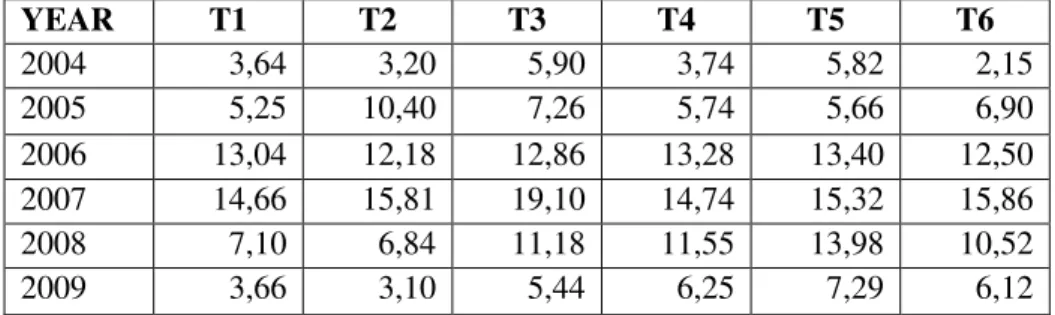
State subsidies increased from 3Ft/l in 2004 to 9Ft/l in 2009, which contributed to the fact that the dairy farms could manage without big losses during the years after Hungary’s joining the European Union. Considering these subsidies we can calculate the actual revenues of milk production (returns + subsidy), which is described in Table 3.
17 Table 3: Returns of milk production
Unit: Ft/l
YEAR T1 T2 T3 T4 T5 T6
2004 3,64 3,20 5,90 3,74 5,82 2,15
2005 5,25 10,40 7,26 5,74 5,66 6,90
2006 13,04 12,18 12,86 13,28 13,40 12,50
2007 14,66 15,81 19,10 14,74 15,32 15,86
2008 7,10 6,84 11,18 11,55 13,98 10,52
2009 3,66 3,10 5,44 6,25 7,29 6,12
Source: own questionnaire interviews
As we can see in Table 3 the revenues coming from milk production multiplied due to the subsidies during two out of the six years of investigations (2006-2007). During the last two years (especially in 2009) the returns from milk production was very poor, it actually dropped to the price level of 2004-2005, because of the drastic decrease (25 %) in the purchase price. The revenue ratio of the branch cannot be properly described by the returns per one litre milk, but the returns per cow show the actual ratio, which depends on the yearly milk performance of the cows. Table 4 shows these values.
Table 4: Specific indicators of milk production in the dairy farms unit.: Ft/cow
Year T1 T2 T3 T4 T5 T6
2004 18 557 18 874 34 881 30 114 47 805 16 529 2005 33 611 62 504 45 056 45 501 45 959 54 993 2006 88 907 69 024 83 101 107 170 111 019 97 625 2007 102 752 93 121 128 314 121 974 129 837 127 213 2008 52 689 41 772 73 732 97 482 127 442 85 549 2009 20 410 34 860 36 176 53 125 65 646 50 245 Source: own analysis of the farms’data
18
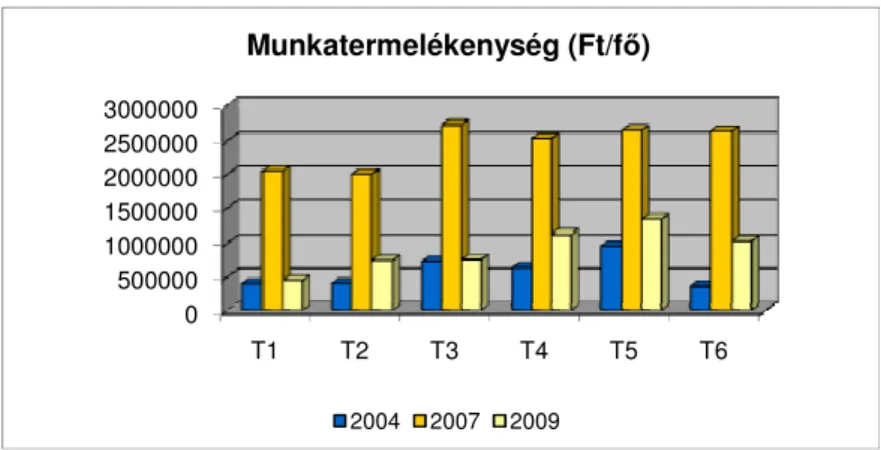
The two most important efficiency indicators of dairy farms were in the past years very different and continuously decreasing namely the work productivity and the cost efficiency indicators.
Figures 3 and 4 show the results calculated per dairy worker and 100 HUF total production costs starting with the year 2004 over the best year 2007 and until the closing year 2009. Besides the data of Table 8 we used the data of the total production costs and the average numbers of employees per year. Both efficiency indicators – but especially the work profitability indicator – were more favourable in dairy farms with higher specific yields (T4, T5, and T6), where the average milk yield amounted about 8-8.5 thousand litres.
0 500000 1000000 1500000 2000000 2500000 3000000
T1 T2 T3 T4 T5 T6
Munkatermelékenység (Ft/fı)
2004 2007 2009
Source: own diagram prepared from farms’data
Figure 3: Work productivity indicators of dairy farms
19
0 5 10 15 20 25 30
T1 T2 T3 T4 T5 T6
Költséghatékonyság (Ft/100Ft)
2004 2007 2009
Source: own diagram prepared from farms’ data
Figure 4: Cost efficiency indicators 3.2. Fattening pig branch
Hungary’s joining the European Union created a new – much worse– situation. As a result the pig stock started to decrease since 2004 rapidly and during the past 6 years the pig stock has reduced by one million (Fig. 5).
0 1000 2000 3000 4000 5000
2004 2005 2006 2007 2008 2009 2010*
Összes sertés Ebbıl: koca
Source: own diagram based on KSH annuals,
Figure 5: Trends in the domestic pig stock (2004-2010) (in Thousands)
20
We are going to show the cost-revenue trend – similar to milk production – based on the AKI pilot farm data during the period of 2004-2009.
Years after Hungary’s EU-joining are featured by the continuously rising production costs besides greatly fluctuating purchase prices. Joint venture farms – with considerable concentrations during the past six years – produce a growing rate of primary material and have the most favourable market position (mass production, consistent quality, higher natural efficiency etc.).
Production costs of meat-type pigs greatly depend on the keeping costs and the natural performance of the sows. We introduce the trend of costs and benefit of sow keeping in Figure 6.
-50 000 0 50 000 100 000 150 000 200 000
2004 2005 2006 2007 2008 2009 Termelési érték Termelési költség Ágazati eredmény
Source: own diagram based on AKI Agrárgazdasági Információk 2005/4;
2007/7; 2008/6; 2010/10.
Figure 6: Costs-benefit-ratio of sow keeping at joint venture farms
21
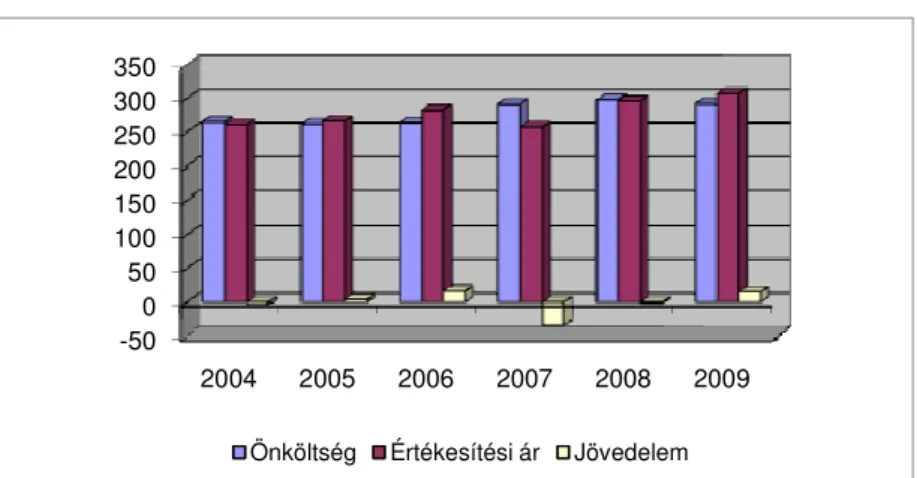
Animal feed costs have the highest rate (45-50 %) in the current costs of pig fattening, out of them purchased animal feed accounts for about 60 %. Important cost factors are overhead costs, labour costs with tax and rates, as well as amortisation.
The cost-benefit ratio of meat-type pig production is determined by the cost price of pork and the purchase price of live pigs. We can see in the figure the both the costs and the purchase prices show fluctuations from one year to the other that put the production and the producers into an uncertain situation (Figure 7).
-50 0 50 100 150 200 250 300 350
2004 2005 2006 2007 2008 2009 Önköltség Értékesítési ár Jövedelem
Source: own diagram based on AKI Agrárgazdasági Információk 2005/4;
2007/7; 2008/6; 2010/10.
Figure 7: Cost-benefit trends of meat-type pig production at joint venture farms
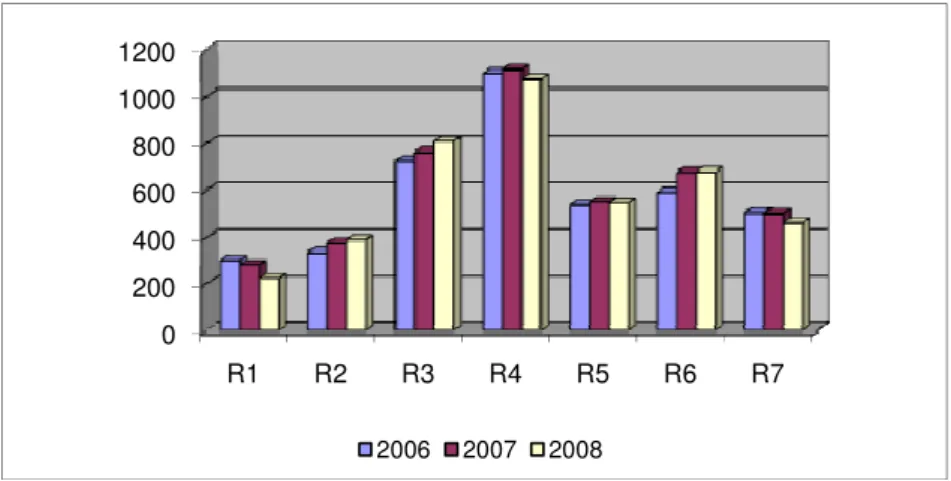
Besides the results of investigations (secondary) gained by processing the pilot farm data of AKI we analyzed pig fattening in 11 pig farms of the West-Transdanubian Region during the period of 3 years (2006-2008) with the help of questionnaires. Out of the farms involved into the investigations 4 practised traditional farming and 7
22
practised so called industrialized farming technologies. Farm accounts are shown in figures 8-9, where we marked traditional farms with “H”
and industrialized ones with “R”.
0 200 400 600 800 1000 1200
R1 R2 R3 R4 R5 R6 R7
2006 2007 2008
Source: own diagram based on the farms’ data
Figure 8: Numbers of sows on farms of the joint venture
0 200 400 600 800 1000 1200 1400
H1 H2 H3 H4
2006 2007 2008
Source: own diagram based on the farms’ data
Figure 9: Numbers of sows on traditional farms
23
Two important benchmarks of the sows’ productivity and economic benefit are the yearly output of fattened pigs per sow and the yearly pork output per sow. We could observe considerable yearly differences in both indicators not only between the two groups but also within the groups and between the farms during the past three years (Table 5-6).
Table 5: Output of fattened pigs and pork quantity per sow on the farms belonging to the production system
R1 R2 R3 R4 R5 R6 R7
YEAR
Output of fattened pigs (no/sow) per year
2006 22,30 15,54 17,31 16,80 15,80 17,41 18,40 2007 23,20 15,34 19,11 16,99 16,75 17,60 19,17 2008 24,90 18,88 19,81 16,67 15,66 18,30 19,35 average 23,34 16,66 18,79 16,82 16,07 17,78 18,97 YEAR Output of pork (kg/sow) per year
2006 2357 1742 1873 1861 1864 1950 2166
2007 2557 1717 2081 1858 1960 1988 1957
2008 2791 2085 2116 1884 1817 2105 2081
average 2569 1848 2023 1868 1880 2014 2068
Source: Analysis of the farms’ data
24
Table 6: Output of fattened pigs and pork quantity per sow on farms with traditional technologies
YEAR H1 H2 H3 H4
Output of fattened pigs (no/sow) per year
2006 18,66 17,60 15,60 18,90
2007 20,64 17,30 16,15 17,30
2008 18,62 18,10 16,40 15,50
average 19,30 17,64 16,00 17,33
YEAR Output of pork (kg/sow) per year
2006 1955 1785 1685 2041
2007 2151 1870 1728 1938
2008 1962 1980 1820 1736
average 2023 1878 1733 1905
Source: Analysis of the farms’ data
Comparing the data of the tables 5 and 6 we can conclude that there is hardly any difference between the two benchmarks of the sows’ natural performance in both groups of farming ventures.
Knowing the statistical data we can also see that the values of both indicators are 10% higher than the national average, but 23% behind the Danish level.
Several factors influence the costs of pork production in a complex way. The yearly cost of sow keeping have a high weight in the costs of fattening, Therefore the sows’ natural performance (e.g.
number of litter per year, number of weaners, sow rotation etc.) is not at all indifferent. They both influence the output of a sow per year,
25
namely the number of fattened pigs, and the pork quantity. The more favourable these indicators are the lower are the sow keeping costs per product unit (per 1kg meat-type pig). Table 7 and 8 show the relevant average values in the period of three years.
Table 7: Sow keeping costs in pig fattening farms (Average of 2006-2008)
Item Farms marked
with „R”
Farms marked with „H”
Costs of sow keeping, Ft/sow 172 472 177 580
Pork-output per sow, kg/sow 1 987 1 948
Cow keeping costs per 1kg pig for slaughtering, Ft/kg
86,80 91,16
Source: Analysis of the farms’ data
Table 8: Pigs for slaughter: trends of cost factors (2006-2008)
Item Average of 3 years of
farms marked with
„R”
Average of 3 years of farms marked with
H”
Feeding costs 141,90 178,66
Labour costs 13,85 16,10
Amortisation 4,48 6,62
Overhead costs 24,44 32,55
Source: Analysis of the farms’ data
Not only the cost price but the purchase price of the pigs for slaughter changed during the past 3 years. Therefore – similar to cost
26
price – we considered the average of three years with regard to purchase price and we determined the returns of pork (Table 9).
Table 9: Returns of pig production for slaughter (2006-2008)
Item Average of 3 years of
farms marked with
„R”
Average of 3 years of farms marked with „H”
Purchase price 290,13 288,60
Cost price 258,07 298,15
Revenue 32,06 -11,44
Source: Analysis of the farms’ data
As we can see in Table 9 the average of 3 years of farms with a mark „H” exceeds that of the other group of farms by 14.5%. During this period the cost price of pig fattening increased by 9.2% in both groups.
Returns of pig fattening are much less favourable in farms with the mark „H”, because - except for the farm H2– all of them produced rising losses. Comparing them we can see that Farms „R” have much better returns, although with a falling trend. The value of cost-benefit ratio in percentage demonstrates it well: it lessened from 23.18% in 2006 to 12.48% but two farms (R6, R7) ran with losses in the past two years (and also in the average of 3 years); (Table 10 and Figures 10- 11).
27
Table 10: Cost-benefit ratio of pig fattening (2006-2008)
YEAR National average of joint
venture farms * Average of farms marked with „R
Average of farms marked with „H”-
2006 6,63 23,18 - 0,04
2007 -11,46 5,33 -12,82
2008 - 0,01 9,48 - 0,04
Average - 1,61 12,42 - 3,80
Source: * AKI Agrárgazdasági Információk; Own calculations from farm data
Source: Analysis of the farms’ data
Figure 10: Cost-revenue trend of pig fattening on traditional farms
-35,6
69,8
-40 -28,6
-50 0 50 100 150 200 250 300 350
H1 H2 H3 H4
Purchase price Cost price Revenue Ft/kg
28
Source: Analysis of the farms’ data
Figure 11: Cost-revenue trend of pig fattening in farms with industrialized production
58,3 38,8 66,3 52,9
7,6
-10,6 -1,9 -50
0 50 100 150 200 250 300 350
Ft./kg
R1 R2 R3 R4 R5 R6 R7
Purchase price Cost price Revenue
29
4. SUMMARY
Cattle and pig keeping are the two branches of animal husbandry or moreover of the domestic agriculture that are in crises.
The crisis did not start with Hungary’s joining the European Union, but the results of the 6 years past 2004 prove that this has been an ongoing crisis, which seemed to strengthen during the past 2 years.
Our own research results also show that even the relatively stronger and better farming ventures suffered under the stress, which manifested itself not only in the falling number of livestock but definitely in the earnings. By the end of 2010 the pig branch got into a critical state of crisis and the government had to find means to overcome the situation. One year earlier similar critical situation in milk production had to be managed by exceptional means. 2011 seemed to be a hard year for both branches, because the domestic price of their products (milk and pig for slaughter) was very low but the fodder prices hit record heights. Purchase price of pigs for slaughter were about 300Ft/kg, while its cost price amounted on average 350-360 Ft/kg. Even the strongest farms could not sustain such high losses any more.
When we finished our research work at the end of 2008 and we evaluated the available data it seemed that there were farms in both branches that were capable to overcome the worsened situation because of their size (state of concentration), efficiency and capital power. It was clearly to observe that the rate of profitability worsened, but they were still able to produce respectable results. In the last year
30
(2008) of the investigations the dairy farms could only avoid producing losses with the help of the quota support. Data presumably refer to the fact that after 2015 – when the quota system will be ceased– very few farms will be capable to run their farm on their own (i.e. without support).
A critical point in every branch is the cost management, especially in relation to feeding costs. As long as the exposed situation of the farms cannot be eased and give them a chance to produce their own animal food (on own land) there will be no possibility to reduce the very high rate of fodder costs. This could be solved with the help of the new Land-law in 2013. So long farms should utilize the chances in efficiency in the field of labour productivity and implement efficiency. Our investigations proved that if the product output (e.g.
through raising the specific yield of stock) per labour unit (workforce) and the rate of housing capacity utilization were higher, notable cost savings could be achieved in labour, amortisation and overhead costs (cutback of cost prices).
31
5. NEW AND NOVEL SCIENTIFIC RESULTS
Based on and utilizing the research results deriving from the pilot farm data and primer field investigations relating to the cost-benefit ratio of domestic milk production and pig fattening in several farms of the West-Transdanubian Region during the 6 years after Hungary joined the European Union (2004-2009) we can conclude the followings:
1. While the number of cow stock was reducing at national and regional level (though in the last 2-3 years it showed an upward tendency), there were farms with higher concentration (more than 600 cows) and larger than the average size (8-9 thousand litres), where the number of stock increased by some 20 %. A precondition of this increase– besides high specific yields – is that farms should have enough land to satisfy their demand on animal feed.
2. Among the costs of milk production animal feeding costs represent the highest rate in every farm although at different levels. In the period of investigations we could observe the highest increase at this cost item. Within the cost increase determined by animal feed costs – because of notable differences in labour profitability and rate of housing capacity utilization other cost items (labour,
32
amortisation and overhead costs) considerably decreased the specific costs of milk production. There could be a difference of almost 4 Ft/l in the ratio of cow keeping costs per one litre milk depending on the performance of the cows.
3. The influence of milk cost price and purchase price on the revenues from milk production and the cost-benefit ratio of the branch is fairly moderate (R2=0.46). The branch’s result (which is actually composed of the milk price and farm aids (quota) are greatly differentiated by the milking performance of the cows per year. Correlation calculations revealed that a difference of 25 thousand HUF (3 %) per cow could occur in the yearly revenue of the six farms involved and the specific yield had a crucial role (R2=0.91), which was significant at 1%. Farm aids represent a growing rate in the incomes.
4. The relatively stable number of sows in the 11 farms of the region closely correlates with the trend of production indicators (natural efficiency of sows, fattening efficiency, production costs etc.) of both farm groups. These indicators are some 10% better than the country’s, but they are still 23% lower than those in Denmark.
33
5. Because of the differences in the costs of sow keeping and output of pork quantity per sow per year in the two farm groups less sow keeping cost of 4 Ft/kg occur in pig fattening production of farms with industrialized practice.
This favourable rate will be further improved by the higher level of labour efficiency and higher rate of housing capacity utilization that result in the reduction of specific labour and amortisation cost by HUF 40 per kg pigs for slaughter.
6. The income of pig fattening– due to lack of farm aids – is determined by the cost price of production and the purchase price of pigs for slaughter. Since the differences in purchase prices are minor (HUF 1-2) the only determining factor of the income is the cost price regarding the realizable income on one kg meat type pig. Differences per sow in meat output per year are not significant between the farms, but their impact on the cost price can be mathematically described (5% on average).
34
6. LIST OF THESIS RELATED SCIENTIFIC
PUBLICATIONS AND LECTURES
6.1. SCIENTIFIC PUBLICATIONS PUBLISHED IN EDITED JOURNALS IN HUNGRIAN
POGÁNY É.- İRI A. (2008): Az EU csatlakozás hatása magyarországi és szlovákiai tejtermelı gazdaság jövedelmére.
Gazdálkodás, 52. évf. 1. sz. 40-45. pp.
İRI A.- POGÁNY É. (2008): Állattenyésztési pályázatok a Nyugat- dunántúli Régióban. Gazdálkodás, 52. évf. 2. sz. 152-157. pp.
POGÁNY É.- TENK A.- TROJÁN SZ.- VARGA R. (2010): A sertéshústermelés színvonala és jövedelmezısége dunántúli gazdaságokban. Gazdálkodás, 54. évf. 6. sz. 634-641. pp.
6.2. SCIENTIFIC PUBLICATIONS PUBLISHED IN A FOREIGN LANGUAGE IN EDITED JOURNALS
POGÁNY É.- SEBESY ZS.- TESCHNER G.- TROJÁN SZ.
(2011): Cost-Benefit-Ratio of Dairy Farms in the West-Transdanubian Region. English Special Edition. 25. sz. Különkiadás. Gazdálkodás 55. évf. (under printing)
35
6.3. LECTURES DELIVERED IN HUNGARIAN AND PUBLISHED IN FULL VOLUMES
POGÁNY É. (2009): A tej felvásárlási árának és a tejtermékek kereskedelmi árrésének vizsgálata. Mezıgazdaság és a vidék jövıképe c. tudományos Konferencia Kiadványa. II. kötet, 462-468. pp.
Mosonmagyaróvár, 2009. április 17.
POGÁNY É. (2010): A hazai sertéshús termelés helyzete nemzetközi összehasonlításban. PhD hallgatók és doktorok a Gazdálkodásban c.
tudományos konferencia. Mosonmagyaróvár, 2009. október 16.
(Manuscript)
POGÁNY É. (2010): A tejtermelési és sertéshizlalási ágazatok jövedelemviszonyai a Nyugat-dunántúli Régióban. PhD hallgatók fóruma. Mosonmagyaróvár, 2010. március 12. (Manuscript)
6.4. POSTERS DEMONSTRATED IN HUNGARIAN
POGÁNY É. (2008): Az EU csatlakozás hatása magyarországi és szlovákiai tejtermelı gazdaság jövedelmére. XXXII. Óvári Tudományos Nap, Mosonmagyaróvár, 2008. október 9.