Vivien Czeczeli
How Does Monetary Policy Affect Income Inequality?
Evidence from Europe
Hogyan befolyásolja a monetáris politika a jövedelemegyenlőtlenséget?
Bizonyíték Európából
The issue of inequalities has become increasingly important in recent decades.
Although distributional effects, such as inequalities, are commonly associated with globalisation and fiscal policy processes, many of the side effects of the exceptionally loose monetary policy of the last decade also affect the issue.
After identifying the mechanisms and channels linking the field of monetary policy and inequality, the research focuses on empirical analyses. The research is based on a panel ARDL test focusing on the 19 Euro area countries and Denmark, Sweden and Switzerland, where negative nominal interest rates have been applied.
The research includes the period of 2008–2018. The aim of the paper is to assess how certain monetary policy indicators affect inequality. The main conclusion is consistent with the existing literature: the effect of monetary policy to inequalities is modest, however not negligible. The effect of inflation seems to be weak; however, the rise in unemployment rate and long term interest rates negatively affect inequalities.
The positive effects of the rising GDP per capita are also proven by the analysis.
JEL codes: E52, D63, C23
Keywords: monetary policy, income inequality, Europe, panel ARDL test Az egyenlőtlenségek problémaköre napjainkban egyre inkább felértékelődik. Az elosz- tási hatásokat, így az egyenlőtlenségeket elsősorban a fiskális és globalizációs össze- függésekkel szokás azonosítani, azonban az utóbbi évtized kiemelten laza monetáris politikai irányvonala is számos csatornán keresztül érinti a témakört. A tanulmány a monetáris politikát és az egyenlőtlenségeket összekapcsoló mechanizmusok
Vivien Czeczeli is a junior researcher at the University of Public Service Economy and Competitiveness Research Institute.
Czeczeli Vivien a Nemzeti Közszolgálati Egyetem Gazdasági és Versenyképességi Kutató Intézet kutatója. E-mail: czeczeli.vivien@uni-nke.hu
T AN U L M ÁN Y
azonosításával indít, majd a jelenlegi fejlemények bemutatására fókuszál. A kutatás empirikus része panel ARDL-teszten alapul, mely az euróövezet 19 országa, illetve három másik negatív nominális kamatot alkalmazó európai ország (Dánia, Svéd- ország, Svájc) adataira építkezik, a 2008–2018 időtávot lefedve. A tanulmány célja annak vizsgálata, hogy az egyes monetáris politikai indikátorok hogyan hatnak az egyenlőtlenségre. A fő következtetés, hogy a monetáris politika egyenlőtlenítő hatása mérsékelt, azonban nem elhanyagolható. Mindez konzisztens a meglévő szak- irodalmi következtetésekkel. Az infláció hatása mérsékelt, a munkanélküliségi ráta és a hosszú lejáratú kamatok emelkedése ugyanakkor növeli az egyenlőtlenségeket.Az egy főre jutó GDP emelkedésének pozitív hatása szintén igazolásra került.
JEL-kódok: E52, D63, C23
Kulcsszavak: monetáris politika, jövedelmi egyenlőtlenségek, Európa, panel ARDL-teszt
1. Introduction
When the Covid-19 crisis broke out in 2020, monetary policy still continued to show signs of the aftermath of the global financial crisis. Central bank operation is still far from its conventional form: a ‘new normal’ is present, where continuous monetary stim- ulus has become a necessary condition for normal economic operation. But, all of this has side effects and in many cases these impulses have not been shown to be sufficient to achieve the desired goals.
It is important to note that after the 2007 economic and financial crisis, the inter- action between financial and macroeconomic processes is much stronger than it was before or as previously assumed.1 Higher risk-taking due to extremely loose monetary policy may be at the root of systemic macroeconomic spillovers. To ensure financial and monetary stability, it would therefore be appropriate to embark on a path of monetary tightening. The trends of the recent years have carried within them the likelihood that continuous expansion will lead to imbalances and risks, which may even serve as a focal point for a possible collapse. This has not yet been proven, but important facts still need to be kept in mind. Today’s central bank framework, which is based on the inflation target, needs to be reformed. It can be seen that the ten-year monetary expansion is falling outside the inflation rate, causing tensions elsewhere. Previous research of Borio- Lowe (2002) has already confirmed that in times of low inflation, demand pressures accumulate in credit- and asset markets rather than in the prices of goods and services.
Yield-seeking efforts at low interest rates have resulted in record asset- and property price indices in many countries. All this affected the situation of different income groups in different ways. The trend of this endless rise has so far been able to be halted by the economic downturn caused by the Covid-19 crisis. The developments of the years before the Covid-19 crisis appeared to be temporarily reversed in some respects, but it is impor- tant to note that the room for manoeuvre in monetary policy appears to be narrowing
1 F Mishkin, ‘Monetary Policy Strategy: Lessons from the crisis’, NBER Working Paper no 16755, 2011.
AN U L M ÁN Y
rather than widening. The resulting economic turmoil is therefore not expected to allow for monetary tightening. The economic policy interventions required by the downturn started again to heat up previous pre-Covid trends.
At the beginning of 2021, negative nominal interest rates are still present in several countries (Japan, Switzerland, Denmark and the Eurozone2). As a result, commercial banks have to pay interest on their risk-neutral central bank reserves. To avoid this, on the one hand, they may increase their lending, which may lead to an increasing number of non-performing loans through a larger number of risky customers. On the other hand, other capital investments may also appear here, which may also have price-increasing effects on the markets of various assets. This again has heterogeneous effects among the owners of each asset type. Furthermore, even with weak inflation data, all this means overheating. It is also important that inflation (and its lack) also affects the situation and purchasing power of each social groups. Also important is the job-creating effect of the monetary stimulus, which affects the income situation through the unemployment rate and wage developments.
Although, according to the traditional political economy approach, income redis- tribution takes place primarily through fiscal policy – through taxes and public spend- ing – it cannot be ignored that monetary policy also has important income redistribution effects.3 The processes listed in the previous paragraphs are able to influence the problem of inequalities from various aspects. The research starts with an in-depth examination of the above issues and identifies the channels through which the spillover effects of each monetary policy step affect the wealth and income inequality of individual households.
The basis of the next part of this paper is the systematised literature review. Approaches are presented that support the inequality-increasing (reducing) effects of monetary expansion (restriction) and those that emphasise the inequality-reducing (increasing) effects of monetary expansion (restriction). Some processes trigger the heating of ine- qualities, while others trigger the opposite. The total effect can be determined by the sum of their results, which requires the use of econometric methods. The last part of the paper focuses on an empirical analysis. The aim of the research is to reveal how certain monetary policy indicators affect inequality.
2. Inequality effects and monetary policy
The question whether monetary policy should care about inequality has become more important in recent times. Inequality is not within the mandate of central banks. The prevailing view in recent times is that central banks should have narrow regulatory objectives, which is limited to price stability. However, Dietsch et al. (2018) argue that central banks should not consider this pattern given: these thoughts are also related to the increased importance of monetary policy in macroeconomics since 2007. After 2007, central bank independence has changed to a certain extent. Furthermore, price stability,
2 Between 2016 and 2020, Sweden also applied negative nominal interest rates.
3 K Davtyan, ‘Income Inequality and Monetary Policy: An Analysis on the Long Run Relation’, Research Institute of Applied Economics, Working Paper no 4, 2016.
T AN U L M ÁN Y
financial stability, or full employment cannot be achieved isolated without affecting other policies. Therefore, monetary policy also affects income and wealth distribution.Besides that inequality is not a central bank mandate, one can argue that the sensitivity to inequality would undermine the effectiveness of monetary policy. These considera- tions support the pattern of central bank independence. However, this perception has been criticised because of its many weaknesses, (for example, the increased politicisation of monetary policy, which must be also taken into account)4.
Hansen et al. (2020) also examined the question whether monetary policy should focus on inequality. They investigated the relationship of monetary policy and inequal- ity in a Two-Agent New Keynesian framework, where economy is subject to technology shocks. Their results indicate that monetary policy – particularly if it follows a standard Taylor rule – may have to make inequality an explicit target, because in this case, welfare could be improved. They study two settings. One is ‘optimal policy’ when the central bank cares equally about all individuals and chooses the best possible path of interest rate assuming full information. The other one is the ‘Taylor rule’, when interest rate is determined by factors like inflationary gap and output gap. Inequality in their model is captured by the difference in consumption between rich and poor. If central banks follow the Taylor rule, after a positive productivity shock interest rates are set lower than it would be implied by the standard Taylor rule. This leads to higher wages which can lower inequality since it benefits mostly the poor. Since this policy avoids excessive interest rate tightening in response to a productivity shock, it also improves inflation and growth outcomes. When following the ‘optimal policy’, their finding suggests that output and inflation shows little difference compared to the case when it ignored inequality.
Brunnermeier (2020) also highlights the importance of the issue of monetary pol- icy and inequality. The author points out, that two channels are operating at the same time: monetary policy is affecting inequality and inequality is also impacting monetary policy. Focusing on how monetary policy can affect inequality, two mechanisms have to be mentioned. One is demand management. This means stimulating consumption through shifting consumption from rich to low income households, who usually have higher marginal propensity to consume. The other one is portfolio choice. It is based on people’s risk aversion, for example, how much risk they are willing to take, or how much they want to save in safe assets such as government bonds. It highly depends on the risk environment. If the balance sheet of certain sectors (or industry or households) is impaired, wealth has to be shifted to these sectors to reduce risk premium and stimulate investment, and therefore stimulate the labour market. In this sense shifting savings from safe assets to risky assets can lower inequality. Central banks can manage this process through affecting relative prices of certain assets.
The Covid-19 crisis has also affected inequality in several aspects. Furthermore, as Schnabel (2020) underlines experiences so far show that the crisis has significantly reshaped the functioning of the economy. These changes also affect the implementation of monetary policy. Central banks may need to change the way they execute their man- dates in response to changing consumer preferences and changing technologies. Stiglitz (2020) also claims that Covid-19 did not affect individual social groups in the same way.
4 P Dietsch, F Cleveau and C Fontan, Do Central Banks Serve the People? (Cambridge: Polity Press, 2018).
AN U L M ÁN Y
He claims that the rules of the economy should be rewritten. As regards monetary policy, it should not only focus on inflation, but it should strive for full employment within all social groups. Better balanced bankruptcy laws should replace those that are too creditor friendly and less accountable for banks. At the corporate level, more emphasis should be placed on all stakeholders and not just on shareholders.
There is a growing agreement on the effects of monetary policy on income redistribu- tion. These processes are present in relation to both conventional and non-conventional monetary measures. However, based on its achievable mechanisms of action, different channels dominate in the periods of each mode of action.
2.1. The transmission channels of monetary policy for inequality
Amaral (2017) highlights five main channels through which monetary policy can have an impact on inequalities:
Monetary policy channels on income
inequali�es
Infla�on tax channel Savings redistribu�on
channel Interest rate exposure
channel Income heterogeneity
channel Income composi�on channel
Figure 1
Channels through which monetary policy can affect income inequalities
Source: Compiled by the author based on Amaral (2017).
The starting point of the inflation tax channel is that, as a result of monetary easing, expected inflation will start to rise and reduce the purchasing power of households.
Households with lower incomes are much more sensitive to these processes, as they rely on cash to a much greater extent in carrying out their transactions, based on their total expenditure. Therefore, as households with different income situations are affected differently by monetary easing, rising inflation supports the growth of inequalities.
Approached from the other side, similar ideas are supported by the previous research of Bulír (1998), according to which low inflation supports the effects of fiscal redis- tribution in reducing income disparities. Price stability does not contribute to income inequality neither in the medium nor in the long term, so a shift towards price stability is a rewarding step. Erosa-Ventura (2002) found that expected inflation works similarly to a regressive consumption tax,5 also contributing to inequality. According to Monnin’s (2014) research, low inflation rates can be associated with higher income inequality.
5 All this can be explained by the fact that low income people spend a larger share of their income on consumption than those with higher incomes, so they are disproportionately affected by this effect.
T AN U L M ÁN Y
As inflation rises, inequality decreases and then, after a point, starts to rise again, that is, a U-shaped relationship can be detected between the two indicators.The heterogeneity dimension of the savings redistribution channel is the net wealth.
Monetary expansion favours borrowers as it reduces interest payments on debt. Savers with deposits, on the other hand, realise lower returns.6 All this can be attributed to the fact that the rise in unexpected inflation reduces the real value of assets and liabilities.
By reducing the real value of nominal debt, the position of borrowers improves. How- ever, the impact on inequality depends on how and by what maturity each household owns the assets. According to Doepke-Schneider’s (2006) research, the biggest winners are the middle-aged, middle-class households. This is explained by the fact that these households have mainly long-term debt in the form of fixed-rate mortgages. In contrast, older, wealthier households would lose the most, as they are mainly net savers, with deposits and short-term debt. Through this channel, therefore, expansionary monetary policy can reduce inequality.
The interest rate exposure channel is based on the research of Auclert (2017) and is related to the reallocation caused by the change in the real interest rate. While the interest rate, which is applied to discount future returns decreases, a decline in the real interest rate increases the price of financial assets. However, the identification of gains and losses for individual households requires a more accurate accounting of the maturity of assets and liabilities. Expensive monetary policy is beneficial for net savers with mainly short-term assets and net borrowers with relatively longer-term debt as long as it reduces the real interest rate. In contrast, net savers with long-term assets and net borrowers with short-term debt are more likely to be adversely affected. In order to better delineate the impact of monetary policy on inequalities, more information is needed on the distribution of assets and liabilities within the population.
The basis for the income heterogeneity channel is that changes in monetary policy can have an impact on labour incomes, depending on where a household is located in the income distribution. The income of lower-income households is much more sensitive to changes in the unemployment rate than that of richer households. In their case, wages are a much more decisive component of income. As a result of the central bank’s rate hike, the unemployment rate will rise, so poorer households will be much more affected by these processes and income inequality will rise.7 Along this logic, restrictive monetary policy projects an increase in inequalities, while expansionary monetary policy projects a decrease.
The starting point of the income composition channel is that households derive their income from different sources, each of which may react differently to changes in mone- tary policy. For households at the lower end of the income distribution, transfer income is dominant, while households close to the median rely mainly on labour income, and at the upper end of the income distribution, business and capital income dominate much more. The consequences of the change in monetary policy stance are not clear. If interest
6 A Colciago, A Samarina and J Haan, ‘Central bank policies and income and wealth inequality: A survey’, Journal of Economic Surveys 33, no 4 (2019), 1199–1231.
7 M Feldkircher and K Kakamu, ‘How does monetary policy affect income inequality in Japan? Evidence from grouped data’, Working Papers in Regional Science 2018/03, WU Vienna University of Economics and Business, 2018.
AN U L M ÁN Y
rate cuts stimulate economic activity, they may manifest themselves in rising wages and declining unemployment. This process may increase inequality at the lower end of income distribution, as transfer incomes are likely to follow wage developments only marginally. On the other hand, as a result of declining interest income caused by lower interest rates, which mainly affects richer households, inequality decreases.8 The basis of the channel is thus that households rely on different sources of income in different segments of income distribution. In order to determine the exact effect of an increase (decrease) in the interest rate, it is necessary to know the exact distribution of income sources and to analyse them empirically.
Expansionary monetary policy
Direct effects
Indirect effects
Macroeconomic channel
Financial channel
Figure 2
Monetary policy channels for inequality
Source: Samarina-Nguyen (2019).
In addition to the aforementioned, based on the approach of Samarina-Nguyen (2019), we can distinguish between direct and indirect effects (see Figure 2). According to the direct effect, an interest rate cut results in a decrease in interest income, and this reduces income inequality. The starting point of the indirect effects is a monetary easing. On the one hand, through the macroeconomic channel total output is rising, which means rising employment levels and wages, through which income inequality can decrease.
Through the financial channel, asset prices increase which results in larger capital gains, larger profits, and they can increase dividend payment, which usually affects the rich favourably and thus increases inequality. It may weaken the inequality-reducing effects of expansionary monetary policy. Changes in asset prices affect only a small proportion of households in the upper share of income distribution, which has a negligible effect on total income distribution.
There is currently no complete agreement among the conclusions of the empiri- cal literature focusing on the effects of monetary policy on inequalities. On the one hand, this can be traced back to the different methodologies of the various approaches, and on the other hand, the heterogeneity of the sample under study also plays a significant role.
It is important to mention that inequality is present in both the wealth and income dimensions. The most important difference between these two definitions is that income
8 P Amaral, ‘Monetary Policy and Inequality’, Economic Commentary, 2017.
T AN U L M ÁN Y
is a data for a given period that shows how the income earned in the economy is dis- tributed within the population. Assets, on the other hand, refer to a specific date and represent the net monetary value of the assets held by economic operators in various forms. Within countries, wealth and income inequality can take on different extents.The two most commonly used indicators of income inequality are the income quin- tile ratio and the Gini coefficient. The former one compares the annual income of the upper income fifth with the income of the lower income fifth. It shows how many times the richest fifth of households have the same income as the poorest fifth. The other most important indicator, which is also an important building block of this research and lit- erature base, is the Gini coefficient. This indicator takes a value between 0 and 100, with the lowest value representing total income equality and the upper limit representing total inequality.
2.2. The impact of monetary expansion and restriction on inequality
The impact of monetary expansion on the growth of inequalities is supported by the research of Saiki-Frost (2014). Through the example of Japan, the authors shed light on the fact that the highly expansionary non-standard monetary policy measures, increase income inequality in the short run. The growth of the monetary base, which results in higher asset prices, is primarily favourable to the rich, who hold a significant proportion of shares and can earn higher capital gains. After the end of 2008, when the Bank of Japan (BOJ) again increased the volume of its unconventional monetary policy measures to address the crisis, inequality increased. Asset prices have risen dis- proportionately relative to other economic fundamentals. It is important to note that the growing inequality created in this way may also sow the seeds of future financial instability. According to the research of Saiki-Frost (2014) based on vector autoregres- sive calculations, monetary policy tightening results in a 0.4 percentage point reduction in the GINI index. Restrictive monetary policy can therefore serve as an effective tool to reduce income inequality.
The Bank of England (BOE) also highlights that quantitative easing (QE) measures particularly favoured the richest 5 per cent of U.K. households, which own 40 per cent of total assets in addition to pension funds.9 An important issue for QE is, what additive liquidity is used for. There are two basic options: productive investment, or investment in existing financial assets. The portfolio rebalancing channel can be only effective if the additional liquidity is used for productive investments. However, in times of crisis this rarely happens. Investment is much more based on investor confidence rather than available liquidity. In this case, QE does not stimulate the economy. Another important aspect is the proper selection of the bonds to be purchased. It may occur that bonds that are mainly the basis for purchases are based on market representation. This is more favourable to firms that are more active in the bond market and exclude small and medi- um-sized enterprises. This process can have hidden distribution effects. If similar effects
9 Bank of England, ‘The distributional effects of asset purchases’, Quarterly Bulletin, 12 July 2012.
AN U L M ÁN Y
are to be expected, QE could even be used to reduce the carbon intensity of firms or for other useful purposes.10
Domanski et al. (2016) also argues that inequality has increased following the financial crisis. According to their research,11 although low interest rates and rising bond prices have had a negligible impact on wealth inequality, rising stock prices have contrib- uted much more to growing inequality. The rise in property prices was only partially able to offset this effect. Previous researches (Bulír [2001]; Albanesi [2001]) also confirm the same ideas that inflation in those periods which can be associated with monetary easing has an increasing effect on income inequality in the next period, and higher inflation rates are accompanied by higher income inequalities.
Based on other approaches, restrictive monetary policy contributes to growing inequalities.
Coibion et al. (2012) examined the role of monetary policy in consumption and income inequality since the 1980s, following the experiences of the United States. Mon- etary tightening shocks increased inequalities, especially before 1990, when the main goal of monetary policy was to contain inflation. (Their study does not include the period of non-conventional measures after 2008.)
Feldkircher and Kakamu (2018) examined the issue in a VAR framework based on the example of Japan and their main finding is also that monetary tightening signifi- cantly increases inequalities in the short run. However, this conclusion is particularly relevant when income data is based on households whose head is employed (workers’
households). The channel of unemployment plays an important role in the development of this, which is further strengthened by the appreciation of the real exchange rate. In this case, many companies are forced to lay off workers or cut wages in the sector of goods and services traded abroad. All this therefore leads to an increase in inequality.
If we also take into account those households whose head is self-employed, retired or unemployed (that is, all households are covered by the analysis), then jobs and exchange rate channels do not prove to be effective. In contrast, the inflation tax channel reduces inequalities: households that use much more cash have been able to benefit to a greater extent from declining inflation expectations.
Similar ideas are formulated by those analyses that approach the topic from the perspective of monetary policy easing. Their main conclusion is that expansion reduces inequalities.
Based on a panel database of thirty-two developed and emerging countries, Furceri et al. (2016) examined the impact of unexpected interest rate changes between 1990 and 2013. They conclude that tightening (loosening) monetary measures increase (decrease) income inequality. However, this effect varies over time and business cycles, and between countries, depending on the ratio of labour income and other distribution policies. The impact is stronger in countries with higher labour income ratios and more moderate redistributive measures. An unexpected increase in the key interest rate of 100 basis
10 Dietsch et al., Do Central Banks Serve the People?
11 However, the authors draw the reader’s attention to a careful interpretation of these results due to some factors that are not considered in their analysis, see more in Domanski et al., ‘Wealth inequality and monetary policy’, BIS Quarterly Review, March 2016.
T AN U L M ÁN Y
points (1 per cent) will increase inequality by approximately 1 per cent in the short run and 2¼ per cent in the medium term.The same idea is reinforced by Ampudia et al. (2018) whose analysis is based on the income and wealth composition of Euro area households. According to their results, both conventional and non-conventional expansionary monetary policies can reduce income and wealth inequality. The large decline in the unemployment rate has supported this process by improving the situation of lower-income households. The mechanism of ine- qualities has been explored on the basis of direct and indirect effects. The direct effects on poorer households are either neutral or they experience an increase in net financial income after easing. Other households are experiencing a loss of income and savings are declining due to lower real yields. In contrast, indirect effects benefit all households (albeit to varying degrees) as everyone benefits from an increase in wage income follow- ing monetary easing. Their research also focuses on Eurozone countries.
The analysis of Samarina-Nguyen (2019) is based on Eurozone data from the period of 1999–2014. The impact of expansionary monetary policy on reducing income inequality was found to be most significant in the peripheral countries. Lenza-Slacalek (2018) also conducted a research focusing on the income and wealth situation of Euro area households, and examined the aggregate impact of QE within the framework of a cross-country VAR model. They emphasise the key role of the income heterogeneity channel in relation to the effects of QE on reducing income inequalities. The positive effects were realised through a large decrease in the unemployment rate and through an increase in wages. The GINI coefficient for gross household income decreases from 43.1 to 42.9 one year after the introduction of QE. It is important to note that the impact of the asset purchase program on inequalities is small overall, especially when compared to the increase of almost 2–3 percentage points in several developed countries over the last few decades. Herradi (2017) also argues that unconventional measures have had little effect on the situation of individual households and their impact on inequalities is relatively neutral. Their analysis focuses on Italian households based on the period of 2008–2014. Taking into account each income quintile, it was found that lower-income and middle-class households benefited to a small extent from changes in employment levels and changes in debt levels, especially between 2010 and 2012.
2.3. Characteristics of Europe and the Euro Area
Looking at the situation of the Euro area, we can see that a slight negative correlation can be detected between the GINI indicator and the values of the GDP per capita. Figure 3 illustrates this relationship, where we can see the relationship between the pre-crisis 2000–2008 (dark) and post-crisis (2008–2018) (light) average GINI and GDP per capita data.
AN U L M ÁN Y
0,00 20,00 40,00 60,00 80,00 100,00 120,00 140,00 160,00 180,00
22,00 24,00 26,00 28,00 30,00 32,00 34,00 36,00 38,00
GDP PER CAPITA
GINI
Figure 3
Relationship between GINI and GDP per capita for Euro area and NIRP countries
Source: Eurostat Figure 4 shows the value of the GINI indicator in 2007 and in 2019. In 2019, the range of the indicator was 12.6 units, that is, the difference between the highest value (35.4 – Lithuania) and the smallest (22.8 – Slovakia) was 12.6 units in the value of the indicator ranging from 0 to 100. Looking at the average, we can say that the GINI of the examined countries averaged 29.5 in 2019, compared to pre-crisis 2007 figures of 29.2. This is a min- imal increase, but it should not be forgotten that the average smoothes out the extreme values, so in reality we can get a different picture with the help of deeper analyses.
0,0 5,0 10,0 15,0 20,0 25,0 30,0 35,0 40,0
2007 2019
Figure 4
Gini coefficient in the Euro area countries
Source: Eurostat
T AN U L M ÁN Y
If we look at the income quintiles (Figure 5), an absolute increase is observed. Based on 2007, the value of the first quartile increased from 10.805 to 1.4053 by 2019, an increase of 30 per cent. For the median household, this value was also 30 per cent, while for the upper quartile, there was an increase of 28.8 per cent. The figure also shows that the median income is closer to the lower quartile, that is, the income of the upper ¼ is much higher in terms of proportions; compared to the proportions of the other categories.5 000 10 000 15 000 20 000 25 000 30 000
2007 2008 2009 2010 2011 2012 2013 2014 2015 2016 2017 2018 2019 First quar�le Second quar�le Third quar�le
Figure 5
Income quartiles in the Euro area (in EUR)
Source: Eurostat According to Eurostat data, on the basis of income deciles, it can also be stated that the top 10 per cent owns 24 per cent of total income.
The unemployment rate (Figure 6) returned to pre-2008 financial and economic crisis levels by early 2020, falling to around 5 per cent from its 2013 peak of 7.6 per cent.
However, the Covid-19 crisis has again led to a sharp increase in the value of the indica- tor. Inflation (Figure 6) is showing a rather volatile picture. Following a long period of deflationary risks, the ECB managed to get closer to inflation targets in 2018. However, inflation started to decline in 2019, and this trend that intensified even during the 2020 viral crisis.
AN U L M ÁN Y
-2,0 0,0 2,0 4,0 6,0 8,0 10,0 12,0 14,0
2008M01 2008M06 2008M11 2009M04 2009M09 2010M02 2010M07 2010M12 2011M05 2011M10 2012M03 2012M08 2013M01 2013M06 2013M11 2014M04 2014M09 2015M02 2015M07 2015M12 2016M05 2016M10 2017M03 2017M08 2018M01 2018M06 2018M11 2019M04 2019M09 2020M02 2020M07
HICP Unemployment rate Figure 6
Unemployment rate and inflation in the Euro area (%)
Source: Eurostat Figure 7 shows the development of the EuroStoxx 50 stock market index. The indicator represents the value of the shares of the 50 companies with the largest capitalisation and highest turnover. The figure clearly shows the growth trend after the global financial cri- sis of 2008, followed by the drastic decline caused by the coronavirus at the beginning of 2020. However, shortly after the deep flight, the pre-crisis trends were heated up again.
2500 2700 2900 3100 3300 3500 3700 3900
2016.01.01 2016.03.01 2016.05.01 2016.07.01 2016.09.01 2016.11.01 2017.01.01 2017.03.01 2017.05.01 2017.07.01 2017.09.01 2017.11.01 2018.01.01 2018.03.01 2018.05.01 2018.07.01 2018.09.01 2018.11.01 2019.01.01 2019.03.01 2019.05.01 2019.07.01 2019.09.01 2019.11.01 2020.01.01 2020.03.01 2020.05.01 2020.07.01 2020.09.01 2020.11.01 EuroStock 50
Figure 7
Euro area – Dow Jones Euro Stoxx 50 Price Index (Historical close, average of observations through period)
Source: ECB
T AN U L M ÁN Y 3. Empirical analysis
The empirical part of the research is based on a panel ARDL test. The examinations investigate whether the main conclusions set out in the literature review apply to the selected group of countries. A clear assessment of the impact of monetary expansion and restriction on inequalities requires quite in-depth analysis which is based on a detailed database on households’ situation. Identifying deeper conclusions requires further econometric researches. However, it is possible to give an approximate estimate of the impact of changes in the various monetary policy indicators on inequality and whether they are consistent with the preliminary assumptions.
3.1. Data
The empirical part of the paper focuses on the post financial crisis era (that is, the period of 2008–2018), when non-conventional monetary policy measures have been applied.
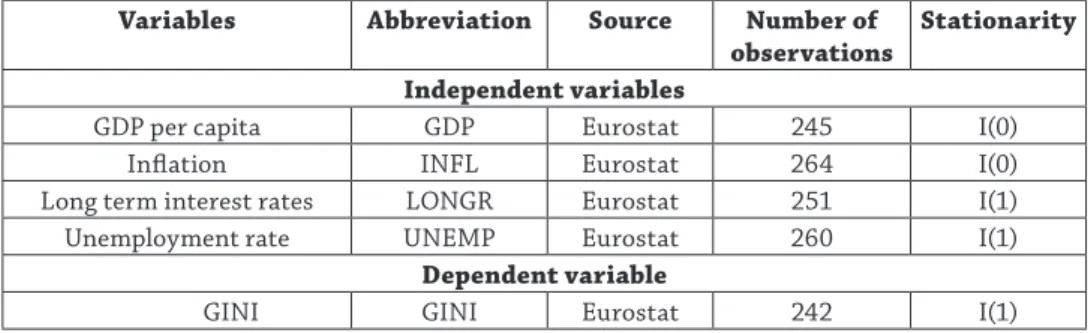
The analysis is based on a panel database with annual data, focusing on the 19 Eurozone countries and three other European countries (Switzerland, Denmark and Sweden), where negative nominal interest rates have been applied during the period. The inde- pendent variables in the model are the GDP per capita (GDP), inflation rate (INFL), long term interest rates (LONGR), and the unemployment rate (UNEMP). The dependent variable of the model is the GINI (GINI) coefficient. The source of the data is the Eurostat database. The analysis on the data was performed using EViews program. The variables included in the model are based on annual observation.
Table 1 Descriptive statistics
Variables Abbreviation Source Number of
observations Stationarity Independent variables
GDP per capita GDP Eurostat 245 I(0)
Inflation INFL Eurostat 264 I(0)
Long term interest rates LONGR Eurostat 251 I(1)
Unemployment rate UNEMP Eurostat 260 I(1)
Dependent variable
GINI GINI Eurostat 242 I(1)
Source: Compiled by the author.
3.2. Model
The first step of the analysis was the conduction of stationary tests. The tests were car- ried out by Augmented Dickey Fuller tests in EViews. The results can be seen in Table 1. As we can see, the series used in the analysis are integrated in different orders. If the
AN U L M ÁN Y
variables are I(0) and I(1) cointegration should be tested with ARDL test (Autoregressive Distributed Lag model). Performing cointegration test is required to establish a long run relationship. If we have cointegrated series, than even if there are shocks in the short run, which can influence the movement of the individual series, they would converge in the long term.
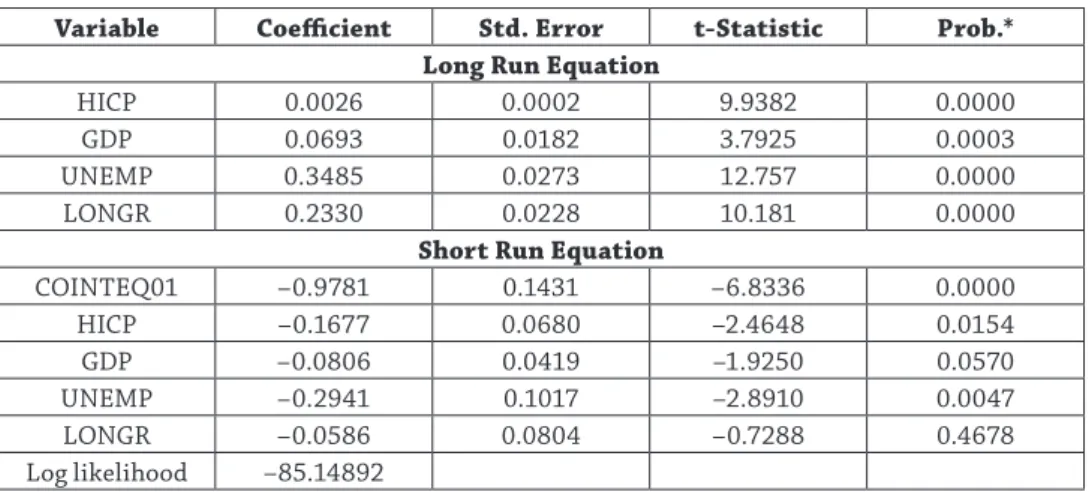
The results of the ARDL test are summarised in Table 2.
Table 2 Results of the ARDL test
Selected Model: ARDL (1, 1, 1, 1, 1)
Variable Coefficient Std. Error t-Statistic Prob.*
Long Run Equation
HICP 0.0026 0.0002 9.9382 0.0000
GDP 0.0693 0.0182 3.7925 0.0003
UNEMP 0.3485 0.0273 12.757 0.0000
LONGR 0.2330 0.0228 10.181 0.0000
Short Run Equation
COINTEQ01 –0.9781 0.1431 –6.8336 0.0000
HICP –0.1677 0.0680 –2.4648 0.0154
GDP –0.0806 0.0419 –1.9250 0.0570
UNEMP –0.2941 0.1017 –2.8910 0.0047
LONGR –0.0586 0.0804 –0.7288 0.4678
Log likelihood –85.14892
Source: Own calculations with EViews
3.3. Results
Based on the model, short term and long term effects can be identified (existence of cointegration). Overall, the effects are moderated. The effect of the rise in inflation elim- inates in the long term. This may be explained by the relatively low (near zero) inflation in the examined period. Although there was some heterogeneity in inflation develop- ments across the Euro area, achieving inflation targets was a challenge in almost every country. Thus, as the absence of inflation rather than excessive inflation was decisive during this period, the rise in the price level may in fact have made a small contribution to the increase in inequalities.
The effect of GDP per capita taking into account all examined countries is also mod- erate; however, at country level, in most of the countries there is a negative relationship (except for Belgium and France). These effects are also eliminating in the long term, which can prove the importance of indirect channels. It can also imply that the growth in GDP can positively affect all social groups.
T AN U L M ÁN Y
The rise in unemployment rate increases the level inequality in the long term. The most significant effect can be attributed to the unemployment rate, which is linked to the pre-assumption that the low income groups rely disproportionally on labour income.The effects of long term interest rates are positive in the long run. The rise in long term interest rates results in the increase of inequality. Interest bearing assets are concen- trated to the wealthier people.
The long-term effect of long-term interest rates is positive, that is, an increase in interest rates leads to an increase in inequality. This supports the assumption that interest- bearing assets are concentrated mainly in richer people.
4. Summary
The issue of inequality, which is playing an increasingly important role today, can be approached from many aspects. The processes of globalisation, technological develop- ment and the economic changes after the global financial crisis of 2007 are all decisive.
Concerning the latter, in addition to fiscal policy measures, the role of monetary policy can also be underlined, especially with regard to its unconventional operation.
Inequality is a global issue, but the present research has focused primarily on Europe, with a particular emphasis on Euro area countries. In Europe, income and wealth inequalities are expected to increase also in the 2020s, and the Covid-19 crisis also contributes to this process.
The extremely loose monetary policy stance, including negative interest rates, has a number of mechanisms that affect households with different income situation to var- ying degrees. Based on all this, according to the literature, we have highlighted six main channels that play a role in the effects of monetary policy on inequality: the inflation tax channel, the savings redistribution channel, the interest rate exposure channel, the income heterogeneity channel, the income composition channel and the direct and indirect effects.
The present research has revealed the implications of the empirical literature concerning how certain instruments and channels of monetary policy affect income inequality. Existing studies show strong heterogeneity in the results, which can be explained by differences in the subject research and the lack of detailed data about the income structure of households. Overall, the impact of monetary policy on inequalities is modest, but not negligible.
The empirical part of the paper is based on Euro area Member States and three other countries with negative interest rate policies (Denmark, Sweden and Switzerland). The research covers four monetary variables, (inflation, long-term interest rates, unemploy- ment rate, and GDP per capita), covering the period 2008–2018.
The analysis also confirms the moderate impact of monetary policy on inequalities.
The effect of inflation is modest, especially in the long term. This is consistent with the fact that during the examined period, inflation was relatively low; the price level may in fact have made a small contribution to the increase in inequalities.
The positive impact of GDP per capita may reinforce the significance of indirect effects. The data also support that the change in the unemployment rate affects different
AN U L M ÁN Y
income groups to different degrees, so its increase amplifies the inequality. An increase in interest rates leads to an increase in inequality. This supports the assumption that interest-bearing assets are concentrated mainly in richer people.
References
Albanesi, S, ‘Inflation and Inequality’. IGIER Working Paper, 2001.
Amaral, P, ‘Monetary Policy and Inequality’. Economic Commentary, 2017. Online: https://
doi.org/10.26509/frbc-ec-201701
Ampudia, M, D Georgarakos, J Slacalek, O Tristani, P Vermeulen and G Violante, Mon- etary policy and household inequality. European Central Bank, 2018. Online: https://
doi.org/10.2866/545402
Auclert, A, ‘Monetary Policy and the Redistribution Channel’. NBER Working Paper Series, 2017. Online: https://doi.org/10.3386/w23451
Bank of England, ‘The distributional effects of asset purchases’. Quarterly Bulletin, 12 July 2012.
Borio, C and P Lowe, ‘Asset prices, financial and monetary stability: exploring the nexus’.
BIS Working Papers, 2002. Online: https://doi.org/10.2139/ssrn.846305
Brunnermeier, M, Monetary Policy and Inequality: COVID-19 and Beyond. Peterson Institute for International Economics, 14 December 2020. Online: www.piie.com/
events/monetary-policy-and-inequality-covid-19-and-beyond
Bulír, A, ‘Income Inequality: Does inflation matter?’ IMF Working Paper, 1998. Online:
https://doi.org/10.5089/9781451928549.001
Coibion, O, Y Gorodnichenko, L Kueng and J Silvia, ‘Innocent Bystanders? Monetary policy and inequality’. NBER Working Paper Series, 2012. Online: https://doi.org/10.
3386/w18170
Colciago, A, A Samarina and J Haan, ‘Central bank policies and income and wealth ine- quality: A survey’. Journal of Economic Surveys 33, no 4 (2019), 1199–1231. Online:
https://doi.org/10.1111/joes.12314
Davtyan, K, ‘Income Inequality and Monetary Policy: An Analysis on the Long Run Rela- tion’. Research Institute of Applied Economics, Working Paper no 4, 2016.
Dietsch, P, F Cleveau and C Fontan, Do Central Banks Serve the People? Cambridge: Polity Press, 2018.
Doepke, M and M Schneider, ‘Inflation and the Redistribution of Nominal Wealth’. Jour- nal of Political Economy 114, no 6 (2006). Online: https://doi.org/10.1086/508379 Domanski, D, M Scatigna and A Zabai, ‘Wealth inequality and monetary policy’. BIS
Quarterly Review, March 2016.
Erosa, A and G Ventura, ‘On inflation as a regressive consumption tax’. Journal of Monetary Economics 49, no 4 (2002), 761–795. Online: https://doi.org/10.1016/s03 04-3932(02)00115-0
Feldkircher, M and K Kakamu, ‘How does monetary policy affect income inequality in Japan? Evidence from grouped data’. Working Papers in Regional Science 2018/03, WU Vienna University of Economics and Business, 2018.
T AN U L M ÁN Y
Furceri, D, P Loungani and A Zdzienicka, ‘The Effects of Monetary Policy Shocks on Inequality’. IMF Working Paper, 2016. Online: https://doi.org/10.5089/9781 475563092.001Herradi, M, ‘The Redistributive Impacts of ECB’s Unconventional Monetary Policies:
Evidence From Italian Household Surveys’. Phd Thesis (Working Paper), University of Bordeaux, 2017.
Lenza, M and J Slacalek, How does monetary policy affect income and wealth inequality? Evi- dence from quantitative easing in the euro area. European Central Bank, 2018. Online:
https://doi.org/10.2866/414435
Mishkin, F, ‘Monetary Policy Strategy: Lessons from the crisis’. NBER Working Paper no 16755, 2011. Online: https://doi.org/10.3386/w16755
Monnin, P, ‘Inflation and Income Inequality in Developed Economies’. CEP Working Paper, 2014. Online: https://doi.org/10.2139/ssrn.2444710
Saiki, A and J Frost, ‘Does Unconventional Monetary Policy Affect Inequality? Evidence from Japan’. Applied Economics 46, no 36 (2014), 4445–4454. Online: https://doi.org /10.1080/00036846.2014.962229
Samarina, A and A Nguyenc, ‘Does monetary policy affect income inequality in the euro area?’ DNB Working Paper, 2019. Online: https://doi.org/10.2139/ssrn.3352371 Schnabel, I, COVID-19 and monetary policy: Reinforcing prevailing challenges. European
Central Bank, 24 November 2020.
Stiglitz, J, Conquering the great divide. International Monetary Fund, 2020. Online: www.
imf.org/external/pubs/ft/fandd/2020/09/COVID19-and-global-inequality-jo- seph-stiglitz.htm