THE INTEGRATON BY TRADE AND FDI OF EMERGING ECONOMIES: THE ASEAN EXAMPLE
1ANIKÓ MAGASHÁZI1
1PHD-student, International Relations Multidisciplinary Doctoral School, Corvinus University of Budapest
E-mail: a.magashazi@gmail.com
The paper investigates the role of regionalization and regional identity in the endeavours of emerging economies to connect successfully to the global world economy. It addresses the question of whether the Association of Southeast Asian Nations (ASEAN), with its loose institutional integration framework, has contributed to the global integration of its very heterogenous members in the first decade of the 21st century – and, if so, what are the drivers behind this. The paper summarizes connecting theories, using a multidisciplinary approach, and uses descriptive statistical analysis to identify the achievements of the ASEAN-6 countries within global trade and foreign direct invesment (FDI) flows in the given time period. We suggest that ASEAN countries, with their efforts to initiate interconnecting regional organizations in Asia, most specifically the ASEAN+3 (APT) construction, did contribute to greater integratedness of member countries; and they have created a regional image with a common market and production base. Such achievements, however, can be in great part attributed to the micro-level activities of international and regional firms wishing to establish cross-border production networks in these countries.
Keywords: ASEAN, regional integration, FDI, production networks JEL-codes: F13, F15
1 The research was supported by the European Union and the State of Hungary, co-financed by the European Social Fund within the framework of TÁMOP-4.2.4.A/2-11/1-2012-0001 ’National Program of Excellence’-convergence program for the elaboration and execution of a national personal support system for students and researchers. The project is implemented with the support of the European Union and co-financed by the European Social Fund.
1
1. INTRODUCTION
ASEAN was established less than a decade after the European Economic Community was created with the Treaty of Rome, though the development of the two organizations for integration followed very different paths.
Much has been published on the nature of the European Union as an organisation for the cooperation of sovereign “like-minded” nation-states with its strengthened institutional framework and growing aspects of supranationalism. ASEAN, as a form of integration, has been less studied in the European economic literature, and it is argued that it shows very few results in terms of a real integration process. The association is seeking to unite very heterogeneous nations both in terms of their political systems and their economic development levels, and all in a non-binding, non-interfering, consensus-driven way even today, close to the 50th anniversary of its foundation with the Bangkok Declaration.
The question arises if there were missed decades from the point of view of the development of integration - or do Southeast Asian regionalization tendencies have to be seen through different spectacles compared to European ones? We aim to explore whether the member countries and their companies have benefitted from the existence of ASEAN in their global competition.
Furthermore, one needs to note that the regional cooperation of ASEAN member countries has encompassed in the last decade several interconnecting regional organizations from Asiatic and Transatlantic nations. Thus, we claim, that any analysis of intragroup relations should be extended to a broader sphere, first of all to the ASEAN+3, whose partnership grew in the aftermath of the 1997/98 Asian financial crisis.
There is a widespread view among economists that growth and development in the 21st century will be spearheaded by Asia (following the US dominance of the 20th century, with the 19th century being Europe’s). In terms of peace and security of historically hostile neighbouring nations, Europe has experienced different ways of managing its international relations - with sometimes successful outcomes for the set goals. It may not be by chance
2 that the ASEAN Vision 2020 signed in December 1997 uses the phrase of “the Concert of Southeast Asian Nations” as a way of safeguarding peace and security – just as the Alliance between nations after the Napoleonic wars in nineteenth century, which earned the name the “Concert of Europe” from historians.2
2. THEORETICAL BACKGROUND
In identifying forces behind the special character of ASEAN integration a multidisciplinary approach seems most appropriate.
Scholars of international relations (IR), look at the question of rules versus relations in regional governance, when aiming to understand how ASEAN has been able to achieve several decades of peace and economic development in spite of its loose framework. They claim that “the ASEAN way” cannot be explained purely by mainstream IR theory – as it is based less on rules and more on relations. Thus governance in a regional organization with partly Confucian societies can be seen more in relational terms, where the unit of analysis is relations among individual actors, and how these relations harmonize during the process.
(Yaquing 2001). Several Asian scholars claim that in its still informal, softly institutionalizing way, the post-1997/98 financial crisis ASEAN represents an evolving security and economic community – and via this process ASEAN has begun to create its own regional identity.
Critics to this approach argue that scholars for constructivist preferences misinterpreted government declarations of developing an East-Asian identity and still today interstate relations are predominant and the notion of East-Asian regionalism steered by ASEAN is illusionary (Jones – Smith 2007b).
Hettne’s distinction between regionalism and regionalization - the first meaning a top-down process initiated by governments, while the latter “an empiricial trend depicting a multidimensional process of regional change that occurs simultaneously at several levels of social, political and economic interactions in a bottom up process” (Wunderlich 2008) - aims to bridge the macro and micro level analysis.
2 The consensus-driven alliance of Britain, the Austrian Empire, Prussia, the Russian Empire and France, ensured the balance of power in Europe from the Vienna Congress (1815) until World War I by settling disputes through a congress system directed jointly by the five main European economic and military powers of the era.
3 Scholars of economics and business also emphasize the special character of ASEAN. Based on the Southeast Asian experience, Das introduced the terminology of market-driven integration. He claims, that “microeconomic decision-making in large firms, particularly transnational corporations (TNCs) played an active role in the spread of regionalization” (Das 2005: 1). While ASEAN member countries – primarily the ASEAN-63 – individually pursued an outward-oriented development strategy, regionalization appeared as a by-product of the course of implementation of their national strategies via expansion of trade, investment, technology and subsequent migration flows initiated by the private sector in a bottom-up process. TNCs not only created, but also “influenced the process of regionalization by lobbying their governments for facilitating regulatory changes so that market forces can be freed to operate in the macro-region” (Das 2005: 2).
We argue that all these elements have to be considered when discussing the quality of the ASEAN integration and measuring the advantages for its member countries.
Some conceptual definitions are in order. For a general definition of regional integration, the classification of Béla Balassa (1961) will be used (Free Trade Area, Customs Union, Common Market, Single Market, Economic Union). The definition of production networks of firms will include horizontal linkages of companies, relocating manufacturing according to comparative advantages of countries/industries, as well as vertical linkages of transnational corporations’ networks with fragmented manufacturing processes across borders. The literature offers symbolic models for these. In the Fying Geese model, Japanese production in industries of lower technological levels are transferred to less developed Southeast Asian countries (Akamatsu 1935, cited by Xing 2007). Akamatsu’s later publications in 1961 made it clear that the model served to explain the catching up process and shows high similarity with Vernon’s product life cycle model published only in 1966 (Shigehisa 2004). The model is typically applied for the 1960-90 period.
Vertical linkages of TNC’s networks after the Plaza Accord4 in 1985 and the rise of China is illustrated in the model of “Bamboo Capitalism”. The model is characterised by
3 Indonesia, Malaysia, Philippines, Brunei Darussalam, Singapore, and Thailand
4 Refers to the agreement signed by the US, Japan, Germany, UK and France in the New York Plaza hotel to offset trade surpluses in Japan and Europe against the US, causing a 50% appreciation of the yen against the dollar.
4 segmentation of production, where lower-tech components tend to be manufactured in ASEAN countries, and higher-tech components in the newly industrialized states (NIES) and Japan. Final goods from all shipped components are be manufactured in a location from where it is then exported to the main foreign markets in the US, EU and Japan. The most recent model, the Water Lily model describes industry clusters with broader agglomerations created first in Japan, later in Korea, then in China (Han et al. 2012) with substantial FDI inflow. The literature has wide range of theories: global value chains, global productions networks, cross-border production networks around the same process focused on the activity of TNCs.
Based on these theories, the following conceptual statements will be examined in the research regarding Southeast Asian countries:
The results from economic integration have to be seen in a broader geographical context, for which, alongside ASEAN intra-trade and intra-investment relations, ASEAN+3 has to figure as unit of analysis as well.
The implications of the 2008 global crisis have necessitated a greater level of insitutionalization within ASEAN, also joined in certain areas by China, Japan and South Korea (referred to as the ‘+3’ countries from APT).
3. AN EVOLVING INSTITUTIONAL FRAMEWORK FOR THE ECONOMIC INTEGRATION OF ASEAN MEMBER COUNTRIES
4.1 Free Trade Zone
The ASEAN Free Trade Agreement (AFTA) was set in motion in 1993; and with a 15-year implementation period it has been the first institutional framework to proceed closer to member country integration whilst giving a competitive edge to an enlarged export platform and production base for FDI inflows into the region. AFTA was signed by all newcomer countries by 1999. A constantly reduced Common Effective Preferential Tariff (CEPT) has been applied to goods originating in ASEAN, including where there is an at least 40% ASEAN
5 local content. Even though full concensus was achieved on AFTA implementation, the heterogeneous background of participating economies did lead to delays.
There is discussion in the literature whether the expansion of ASEAN with the CLMV countries (Cambodia, Laos, Myanmar, Vietnam) has slowed down the targeted pace of integration set forth in the AFTA. According to Roberto C. Solferino, former Secretary General of ASEAN, “what has slowed down ASEAN economic integration has been the foot- dragging by some of the ASEAN-6 rather than the presence of the ASEAN-4. ASEAN had to devise new rules to accommodate the delay in Malaysia's inclusion of motor vehicles in the coverage of AFTA, and the Philippines subsequently asked for the same treatment for its petrochemical products” (Solferino 2007: 38).
4.2. The way towards a Single Market and Production Base
The ASEAN Charter, which entered into force in December 2008, represents for the first time in ASEAN’s history a signed, legally binding agreement among the 10 member states. It codifies ASEAN norms and sets clear targets for ASEAN to establish, by 2015, a single market and production base. To track progress towards the AEC 2015, a scorecard mechanism has been developed. The concensus on AEC 2015 is an important milestone leading to the four freedom principles, like the ones agreed by European Union member countries under the Single European Act in 1986, yet it is still to be implemented.
The principle of the free flow of goods can build on the achievements of AFTA which reduced the average tariff to 0.9% in 2009 from 4.4% in 2000 (Journal of E-Governance 2012: 171). The ASEAN Trade in Goods Agreement (ATIGA) aims to eliminate non-tariff barriers. The ASEAN Framework Agreement on Services (AFAS) aims at the liberalization of the flow of services in several important service categories5 by 2015. The free flow of services can be supported by the seven mutual recognition arrangements (MRAs) to provide greater mobility of qualified service professionals. The free flow of skilled workers (and not of the people as in the EU) would be a backbone for a single production base. The movement of skilled labour to a large
5 Business services, professional services, construction, distribution, education, environmental services, healthcare, maritime transport, telecommunications, and tourism.
6 extent already takes place within the production networks organized by TNCs. A more cautious approach is being taken regarding the liberalization of capital and investment, “the fourth principle of freedom”; the ASEAN Charter targets “freer” and not a free flow of investment and capital. An initiative to facilitate a freer flow of foreign direct investment is the ASEAN Investment Area (AIA), to be implemented for all ten ASEAN countries by 2015.
Critics of the AIA concept question why ASEAN is moving in the direction of global liberalization, as no provision differentiates in favour of ASEAN companies against non- ASEAN TNCs (Masron - Yusop 2012). Others suggest facilitating the movement of labor and firms from loosing to gaining sectors, concentrating on the fact that FDI and production networks in Asia can always keep their distinctive characteristics by promoting industrial upgrading instead of protecting AIA from non–ASEAN TNCs within it.
With foreign exchange and investment controls, the aim is to relax limitations on foreign exchange purchases and other payments for invisible transactions, and not to fully liberalize them. In April 2013, the central bank governors endorsed in principle the ASEAN Banking Integration Framework (ABIF), under which qualifying ASEAN banks will be accorded more flexible access into regional markets (Volz 2013).
Capital account liberalization would limit financially vulnerable member countries in their flexibility to manage exchange rates and impose temporary capital controls if monetary/fiscal policies are not sufficient to mitigate risk. Joseph Stiglitz argues that Malaysia’s own solution, without IMF help – namely, introducing one year capital movement limits during the 1997/98 crisis – has given better results to its recovery than the IMF plan implemented in Indonesia (Stiglitz 2002).
A new development for institutional coordination is the Chang Mai Initiative Multilateralization (CMIM), which was signed after 10 years of preperation, in 2009. CMIM is a complex framework of Bilateral Swap Agreements (BAs) among the member countries to enable efficient surveillance programs in cases of crisis. CMIM’s major step was to set up the ASEAN+3 Macroeconomic Research Office, in Singapore, in April 2011; and tomake a decision in May 2012 to double the amount available under the CMIM to US$240 billion.
CMIM is the most encouraging step in financial integration, and it clearly supports this paper’s research argument, i.e. that the integration of the ASEAN countries has to be seen in the context of ASEAN+3. The size of the facility is still low, though, compared to the
7 immediate funds needed during 1997/98 for surveillance programs for ASEAN countries. In designing futher financial integration, ASEAN economists and politicians have carefully assessed the experience of the EU during the 2008 crisis to draw conclusions and avoid similar failures (Volz 2013). There is a common view that ASEAN countries must come to an agreement on the mid term regarding transferring a certain degree of sovereignty to a regional supervisory body to safeguard financial stability in the integrated area.
4. INTEGRATION OF THE ASEAN-6 MEMBER COUNTRIES
Developments for the five founding ASEAN member and the high-income Brunei Darussalam, will be reviewed in this section, for they give a good picture of the process of the association’s integration in the first decade of the 21st century.
5.1. Trade and Integration
Analysis in this section focuses on a country by country basis to evaluate the state and dynamics of their integration. The great heterogenity of the ASEAN-6 countries in terms of local market size, development level and economomic strategy is represented in the key indicators of their openness and dependency on external trade relations, either within ASEAN or outside it in Table 1. Four countries - Singapore, Brunei, Malaysia and Thailand - demonstrate high export intensity, with annual total exports exceeding two thirds of the GDP measured at current prices in 2011.
Table 1. Key trade-related integration trends in the ASEAN-6 countries
2000 2005 2008 2009 2011
Brunei
Total exports (X) /GDP (%) 36.16 66.85 69.18 66.15 77.21
Total imports/GDP (%) 17.80 15.78 16.89 22.66 15.04
Trade Balance (in mill USD) 1 101.50 4 866.20 7 761.30 4 701.50 10 172.00 Total exports/P (in mill USD) - 17 214.32 25 798.99 17 615.76 30 585.96
ASEAN X / GDP ( % ) 10.66 16.05 16.71 10.98 10.52
ASEAN X /total X ( %) 23.16 25.30 25.61 13.09 12.63
ASEAN + 3 X/total X (%) 78.47 78.31 82.21 77.44 78.17 Exports to Asia/total X (%) 83.85 88.89 98.18 97.79 99.11 Indonesia
Total exports/GDP (%) 37.53 30.08 26.71 21.32 24.03
8
Total imports/GDP (%) 20.24 20.26 25.18 17.72 20.95
Trade Balance (in mUSD) 28 609.20 27 959.10 7 823.10 19 680.80 26 061.10 Total exports/P (in mill USD) - 389.63 599.59 503.57 856.21
ASEAN exports /GDP (%) 6.58 5.56 5.30 4.51 4.97
ASEAN X/total X (%) 17.52 18.47 19.83 21.13 20.69
ASEAN+3 X/total X (%) 52.12 55.59 55.22 53.94 56.57
Exports to Asia/total X (%) 65.03 70.68 72.27 71.49 72.97 Malaysia
Total exports/GDP (%) 108.67 101.81 87.14 81.21 79.25
Total imports/GDP (%) 20.24 20.26 25.18 17.72 20.95
Trade Balance (in mill USD) 18 507.00 26 257.30 26 257.40 33 560.40 40 636.30 Total exports/P (in mill USD) - 5 376.24 7 014.15 5 542.48 7 878.02
ASEAN exports/GDP (%) 27.02 26.55 22.58 20.90 19.47
ASEAN X /total X (%) 27.55 26.56 26.08 25.83 25.73 ASEAN + 3 X/total X (%) 45.33 45.96 45.39 50.05 51.27 Exports to Asia/total X (%) 58.98 61.65 62.80 67.32 68.69 Philippines
Total exports/GDP (%) 43.68 41.77 28.27 22.73 21.42
Total imports/GDP (%) 46.09 32.66 32.66 27.00 28.40
Trade Balance (in mill USD) 3 587.40 -6 163.50 -7 620.20 -7 199.20 -15 667.20 Total exports/P (in mill USD) - 483.86 541.97 415.66 501.31
ASEAN exports/GDP (%) 7.99 7.24 4.08 3.46 3.85
ASEAN X /total X (%) 15.65 17.34 14.43 15.20 17.97
ASEAN + 3 X/total X (%) 35.12 48.07 46.37 43.64 53.54 Exports to Asia/total X (%) 50.66 64.55 62.99 57.69 68.24 Singapore
Total exports/GDP (%) 149.29 114.81 174.74 146.81 157.56 Total imports/GDP (%) 145.33 159.60 165.23 133.72 140.73 Trade Balance (in mill USD) 3 672.30 29 641.30 18 395.60 24 047.80 43 734.40 Total exports/p (in mill USD) - 53 868.75 69 885.49 54 096.33 70 545.74
ASEAN exports/GDP (%) 40.77 57.39 56.04 44.42 49.08
ASEAN X/ total X (%) 27.34 31.34 31.99 30.17 30.98
ASEAN + 3 X/total X (%) 42.32 48.90 49.71 49.07 49.58 Exports to Asia/total X 60.43 60.10 56.82 56.76 72.27 Thailand
Total exports/GDP (%) 55.87 62.17 64.10 57.76 66.17
Total imports/GDP (%) 50.37 66.91 65.06 50.66 66.53
Trade Balance (in mill USD) 6 765.60 -8 368.30 -2 600.80
18
727.60 -1 262.90 Total exports/P (in mill USD) - 1 683.94 2 631.79 2 279.38 3 385.07
ASEAN X/GDP (%) 10.75 13.53 14.47 12.31 20.89
ASEAN X/total X (%) 19.34 21.99 22.57 21.32 24.28
ASEAN + 3 X/total X (%) 39.99 45.89 45.04 44.07 48.85 Exports to Asia/total X (%) 59.71 61.94 59.65 63.04 64.02 Source: author’s calculations based on ASEAN Statistical Yearbook (2008, 2012).
9 Asian countries have traditionally had active intra-trade relations within their continent.
Among Asian economies “the share of intra-trade in total trade was 45.5 percent in 1928 and in the 1950s it stabilized at around 41 percent” (WTO, 1995). The share increased further, reaching 64% to 99% in each of the countries by 2011 as a result of their interconnectedness through production networks. According to assessments of the Monetary Authority of Singapore (MAS) based on input-output tables for Asian economies (excluding Japan), 78 percent of Asian exports aimed at extra-regional destinations were directly or indirectly processed in the other Asian economies and benefited from intra- regional production networks (Das 2005).
The hypothesis to include the three APT countries to thereby examine the potential benefits of ASEAN integration for member countries, in successfully positioning themselves globally, can be supported by a set of arguments. Following the 1997/98 financial crisis, the ASEAN member countries put an emphasis on increasing their regional ties with the large economies of the region. Free trade agreements were negotiated and signed between ASEAN and the +3 countries individually. APT’s share in case of each individual country is around or more than 50%, while their intra-ASEAN interconnectedness through exports represented only 12-31% in 2011.
Thailand’s increasing intra-ASEAN share suggests increasing integration not only via the existence of global companies but with regional ones too from Singapore and Malaysia. All countries experienced a decrease in their intra-ASEAN export share in 2009, when the global crisis hit Southeast Asia, through severely reduced commercial orders from their global counterparts and a sudden halting of liquidity for their domestic corporations from financial markets. After the timely intervention of individual governments, key integration and trade performance parameters again showed an upward trend, blowing away the short but deep recession.
Four of the ASEAN-6 countries (Brunei, Malaysia, Singapore and Thailand) have shown substantially increasing positive trade balances over the last decade as a success parameter of their export-oriented development strategies; while current account balances gave positive results in all ASEAN-6 countries, with outstanding figures in the case of Brunei (37%
of GDP), Singapore (25%) and Malaysia (11%) in 2011 (ASEAN Statistical Yearbook 2012: 51).
10 Looking at the trade relations of the ASEAN region as a whole, only a slowly increasing intra- ASEAN interconnectedness can be observed between 2000–2011, with intra-trade growing from 22.74% to 24.62 %.
Table 2. ASEAN Trade Share by trading partner (%)
Trading partner 2000 2005 2008 2009 2010 2011 intra-ASEAN 22,74 24,86 24,85 24,31 24,62 24,26
China 4,40 9,21 10,48 11,72 12,15 12,56
Japan 16,06 12,45 11,23 10,41 10,98 10,65
RoK 3,90 3,92 4,13 4,86 4,82 6,09
ASEAN+3 47,39 50,75 51,17 51,3 52,86 52,7
Source: ASEAN trade statistics database, IMF Direction of trade statistic, ADB.
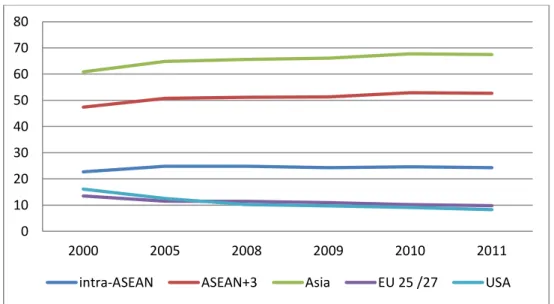
The robust increase of China’s share is a main factor behind the growing importance of Asia on account of the considerably dropping share of the US and to a lesser extent that of Japan and the EU, as shown in Figure 1. The new China–centered cross-border production network model, closely involving the ASEAN countries, has played a decisive role behind these trade developments, as a large volume of components exports move from ASEAN to China, and then leave, after assembly, to their final destinations on the world market.
Figure 1. ASEAN Trade Share by trading partner (%)
.
Source: author’s calculations based on ASEAN trade statistics database, IMF direction of trade statistics,
0 10 20 30 40 50 60 70 80
2000 2005 2008 2009 2010 2011
intra-ASEAN ASEAN+3 Asia EU 25 /27 USA
11 5.2 FDI and integration
The annual FDI inward flow into the ten ASEAN countries more than quintupled between 2000-2011, amounting to USD 114 billion in 2011, and more than 92% of these flowed to the ASEAN-6 countries.The surge of FDI into the region is closely interrelated with the growing trade integratedness, as discussed in section 4.1.
Table 3. Selected FDI flow parameters of ASEAN-6 countries for measuring integratedness
The two ASEAN economies with economic performance indicators matching the developed countries - Brunei and Singapore are, overall, net intra-ASEAN capital exporters. Singapore plays a major role in the intra-ASEAN FDI both as capital exporter and importer. Malaysia’s FDI results show impressive development trends. While Malaysia is the recepient of 30-40%
of FDI inflows from ASEAN countries, its intra-ASEAN positive net FDI balance in 2008-2009 amounted to a cumulative value of 4.5 billion USD, demonstrating strong interconnectedness and also benefits for the Malaysian economy. Besides Malaysia, Indonesia and Thailand have become integral parts of region-wide production networks, set
2000 2005 2008 2009 2011
Brunei
intra-A Cm-Cx* ( in mill USD) -22.50 -8.70 -86.40 -122.90 -80.10 Share in intra-A FDI** (%) 1.40 0.70 0.90 2.00 0.60
Indonesia
intra-A Cm-Cx ( in mill USD) -342.20 727.00 2 530.90 411.50 6 977.20 Share in intra-A FDI (%) n.a 3.70 8.90 15.40 5.20
Malaysia
intra-A Cm-Cx ( in mill USD) 170.90 -634.20 -1 777.10 -2 692.20 178.40 Share in intra-A FDI (%) 33.70 32.20 35.20 41.80 20.00
Philippines
intra-A Cm-Cx ( in mill USD) 33.30 -66.00 528.90 405.40 -234.40 Share in intra-A FDI (%) 16.50 1.60 n.a. n.a. 0.50
Singapore
intra-A Cm-Cx ( in mill USD) -719.50 -1 426.40 -3 840.00 572.90 1 633.50 Share in intra-A FDI (%) n.a. 61.00 47.40 35.20 44.10
Thailand
intra- A Cm-Cx ( in mill USD) 614.00 -1 426.40 -308.50 872.30 -362.10 Share in intra-A FDI (%) 51.06 0.20 8.40 9.40 2.60 Source: author’s calculations based on ASEAN Statistical Yearbook (2008, 2012)
*intra-ASEAN capital imports minus capital exports **Share in intra-ASEAN FDI
12 up chiefly by Japanese companies with strong inter-regional in-and outward FDI, and a high level of annual total inward FDI as well. 85% of all Japanese investments to ASEAN went into these three countries in 2011. The FDI performance of the Philippines is behind the five other countries, surpassed by Vietnam from the CLMV group.
6. ASEAN AND EU RELATIONS
The growing attractiveness of the region can be seen when looking at the increasing trend of FDI flows from EU investors into Asia; though there were cyclical tendencies following the dot.com and 2008 global crises, and an expanding share of ASEAN capital importer countries in 2006-2012 compared to 2001-2005 (Figure 2.)
Figure 2. EU outward FDI flows to Asia (in million euros), 2001-2012
.
Source: author’s calculations based on Eurostat.
Figure 3. Regional breakdown of outward EU FDI flows to Asia, 2001-2012
0 10000 20000 30000 40000 50000 60000 70000 80000 90000 100000
2001 2002 2003 2004 2005 2006 2007 2008 2009 2010 2011 2012 ASIA ASEAN
13 Source: author’s calculations based on Eurostat.
As shown in Figure 3, close to a quarter of cumulative EU outward FDI into Asia in the period 2001-2012 was realized in ASEAN host countries, out of which the majority went to Singapore, followed by Indonesia. Indonesia’s vast raw material resources and expanding consumer market, with a huge population moving towards being middle class in the next few years, still has unleashed potential. It is to be assumed that such moves will emanate from existing affiliates by ASEAN founding members, especially Singapore and Malaysia.
According to report prepared by the European Commission (2013: 24):
Regarding sales by European affiliates in Singapore, the available data shows that in 2010 EU affiliates sold goods and services at a value of almost €125 billion in Singapore, with a higher share of services. This is almost three times the value of all EU exports to Singapore, which underlines the economic importance of the commercial presence. […] On the other hand, Singapore is the second largest Asian investor in the EU after Japan, but before China and South Korea.
Expanding trade relations (see Table 4.) and FDI trends underline why, in March 2010, the EU first began negotiating with Singapore on a Free-trade Agreement. The agreement is expected to come into force in 2015, and may serve a positive benchmark for FTA negotiations in the pipeline with Vietnam, Thailand and Malaysia. The principal benefits are
Rest of Asia 30%
Hong Kong 20%
China(w/o HK) 16%
Japan 7%
South Korea 4%
Singapore 59%
Rest of ASEAN 8%
Indonesia 12%
Malaysia 8%
Thailand 4%
Philippines 3%
ASEAN 23 %
14 less in relation to regular tariff reductions, since Singapore already applies zero customs duties towards the EU. The agreement contains much more important commitments on services, government procurement and public tendering than under respective WTO commitments. Equally important is the removal of technical barriers to trade, such as duplicated testing requirements for motor vehicles and parts, electronics or certain green technologies. The implementation of the AEC 2015 to achieve a more integrated ASEAN will most likely lead in the mid-term to a regional EU-ASEAN FTA framework. As stated by the EuropeanCommission (2013: 24):
With €191 billion of trade in goods in 2012 and €51 billion services in 2011, the Association of Southeast Asian Nations (ASEAN) is today the EU's third largest trading partner outside Europe, after the US and China, but well ahead of other trade partners like the Mercosur group (€123 billion), India (€98 billion), Canada and South Korea (€89 billion each).
As seen in previous sections, the strongest correlation can be observed between FDI intensity and integratedness in ASEAN countries. For the sake of comparison with developed ASEAN economies, such as Singapore and Brunei, FDI/GDP figures for the small, open, and developed Western European country Belgium are also shown in Table 6. The figures depict a clear trend of global integration of all ASEAN countries in the chosen time period.
Singapore’s huge FDI stock/GDP ratio is an exception even compared to Belgium, being a result of conscious policy-building on FDI in development, an important step in the process of safeguarding Singapore’s sustainable attraction as a location over decades. The impact of productivity spillovers to domestic businesses can be also observed on core indicators (including GDP per capita, business R&D expenditure)6 for Singapore. Meanwhile, a new generation of local engineers and production managers employed by TNCs became entrepreneurs and part of the rapidly growing outsourcing electronic manufacturing services market with their own companies moving abroad in the region (e.g. Venture Corp and WBL).
Their successs can be seen in outward FDI stock/GDP trends, which demonstrate a highly developed country with a strong footing in other ASEAN member countries (Table 6).
Besides the high inward FDI integratedness of Brunei, Malaysia and Thailand, it is important to note here the high inward FDI stock/GDP ratios of Vietnam and Cambodia.
6 For more details on measuring FDI spillovers, see Szent-Iványi-Vigvari(2012).
15 Table 6. Inward and outward FDI stocks in the ASEAN countries
Inward stock /GDP (%) Outward stock/FDI (%)
Countries 1990 2000 2005 2008 2009 2012 1990 2000 2005 2008 2009 2012 Brunei 0.9 64.5 96.8 71.2 98.9 80.0 n.a. n.a. n.a. n.a. n.a n.a.
Cambodia 2.2 43.1 39.3 44.8 49.8 59.4 0.0 5.3 4.2 3.0 3.1 3.0 Indonesia 7.0 15.2 14.4 14.2 20.2 23.4 0.1 4.2 n.a. 0.6 0.7 1.3 Lao PDR 1.5 35.3 25.1 26.9 28.8 27.0 0.1 1.2 0.5 0.2 0.2 n.a.
Malaysia 21.7 54.1 31.0 31.9 39.1 43.6 1.6 16.3 15.4 29.0 39.4 39.7 Myanmar 5.4 44.1 39.3 26.3 24.2 20.6 0.0 0.0 0.0 0.0 0.0 0.0 Philippines 6.7 17.0 14.5 12.5 13.6 12.4 0.8 1.3 2.0 3.3 3.6 3.6 Singapore 78.5 117.2 182.9 226.4 258.7 252.3 26.1 60.2 127.5 131.9 139.3 148.4 Thailand 9.3 24.7 33.3 33.3 39.1 40.7 0.5 2.7 3.4 4.2 6.2 13.5 Vietnam 3.8 47.3 42.4 45.2 50.2 51.6 0.0 0.0 0.0 0.0 0.0 0.0 China 5.1 16.2 11.9 8.3 9.3 10.3 1.1 2.3 2.5 4.1 4.9 6.3 Japan 0.3 1.1 2.2 4.2 4.0 3.5 6.5 5.9 8.5 14.0 14.7 17.8 Korea 1.9 8.2 12.4 10.2 14.5 12.7 0.9 4.0 4.6 10.5 14.4 17.0 Hong Kong 262.3 290.9 319.9 405.5 474.9 552.8 15.5 257.7 310.0 398.6 443.8 509.1 Belgium 28.8 83.9 100.2 168.2 204.4 208.8 20.0 77.3 126.7 160.3 198.8 214.3 Source: author’s calculations based on UNCTAD STAT FDI Database
There is an increasing amount of cooperation between the EU and ASEAN, as evidenced by the Asia-Europe Meeting (ASEM), initiated in 1996 and the Asia-Europe Foundation (ASEF) Program. The multilateralization of the integration process in Asia is moving forwards. The most recent development initiative is the Regional Comprehensive Economic Partnership (RCEP). RCEP is a Free Trade Agreement (FTA) scheme from the 10 ASEAN Member States and their FTA Partners (Australia, China, India, Japan, Korea and New Zealand), to be concluded by the end of 2015. This region would include more than 3 billion people and would possess a combined GDP of about $17 trillion and account for about 40 percent of world trade.
7. CONCLUSION
16 The paper examined whether the different path of cooperation among ASEAN countries compared to Europe, based on non-interference, concensus-driven decisions and informal processes, had led to a meaningful level of integration among of the countries - and if the answer here is yes, then why?
It was hypothised that the formation of broader regionalization circles initiated by ASEAN necessitates the assessment of integration factors at least in connection with the ASEAN+3 countries. Trade statistics show that while the intra-ASEAN trade share only slightly increased, reaching only 24% - which is marginal compared to intra-EU trade activity - the intra-ASEAN+3 trade share grew from 47%-53%, to a level which points to a more deeply integrated region. China and the Republic of South Korea have especially seen their trade shares increase.
With regard to FDI movements, Japanese companies were pioneers in the strategy of creating production networks involving several ASEAN countries with different comparative and competitive advantages. Even after the 2008 global crisis, when serious setbacks were experienced in the Japanese FDI, Japanese firms did not withdraw from Southeast Asia.
Japan’s drop in trade share is to be seen in the context of the economic rise of China.
Increasing FDI flow and stock figures in most ASEAN countries show the dominent role of inward FDI in development. The market-driven integration generated by mainly private actors, TNCs and their supplier base, often has been followed and thus further supported by initiatives on the macro-level.
Regionalization is taking place not only within ASEAN, in the form of dialogue, but is being extended to broader circles, including Asia, the US and Europe - which reflects the idea that the ASEAN way is borrowing from Confucian traditions involving more relations and fewer rules. The challenges of the 1998 and 2008 crises have however initiated a more integrated and partly rule-based framework for ASEAN, especially in the field of future financial integration. Increasing intergovernmental interactions still mainly follow necessities of the ASEAN business environment of dense cross border production networks created by TNCs with tasks for the governments to support productivity spillovers, knowledge and expertise
17 transfer to the benefit of region. These developments can offer valuable lessons for the emerging Central and Eastern European countries as well.
The paper did not deal with the question of development divides within ASEAN, and between ASEAN-6 and ASEAN-4, which may be further topics for research. This is a crucial issue that needs tackling by ASEAN members to release the potential of the 600 million- strong region that will soon have a larger middle class than BRICs countries combined.
References:
ASEAN (2008): Statistical Yearbook. Jakarta: ASEAN Secretariat ASEAN (2012): Statistical Yearbook. Jakarta: ASEAN Secretariat
Balassa, B. (1961): The Theory of Economic Integration. Homewood, IL: R. D. Irwin.
Das, D. K. (2005): Market-Driven Regionalization in Asia. Global Economy Journal 5(3):
Article 2.
European Commission (2013) The economic impact of the EU–Singapore Free Trade Agreement. Brussles: European Commission’s Directorate-General for Trade.
Haggard, S. (1990): Pathways from the Periphery: The Politics of Growth in the Newly Industrializing Countries. Ithaca and London: Cornell University Press.
Han, T. – Oh, K. – Yoo, I. (2012): From Bamboo Capitalism to Water Lily: LCD Industry in East Asian Countries. Singapore: IACSIT Press.
Jones, D. M. – Smith, M. L. R. (2007a): Making Process, Not Progress: ASEAN and the Evolving East Asian Regional Order. International Security 32(1): 148-184.
Jones, D. M. – Smith, M. L. R. (2007b): Constructing communities: the curious case of East Asian regionalism. Review of International Studies 33(1): 165-186.
Journal of E-Governance (2012): Asean Single Market and Production Base in 2015. 35(4):
171-174.
Kasahara, S. (2004): The Flying Geese Paradigm: A Critical Study of its application to East Asia in regional development. UNCTAD Discussion Paper No. 169. April.
Li, J. S. (2003): Relation-based versus Rule-based Governance: an Explanation of the East Asian Miracle and Asian Crisis. Review of International Economics 11(4): 651-673.
Masron, T. A. – Yusop, Z. (2012): The ASEAN investment area, other FDI initiatives, and intra – ASEAN foreign direct investment. Asian-Pacific Economic Literature. Crawford School of Public Policy: The Australian National University and Wiley.
Monetary Authority of Singapore – Economic Policy Group (2010): Macroeconomic Review 9(1).
O’Callaghan, B. A. – Uprasen, U. (2012): A Qualitative Analysis of the Impact of the Fifth EU Enlargement on ASEAN. ASEAN Economic Bulletin 29(1): 46-64
Palánkai, T. – Kengyel, Á. – Kutasi, G. – Benczes, I. – Nagy, S. Gy. (2011): A globális és regionális integráció gazdaságtana. [The economics of global and regional integration.]. Budapest: Akademia Press.
18 Siah, K. L. – Choong, Ch. K. – Yusop, Z. (2009): AFTA and the intra-trade patterns among ASEAN-5 economies: Trade – enhancing or trade-inhibiting? International Journal of Economics and Finance 1(1).
Solferino, R. (2007): The ASEAN Developmental Divide and the Initiative for ASEAN Integration. ASEAN Economic Bulletin 24(1).
Stiglitz, J. (2002): Globalization and its discontents. New York: W. W. Norton.
Szent-Iványi, B. – Vigvári, G. (2012): Spillovers from Foreign Direct Investment in Central and Eastern Europe. Society and Economy 34(1): 51–72.
Volz, U. (2013): ASEAN Financial Integration in the Light of Recent European Experiences.
Journal of Southeast Asian Economies 30(2): 124-42.
Wunderlich, J-U. (2007): Regionalism, Globalisation and International Order: Europe and Southeast Asia. Aldershot, Hampshire: Ashgate Publishing Ltd.
Xing, L. (2007): East Asian Regional Integration: From Japan-led “Flying-geese” to China- centred “Bamboo Capitalism”. Aalborg University Center for Comparative Integration Studies Working Paper no 3.
Yaquing, Q. (2011): Rules vs Relations, Drinking Coffee and Tea, and a Chinese Approach to Global Governance. Journal of E-Governance 35: 171–174.
WTO (2013): Trade to remain subdued in 2013 after sluggish growth in 2012 as European economies continue to struggle. Geneva: WTO Press Release 688, 10 April.