nanomaterials
Article
Hydrothermal Synthesis and Gas Sensing of Monoclinic MoO 3 Nanosheets
Teodóra Nagyné-Kovács1 , Levente Studnicka1, István Endre Lukács2, Krisztina László3 , Pawel Pasierb4, Imre Miklós Szilágyi1,* and György Pokol1,5
1 Department of Inorganic and Analytical Chemistry, Budapest University of Technology and Economics, M ˝uegyetem rakpart 3, H-1111 Budapest, Hungary; kovacs.teodora@mail.bme.hu (T.N.-K.);
studnickalevi@gmail.com (L.S.); pokol.gyorgy@ttk.mta.hu (G.P.)
2 Research Institute for Technical Physics and Materials Science, Eötvös Loránd Research Network, Konkoly Thege M.út 29-33, H-1121 Budapest, Hungary; lukacs.istvan@energia.mta.hu
3 Department of Physical Chemistry and Materials Science, Budapest University of Technology and Economics, M ˝uegyetem rakpart 3, H-1111 Budapest, Hungary; klaszlo@mail.bme.hu
4 Faculty of Materials Science and Ceramics, AGH University of Science and Technology, Al. Mickiewicza 30, 30-059 Kraków, Poland; ppasierb@agh.edu.pl
5 Research Centre for Natural Sciences, Eötvös Loránd Research Network, Magyar tudósok körútja 2, H-1117 Budapest, Hungary
* Correspondence: imre.szilagyi@mail.bme.hu
Received: 31 March 2020; Accepted: 27 April 2020; Published: 7 May 2020 Abstract: Effects of different reaction parameters in the hydrothermal synthesis of molybdenum oxides (MoO3) were investigated and monoclinic (β-) MoO3was prepared hydrothermally for the first time. Various temperatures (90/210◦C, and as a novelty 240◦C) and durations (3/6 h) were used. At 240◦C, cetyltrimethylammonium bromide (CTAB) and CrCl3additives were also tested.
Both the reaction temperatures and durations played a significant role in the formation of the products.
At 90◦C, h-MoO3was obtained, while at 240◦C the orthorhombic (α-) MoO3formed with hexagonal rod-like and nanofibrous morphology, respectively. The phase transformation between these two phases was observed at 210◦C. At this temperature, the 3 h reaction time resulted in the mixture of h- andα-MoO3, but 6 h led to pureα-MoO3. With CTAB the product was bare o-MoO3, however, when CrCl3was applied, pure metastable m-MoO3formed with the well-crystallized nanosheet morphology. The gas sensing of the MoO3polymorphs was tested to H2, which was the first such gas sensing study in the case of m-WO3. Monoclinic MoO3was found to be more sensitive in H2
sensing than o-MoO3. This initial gas sensing study indicates that m-MoO3has promising gas sensing properties and this MoO3polymorph is promising to be studied in detail in the future.
Keywords: hydrothermal; monoclinic MoO3; nanosheet; CrCl3; gas sensing
1. Introduction
Molybdenum oxides (MoO3) are considerable materials among molybdenum (Mo) compounds due to their excellent physical and chemical properties. MoO3is one of the most important starting materials for other Mo compounds, such as for sodium molybdate, ammonium di- or heptamolybdate, or the Mo metal itself. MoO3is also used as a catalyst in the industrial production of acrylonitrile from propylene and ammonia. However, the constant interest in nanomaterials has made also nano MoO3 attractive, which has been proven to be a promising candidate in many fields, e.g., (photo)catalysis, gas sensing, electrochemical cells, or even in forensic science and photothermal therapy [1–13].
MoO3has four allotropes, each composed of differently linked MoO6octahedra, the position of which determines phase stability. The most commonly studied MoO3phases are the thermodynamically
Nanomaterials2020,10, 891; doi:10.3390/nano10050891 www.mdpi.com/journal/nanomaterials
Nanomaterials2020,10, 891 2 of 12
stable orthorhombic (o-) orα-MoO3and metastable monoclinic (m-) orβ-MoO3. Both phases have excellent physical and chemical properties such as refractive index, band gap, and mechanical hardness.
Further crystalline phases are the metastable high-pressureε-MoO3and the relatively more stable hexagonal (h-) MoO3[14–16].
In the case of o-MoO3, octahedra are distorted and form bilayers, which build up the well-known stratified structure. These planar bilayers are composed of chains of MoO6octahedra sharing corners and edges in the specified direction and are held together vertically by weak Van der Waals forces.
In contrast, the crystal lattice of the metastable m-MoO3is similar to the cubic ReO3, where not layered, but 3D crystal structure forms due to the corner-sharing of distorted octahedra in the three directions.
The h-MoO3phase is constructed by such chains in which octahedra are linked by their corners.
These chains connect in such a way to form a hexagonal structure with the typical 1D hexagonal and trigonal channels. The hexagonal channels may contain small ions (e.g., alkali metal or ammonium ions) or water molecules, similar to hexagonal WO3[14–17].
There are several reports about the hydrothermal preparation of MoO3, but mostly only o- and h-MoO3 are synthetized. Although the synthesis of the m-MoO3phase has been carried out by many methods (spray pyrolysis, pulsed laser thin-layer deposition, molecular beam epitaxy, o-MoO3conversion, solution-phase reaction, etc.), it has not been prepared hydrothermally yet in pure form, only as a part of a mixture of MoO3 polymorphs [18]. On the other hand, it would be useful because the hydrothermal method is simple, does not use high temperatures (usually it operates only between 100 and 250◦C), results in highly crystalline, monodisperse products, and metastable phases can be also synthetized by it. Based on the literature, the highest temperatures used in experiments to prepare MoO3are typically 200–210◦C. However, it would be worth trying to use higher reaction temperatures as well, considering how important a small change in the reaction parameters can be during the hydrothermal synthesis in general, regarding the crystalline phase and morphology of the products. Consequently, neither the different reaction times nor the role of CTAB (cetyltrimethylammonium bromide) and CrCl3additives have been studied yet at temperatures above 200–210◦C in the hydrothermal synthesis of MoO3. Furthermore, so far the gas sensing properties mostly of o- and h-MoO3were tested [10,19–30]. To the best of our knowledge, there is only one paper reporting the gas sensing of m-MoO3, where very brief gas sensing data are given using H2O and CO2 as test gases [31].
In the present investigation, we studied different reaction parameters in the hydrothermal synthesis of MoO3, focusing on the changes in the obtained crystalline phases and morphologies.
We investigated the effect of reaction temperature at 90, 210, and 240◦C (using as high as 240◦C for the first time), and duration applying 3 and 6 h reaction times. Finally, we tested CTAB and CrCl3additives for the first time at 240◦C. We examined the crystalline phases and morphologies by X-ray diffraction (XRD) and scanning electron microscopy (SEM), respectively. The as-prepared different MoO3 allotropes were further studied by energy dispersive X-ray spectroscopy (EDX) and specific surface area measurements, moreover by Fourier transformed infrared (FT-IR), Raman, and ultraviolet-visible (UV–Vis) spectroscopies. Their band gap energies were also determined and their gas sensing properties were analyzed towards H2.
2. Materials and Methods
2.1. Materials and Equipment
Ammonium heptamolybdate tetrahydrate (≥99.0%), hexadecyltrimethylammonium bromide (≥96.0%), and chromium(III) chloride hexahydrate (≥98.0%) were purchased from Sigma-Aldrich (Budapest, Hungary) and used as received. Concentrated HNO3(65%) was ordered from Molar Chemicals (Halásztelek, Hungary), while ethanol (96 V/V%) from WVR (Budapest, Hungary).
Ion exchanged water was used throughout the experiments.
Nanomaterials2020,10, 891 3 of 12
For the hydrothermal reactions a 45 mL stainless steel, Teflon-lined autoclave (4744, General Purpose Vessel, Parr Instruments, Moline, IL, USA), and a Nabertherm (Lilienthal, Germany) muffle-furnace (L9/11/B410) were used.
2.2. Hydrothermal Reactions
For every synthesis, 0.5 g of ammonium heptamolibdate (AHM) was dissolved in 25 mL of ion exchanged water, and then 5 mL cc. HNO3was added. To study the effect of various additives, 0.1 g of CTAB or CrCl3was also dissolved in the selected reactions. After stirring the solution for a couple of minutes, it was transferred into the autoclave, which was put into the electric furnace at particular temperatures and for different durations. After the hydrothermal treatment, the precipitates were filtered and washed several times with water and ethanol. Finally, the samples were dried at 60◦C for 2 h.
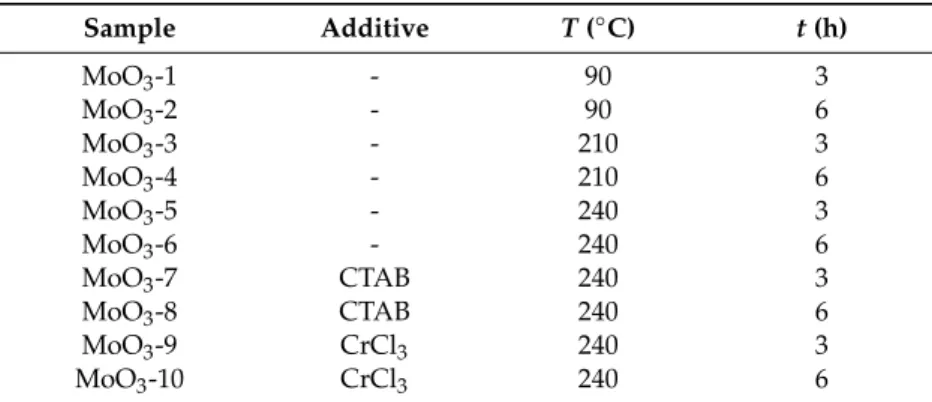
The hydrothermal reactions and their conditions are listed in Table1.
Table 1.Experimental conditions of the hydrothermal reaction between AHM and HNO3.
Sample Additive T(◦C) t(h)
MoO3-1 - 90 3
MoO3-2 - 90 6
MoO3-3 - 210 3
MoO3-4 - 210 6
MoO3-5 - 240 3
MoO3-6 - 240 6
MoO3-7 CTAB 240 3
MoO3-8 CTAB 240 6
MoO3-9 CrCl3 240 3
MoO3-10 CrCl3 240 6
2.3. Characterization
X-ray powder diffraction (XRD) measurements were carried out by a X’Pert Pro MPD diffractometer (PANalytical, Almelo, Netherlands) with Cu Kα radiation (λ = 0.15418 nm). For studying the morphology of the samples, a LEO 1540 XB electron microscope (Zeiss, Oberkochen, Germany) was used, while energy-dispersive X-ray spectroscopy (EDX) analyses were performed using a JEOL JSM 5500-LV instrument (JEOL, Tokyo, Japan). FT-IR spectra were recorded by a Perkin Elmer 2000 FT-IR spectrometer (Perkin Elmer, Boston, MA, USA) between 450 and 4000 cm−1using KBr pellets (1 mg sample/300 mg KBr). Raman spectra were taken by a Jobin Yvon LabRam spectrometer (Horiba, Kyoto, Japan) equipped with an Olympus BX41 optical microscope (Olympus, Tokyo, Japan) using a frequency-doubled Nd-YAG laser (532 nm), while for diffuse reflectance UV–Vis measurements, a Jasco V-570 UV/ VIS/ NIR spectrometer (Jasco, Tokyo, Japan) was used. The band gaps of the products were calculated based on the UV–Vis spectra usingαhυ=A (hυ−Eg)nequation, whereα,hυ, A, andEgare equal to the molar absorption coefficient, photon energy, general constant, and band gap energy, respectively. Thendepends on the type of the electron transition in the compound and is 12 (direct allowed) for MoO3. Using the Tauc-plot, which is plotting(αhυ)2againsthυ, and then drawing a tangent line onto the linear range and extrapolating, the band gap energy can be determined.
The Kubelka-Munk function was used to approximate the value ofA. The N2adsorption was measured at−196◦C with a Nova2000e (Quantachrome) computer-controlled apparatus and the apparent surface area (SBET) of the samples were calculated from the Brunauer–Emmett–Teller (BET) model [32].
2.4. Gas Sensing Tests
For the experiments, Al2O3ceramic sensor plates with interdigital platinum electrodes were used.
First, with the usage of gold paste gold strands were attached onto the electrodes. Then, the sensor plate was affixed to the end of a vertical ceramic tube, and it was connected to a circuit, to which an electrical
Nanomaterials2020,10, 891 4 of 12
resistance meter (HP 34410A) was connected. The samples were suspended in one drop of ethanol in an Eppendorf tube, and a small amount of the suspension was transferred to the electrode. For heating the sensor chips during the gas sensing measurements, an online, temperature, and atmosphere controlled furnace was utilized, which hosted the interdigital electrodes mounted on the vertical ceramic tube (see details in [33]). In the experiments, H2gas with different concentrations (25,000/830/2500/5000/7500 and 10,000 ppm) was used and the carrier gas was N2. After the temperature was set, the gas mixture was introduced to the sample and the change in the electrical resistance of the sensor material was detected. The electrical resistance was measured for 1 h at each concentration.
3. Results and Discussion
3.1. Role of Reaction Temperature and Duration on the Formation of MoO3
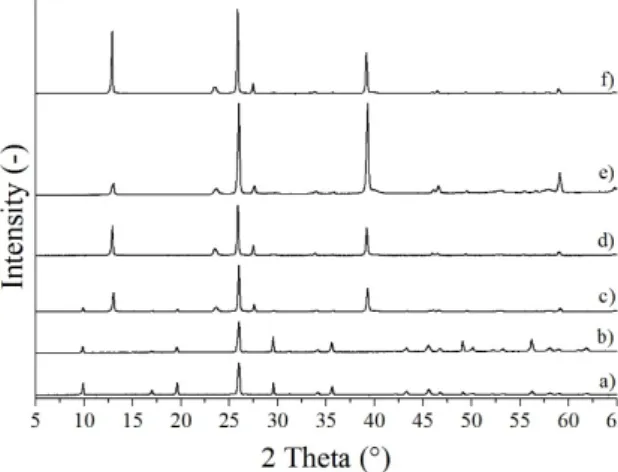
Based on their XRD patterns, MoO3-1 and MoO3-2 were identified as pure h-MoO3(ICDD 065-0033, Figure1a,b). Every reflection belonged to this phase indicating that no contaminations were present.
MoO3-3, which were prepared at 210◦C for 3 h, was composed of the h- and o-MoO3phase (ICDD 01-074-7909); however, the longer reaction duration, namely 6 h, resulted in pure o-MoO3(Figure1c,d).
As the temperature was further increased to 240◦C, at both reaction times pure o-MoO3was obtained (Figure1e,f). All samples were crystalline, demonstrated by the sharp, intensive peaks.
Nanomaterials 2020, 10, x FOR PEER REVIEW 4 of 13
and atmosphere controlled furnace was utilized, which hosted the interdigital electrodes mounted on the vertical ceramic tube (see details in [33]). In the experiments, H2 gas with different concentrations (25000/830/2500/5000/7500 and 10000 ppm) was used and the carrier gas was N2. After the temperature was set, the gas mixture was introduced to the sample and the change in the electrical resistance of the sensor material was detected. The electrical resistance was measured for 1 h at each concentration.
3. Results and Discussion
3.1. Role of Reaction Temperature and Duration on the Formation of MoO3
Based on their XRD patterns, MoO3-1 and MoO3-2 were identified as pure h-MoO3 (ICDD 065- 0033, Figure 1a,b). Every reflection belonged to this phase indicating that no contaminations were present. MoO3-3, which were prepared at 210 °C for 3 h, was composed of the h- and o-MoO3 phase (ICDD 01-074-7909); however, the longer reaction duration, namely 6 h, resulted in pure o-MoO3 (Figure 1c,d). As the temperature was further increased to 240 °C, at both reaction times pure o-MoO3 was obtained (Figure 1e,f). All samples were crystalline, demonstrated by the sharp, intensive peaks.
Figure 1. XRD patterns of the samples synthetized in the hydrothermal reaction of AHM and HNO3
at different temperatures and durations, (a) MoO3-1 (90 °C, 3 h), (b) MoO3-2 (90 °C, 6 h), (c) MoO3-3 (210 °C, 3 h), (d) MoO3-4 (210 °C, 6 h), (e) MoO3-5 (240 °C, 3 h), (f) MoO3-6 (90 °C, 3 h).
According to SEM images, the h-MoO3 phases prepared at 90 °C were crystallized in a well- distinguished hexagonal form at both reaction durations (Figure 2, MoO3-1-2). The rods had a diameter of 7–12 μm when a 3 h duration was applied, and 8–18 μm diameter with a 6 h reaction time; however, their length was 10–50 μm in both cases. It can be also observed that the MoO3-2 sample had a much smoother surface and sharp edges due to the longer reaction time.
In the case of MoO3-3, the sample contained both h- and o-MoO3 phases, whose presence was obvious based on the observed morphologies. In addition to the robust hexagonal rods, 200–500 nm thick fibers formed, with longer (30–50 μm) lengths (in some cases they were broken into shorter, i.e., 1–2 μm pieces), referring to the o-MoO3 phase (Figure 2, MoO3-3). The morphology of MoO3-4 was, however, homogenous, and the sample was composed of 250–800 nm thick and 10–50 μm long fibers owing to the presence of only the o-MoO3 phase (Figure 2, MoO3-4).
When increasing the temperature to 240 °C, both reaction durations resulted in o-MoO3 with fibrous morphology. The diameter of the fibers was 250–800 nm when 3 h was applied, but the fibers became 500–1000 nm thick with 6 h reaction time. Their length was several 10–50 μm in both cases (Figure 2, MoO3-5-6).
Figure 1.XRD patterns of the samples synthetized in the hydrothermal reaction of AHM and HNO3
at different temperatures and durations, (a) MoO3-1 (90◦C, 3 h), (b) MoO3-2 (90◦C, 6 h), (c) MoO3-3 (210◦C, 3 h), (d) MoO3-4 (210◦C, 6 h), (e) MoO3-5 (240◦C, 3 h), (f) MoO3-6 (90◦C, 3 h).
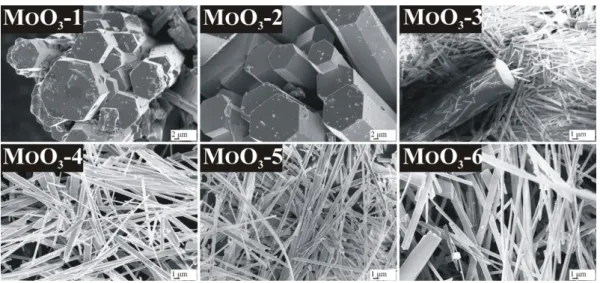
According to SEM images, the h-MoO3 phases prepared at 90 ◦C were crystallized in a well-distinguished hexagonal form at both reaction durations (Figure2, MoO3-1-2). The rods had a diameter of 7–12µm when a 3 h duration was applied, and 8–18µm diameter with a 6 h reaction time;
however, their length was 10–50µm in both cases. It can be also observed that the MoO3-2 sample had a much smoother surface and sharp edges due to the longer reaction time.
In the case of MoO3-3, the sample contained both h- and o-MoO3phases, whose presence was obvious based on the observed morphologies. In addition to the robust hexagonal rods, 200–500 nm thick fibers formed, with longer (30–50µm) lengths (in some cases they were broken into shorter, i.e., 1–2µm pieces), referring to the o-MoO3phase (Figure2, MoO3-3). The morphology of MoO3-4 was, however, homogenous, and the sample was composed of 250–800 nm thick and 10–50µm long fibers owing to the presence of only the o-MoO3phase (Figure2, MoO3-4).
When increasing the temperature to 240◦C, both reaction durations resulted in o-MoO3with fibrous morphology. The diameter of the fibers was 250–800 nm when 3 h was applied, but the fibers became 500–1000 nm thick with 6 h reaction time. Their length was several 10–50µm in both cases (Figure2, MoO3-5-6).
Nanomaterials2020,10, 891 5 of 12
Nanomaterials 2020, 10, x FOR PEER REVIEW 5 of 13
Figure 2. SEM images of the samples synthetized in the hydrothermal reaction of AHM and HNO3 at different temperatures and durations, MoO3-1 90 °C, 3 h, MoO3-2: 90 °C, 6 h, MoO3-3: 210 °C, 3 h, MoO3-4: 210 °C, 6 h, MoO3-5: 240 °C, 3 h, MoO3-6: 240 °C, 6 h.
Based on these results, it was found that the crystalline structure and morphology of the obtained products can be easily influenced by the appropriate choice of reaction temperature and duration. The lower temperature of 90 °C resulted in a pure hexagonal MoO3 structure with the characteristic hexagonal micrometer thick rod-like morphology, whereas the higher temperature, namely 240 °C led to a pure orthorhombic MoO3 phase, which was crystallized in the form of nanofibers. The transformation of the hexagonal to orthorhombic phase could be observed using 210
°C, and 3 h synthesis parameters, where both polymorphs were present with both types of morphologies. However, not only the reaction temperature but also the duration played an important role in this phase transformation, as it took place completely only when a long enough reaction time (6 h) was applied.
3.2. Role of Additives on the Formation of MoO3
When the CTAB additive was used, samples MoO3-7 and also MoO3-8 were identified as pure crystalline o-MoO3, similarly to those reactions, where no additive was used (Figure 3a,b).
Experiments with the addition of CrCl3, however, resulted in a pure, metastable m-MoO3 phase (ICDD 01-085-2405) at both 3 and 6 h reaction durations, which is unprecedented in the literature (Figure 3c,d).
Figure 2.SEM images of the samples synthetized in the hydrothermal reaction of AHM and HNO3at different temperatures and durations, MoO3-1 90◦C, 3 h, MoO3-2: 90◦C, 6 h, MoO3-3: 210◦C, 3 h, MoO3-4: 210◦C, 6 h, MoO3-5: 240◦C, 3 h, MoO3-6: 240◦C, 6 h.
Based on these results, it was found that the crystalline structure and morphology of the obtained products can be easily influenced by the appropriate choice of reaction temperature and duration.
The lower temperature of 90◦C resulted in a pure hexagonal MoO3structure with the characteristic hexagonal micrometer thick rod-like morphology, whereas the higher temperature, namely 240◦C led to a pure orthorhombic MoO3phase, which was crystallized in the form of nanofibers. The transformation of the hexagonal to orthorhombic phase could be observed using 210◦C, and 3 h synthesis parameters, where both polymorphs were present with both types of morphologies. However, not only the reaction temperature but also the duration played an important role in this phase transformation, as it took place completely only when a long enough reaction time (6 h) was applied.
3.2. Role of Additives on the Formation of MoO3
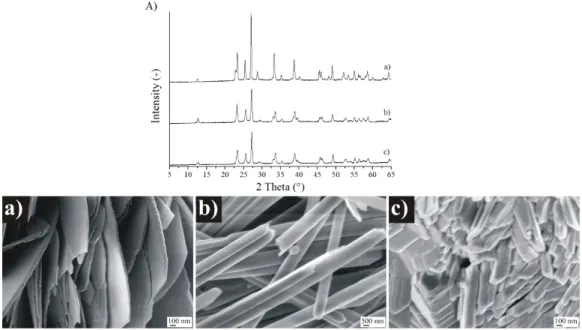
When the CTAB additive was used, samples MoO3-7 and also MoO3-8 were identified as pure crystalline o-MoO3, similarly to those reactions, where no additive was used (Figure3a,b). Experiments with the addition of CrCl3, however, resulted in a pure, metastable m-MoO3phase (ICDD 01-085-2405) at both 3 and 6 h reaction durations, which is unprecedented in the literature (FigureNanomaterials 2020, 10, x FOR PEER REVIEW 3c,d).6 of 13
Figure 3. XRD patterns of the samples synthetized in the hydrothermal reaction of AHM and HNO3
with various additives, (a) MoO3-7 (CTAB, 240 °C, 3 h), (b) MoO3-8 (CTAB, 240 °C, 6 h), (c) MoO3-9 (CrCl3, 240 °C, 3 h), (d) MoO3-10 (CrCl3, 240 °C, 6 h).
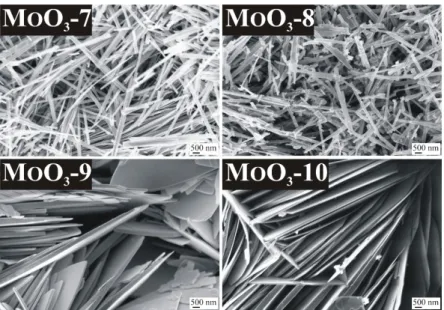
In the case of CTAB additive, the uniform morphology typical of o-MoO3 formed here as well, containing fibers with a diameter of 200–500 nm and a length of 10–30 μm, which were slightly fragmented in the case of 6 h reaction time (Figure 4, MoO3-7-8).
Figure 4. SEM images of the samples synthetized in the hydrothermal reaction of AHM and HNO3
with various additives, MoO3-7: CTAB, 240 °C, 3 h, MoO3-8: CTAB, 240 °C, 6 h, MoO3-9: CrCl3, 240
°C, 3 h, MoO3-10: CrCl3, 240 °C, 6.
The new metastable m-MoO3 was crystallized in the form of nanosheets, in contrast with the former, longitudinal shapes (columns, rods) of the other phases. The sheets had an average thickness of 100–250 nm when 3 h reaction time was applied and it increased to 100–500 nm at 6 h duration, due to the longer reaction time which favored crystal growth. The sheets were 10–20 μm long in both cases and were arranged almost parallel to each other (Figure 4, MoO3-9-10).
Examining the role of the additives, it was concluded that the CTAB additive did not influence the formation of crystalline phases during the reaction, as it also led to pure o-MoO3. On the other hand, CTAB affected the morphology resulting in a significant reduction in the diameter of the fibers.
Without the additive the fiber diameter of o-MoO3 was 250–800 nm and 500–1000 nm, depending on Figure 3.XRD patterns of the samples synthetized in the hydrothermal reaction of AHM and HNO3 with various additives, (a) MoO3-7 (CTAB, 240◦C, 3 h), (b) MoO3-8 (CTAB, 240◦C, 6 h), (c) MoO3-9 (CrCl3, 240◦C, 3 h), (d) MoO3-10 (CrCl3, 240◦C, 6 h).
Nanomaterials2020,10, 891 6 of 12
In the case of CTAB additive, the uniform morphology typical of o-MoO3formed here as well, containing fibers with a diameter of 200–500 nm and a length of 10–30µm, which were slightly fragmented in the case of 6 h reaction time (Figure4, MoO3-7-8).
Nanomaterials 2020, 10, x FOR PEER REVIEW 6 of 13
Figure 3. XRD patterns of the samples synthetized in the hydrothermal reaction of AHM and HNO3 with various additives, (a) MoO3-7 (CTAB, 240 °C, 3 h), (b) MoO3-8 (CTAB, 240 °C, 6 h), (c) MoO3-9 (CrCl3, 240 °C, 3 h), (d) MoO3-10 (CrCl3, 240 °C, 6 h).
In the case of CTAB additive, the uniform morphology typical of o-MoO3 formed here as well, containing fibers with a diameter of 200–500 nm and a length of 10–30 μm, which were slightly fragmented in the case of 6 h reaction time (Figure 4, MoO3-7-8).
Figure 4. SEM images of the samples synthetized in the hydrothermal reaction of AHM and HNO3 with various additives, MoO3-7: CTAB, 240 °C, 3 h, MoO3-8: CTAB, 240 °C, 6 h, MoO3-9: CrCl3, 240
°C, 3 h, MoO3-10: CrCl3, 240 °C, 6.
The new metastable m-MoO3 was crystallized in the form of nanosheets, in contrast with the former, longitudinal shapes (columns, rods) of the other phases. The sheets had an average thickness of 100–250 nm when 3 h reaction time was applied and it increased to 100–500 nm at 6 h duration, due to the longer reaction time which favored crystal growth. The sheets were 10–20 μm long in both cases and were arranged almost parallel to each other (Figure 4, MoO3-9-10).
Examining the role of the additives, it was concluded that the CTAB additive did not influence the formation of crystalline phases during the reaction, as it also led to pure o-MoO3. On the other hand, CTAB affected the morphology resulting in a significant reduction in the diameter of the fibers.
Without the additive the fiber diameter of o-MoO3 was 250–800 nm and 500–1000 nm, depending on Figure 4.SEM images of the samples synthetized in the hydrothermal reaction of AHM and HNO3 with various additives, MoO3-7: CTAB, 240◦C, 3 h, MoO3-8: CTAB, 240◦C, 6 h, MoO3-9: CrCl3, 240◦C, 3 h, MoO3-10: CrCl3, 240◦C, 6.
The new metastable m-MoO3was crystallized in the form of nanosheets, in contrast with the former, longitudinal shapes (columns, rods) of the other phases. The sheets had an average thickness of 100–250 nm when 3 h reaction time was applied and it increased to 100–500 nm at 6 h duration, due to the longer reaction time which favored crystal growth. The sheets were 10–20µm long in both cases and were arranged almost parallel to each other (Figure4, MoO3-9-10).
Examining the role of the additives, it was concluded that the CTAB additive did not influence the formation of crystalline phases during the reaction, as it also led to pure o-MoO3. On the other hand, CTAB affected the morphology resulting in a significant reduction in the diameter of the fibers.
Without the additive the fiber diameter of o-MoO3was 250–800 nm and 500–1000 nm, depending on the duration (3 h and 6 h, respectively), but with CTAB it became much thinner, 100–250 nm and 100–500 nm in the 3 and the 6 h experiments, respectively. In contrast, the addition of CrCl3additive resulted in the formation of the metastable m-MoO3, which has not been prepared by hydrothermal synthesis previously yet. Its role in directing crystal growth also became obvious as it led to nanosheet morphology, presumably due to its favored adherence to certain crystal planes resulting in inhibition of crystal growth in specified directions.
3.3. Further Investigation of the Different MoO3Phases
For a more detailed examination of hexagonal (MoO3-1), o- (MoO3-8), and m-MoO3(MoO3-10) phases, various methods were used.
Results of the specific surface area measurement demonstrated significant differences among the phases, which can be explained by their completely different morphologies (Table2SBET). The smallest (0.21 m2/g) specific surface area belonged to the hexagonal MoO3phase, which was crystallized in the form of the most robust hexagonal rods with a diameter and length of severalµm. The orthorhombic phase had the largest (9.7 m2/g) surface area, which is attributed to its nanofibrous morphology, whereas the size of monoclinic MoO3nanosheets surface was 2.9 m2/g.
Nanomaterials2020,10, 891 7 of 12
Table 2.The specific surface area (SBET) and EDX results of the different MoO3phases, MoO3-1: 90◦C, 3 h, MoO3-8: CTAB, 240◦C, 6 h, MoO3-11: CrCl3, 240◦C, 6 h.
Sample SBET (m2/g) EDX (Atom %)
Mo (Average) O (Average)
MoO3-1, hexagonal 0.21 24.3 75.7
MoO3-8, orthorhombic 9.7 24.8 75.2
MoO3-10, monoclinic 2.9 25.7 74.3
Studying the elemental composition of the phases by EDX, it was found that the ratio of the main elements (Mo, O) was close to the stoichiometric Mo:O=1:3 ratio, and there were no other elements referring to contaminations in the samples.
In the FT-IR spectra, the characteristic metal-oxygen (Mo-O) vibrations in the range below 1000 cm−1can be observed, by the help of which the phases can be distinguished (Figure5A). Since the orthorhombic and monoclinic crystal structures are very similar, their spectrum is hardly different, unlike the hexagonal phase, where the difference is clearly visible. The intensive peak around 1000–900 cm−1refers to the Mo=O band, while the other one at 550–600 cm−1belongs to the Mo-O valence vibration. In the case of o-MoO3, another less intensive peak appears at 830 cm−1, which is attributed to the Mo-O-Mo deformation vibration and it is not present in the spectrum of the monoclinic phase. In contrast, in the spectrum of the h-MoO3phase, a band can be observed at 700–750 cm−1referring to the Mo-O vibration, which does not appear in the case of the other two phases. In addition, peaks around 1400 and 3200 cm−1, moreover at 1600 and 3400 cm−1belong to the N-H vibrations of the NH4+group and to the O-H vibrations of O-H groups and water molecules, respectively. These bands are not detectable in the case of orthorhombic and monoclinic MoO3phases.
This phenomenon can be explained by the fact that hexagonal channels usually store small ions, e.g., NH4+or molecules e.g., H2O which stabilize the structure, similar to h-WO3[2,11,15,34,35].
Nanomaterials 2020, 10, x FOR PEER REVIEW 7 of 13
the duration (3 h and 6 h, respectively), but with CTAB it became much thinner, 100–250 nm and 100–
500 nm in the 3 and the 6 h experiments, respectively. In contrast, the addition of CrCl3 additive resulted in the formation of the metastable m-MoO3, which has not been prepared by hydrothermal synthesis previously yet. Its role in directing crystal growth also became obvious as it led to nanosheet morphology, presumably due to its favored adherence to certain crystal planes resulting in inhibition of crystal growth in specified directions.
3.3. Further Investigation of the Different MoO3 Phases
For a more detailed examination of hexagonal (MoO3-1), o- (MoO3-8), and m-MoO3 (MoO3-10) phases, various methods were used.
Results of the specific surface area measurement demonstrated significant differences among the phases, which can be explained by their completely different morphologies (Table 2 SBET). The smallest (0.21 m2/g) specific surface area belonged to the hexagonal MoO3 phase, which was crystallized in the form of the most robust hexagonal rods with a diameter and length of several μm.
The orthorhombic phase had the largest (9.7 m2/g) surface area, which is attributed to its nanofibrous morphology, whereas the size of monoclinic MoO3 nanosheets surface was 2.9 m2/g.
Table 2. The specific surface area (SBET) and EDX results of the different MoO3 phases, MoO3-1: 90
°C, 3 h, MoO3-8: CTAB, 240 °C, 6 h, MoO3-11: CrCl3, 240 °C, 6 h.
Sample SBET (m2/g) EDX (atom %) Mo (Average) O (Average)
MoO3-1, hexagonal 0.21 24.3 75.7
MoO3-8, orthorhombic 9.7 24.8 75.2
MoO3-10, monoclinic 2.9 25.7 74.3
Studying the elemental composition of the phases by EDX, it was found that the ratio of the main elements (Mo, O) was close to the stoichiometric Mo:O = 1:3 ratio, and there were no other elements referring to contaminations in the samples.
In the FT-IR spectra, the characteristic metal-oxygen (Mo-O) vibrations in the range below 1000 cm−1 can be observed, by the help of which the phases can be distinguished (Figure 5A). Since the orthorhombic and monoclinic crystal structures are very similar, their spectrum is hardly different, unlike the hexagonal phase, where the difference is clearly visible. The intensive peak around 1000–
900 cm−1 refers to the Mo=O band, while the other one at 550–600 cm−1 belongs to the Mo-O valence vibration. In the case of o-MoO3, another less intensive peak appears at 830 cm−1, which is attributed to the Mo-O-Mo deformation vibration and it is not present in the spectrum of the monoclinic phase.
In contrast, in the spectrum of the h-MoO3 phase, a band can be observed at 700–750 cm−1 referring to the Mo-O vibration, which does not appear in the case of the other two phases. In addition, peaks around 1400 and 3200 cm−1, moreover at 1600 and 3400 cm−1 belong to the N-H vibrations of the NH4+
group and to the O-H vibrations of O-H groups and water molecules, respectively. These bands are not detectable in the case of orthorhombic and monoclinic MoO3 phases. This phenomenon can be explained by the fact that hexagonal channels usually store small ions, e.g., NH4+ or molecules e.g., H2O which stabilize the structure, similar to h-WO3.[2,11,15,34,35].
Nanomaterials 2020, 10, x FOR PEER REVIEW 8 of 13
Figure 5. FT-IR (A), Raman (B), and UV–Vis (C) spectra of different MoO3 phases, (a) MoO3-10, monoclinic phase (CrCl3,240 °C, 6 h), (b) MoO3-8, orthorhombic phase (CTAB, 240 °C, 6 h), (c) MoO3- 1, hexagonal phase (90 °C, 3 h).
In the Raman spectra, the distinctive bands of o-MoO3 at 990, 820, and 680 cm−1 belong to the stretching mode of Mo=O1, Mo-O3-Mo, and the Mo-O2-Mo (Figure 5B). The peaks appearing between 400 and 170 cm−1 refer to the different deformation vibrations of O=Mo=O and O-Mo-O, while those below 170 cm−1 are derived from the translation of rigid MoO4 chain. The monoclinic phase has a similar Raman spectrum, but at 500 cm−1 there is a band of the Mo-O valence vibration that is absent in the spectrum of the orthorhombic MoO3 and there are evident differences between o- and m-MoO3 in the ratio of the peaks, as well, mostly in the range of deformation vibrations. In the case of h-MoO3, the band at 1000 cm−1 and the triple peak located at 910–900–880 cm−1 are ascribed to the Mo=O valence vibrations, whereas the bands around 700, 500, 390, and 320 cm−1 refer to the O-Mo-O vibrations. The peaks below 300 cm−1 are attributed to the modes of the MoO4 tetrahedra chains [36–
39].
The absorption properties of the phases were investigated by diffuse reflectance UV–Vis spectroscopy. In each spectrum, a distinct absorption edge can be observed, which is characteristic of semiconductors (Figure 5C). Every phase absorbs not only in the UV range, but also in the visible part of the spectrum. The hexagonal phase, due to its pale yellow color, absorbs only below 500 nm, while the blue colored orthorhombic phase has absorption also above 550 nm, and so does monoclinic MoO3. Based on the spectra, the band gaps were determined, which were 3.07 eV for h-MoO3, 3.33 eV for o-MoO3, and 3.02 eV for m-MoO3.
3.4. Gas Sensing
3.4.1. Checking Crystalline Phases and Morphology at 500 °C
The gas sensing properties were tested between room temperature up to 500 °C. However, at lower temperatures the gas sensing signals were so small that they could not be evaluated properly.
Therefore, the responses to various H2 gas concentrations were only recorded at 500 °C. Accordingly, the present study serves only as a short test about the gas sensing of hydrothermally prepared m- MO3, but later a more detailed study is needed with lower sensing temperatures and various test gases.
Due to the relatively high operating temperature, before the gas sensing investigations, it was needed to check the possible phase and morphology transformations occurring at 500 °C, at the temperature of the gas sensing tests. Hence, all the MoO3 polymorphs had a 1 h heat treatment at 500
°C, and then they were studied by XRD and SEM (Figure 6).
Based on SEM and XRD results, we concluded that the heat treatment did not change the phase and morphology of o- and m-MoO3. However, the initially h-MoO3 phase transformed into o-MoO3, and the morphology changed, as well. The heated h-MoO3 (now o-MoO3) samples consisted of no hexagonal rods as before, but 10–20 nm wide, 200–300 nm long side-adhered plates, and irregular particles in various sizes (10–500 nm, Figure 6).
Figure 5. FT-IR (A), Raman (B), and UV–Vis (C) spectra of different MoO3 phases, (a) MoO3-10, monoclinic phase (CrCl3, 240◦C, 6 h), (b) MoO3-8, orthorhombic phase (CTAB, 240◦C, 6 h), (c) MoO3-1, hexagonal phase (90◦C, 3 h).
In the Raman spectra, the distinctive bands of o-MoO3at 990, 820, and 680 cm−1belong to the stretching mode of Mo=O1, Mo-O3-Mo, and the Mo-O2-Mo (Figure5B). The peaks appearing between
Nanomaterials2020,10, 891 8 of 12
400 and 170 cm−1refer to the different deformation vibrations of O=Mo=O and O-Mo-O, while those below 170 cm−1are derived from the translation of rigid MoO4chain. The monoclinic phase has a similar Raman spectrum, but at 500 cm−1 there is a band of the Mo-O valence vibration that is absent in the spectrum of the orthorhombic MoO3and there are evident differences between o- and m-MoO3in the ratio of the peaks, as well, mostly in the range of deformation vibrations. In the case of h-MoO3, the band at 1000 cm−1and the triple peak located at 910–900–880 cm−1are ascribed to the Mo=O valence vibrations, whereas the bands around 700, 500, 390, and 320 cm−1 refer to the O-Mo-O vibrations. The peaks below 300 cm−1are attributed to the modes of the MoO4tetrahedra chains [36–39].
The absorption properties of the phases were investigated by diffuse reflectance UV–Vis spectroscopy. In each spectrum, a distinct absorption edge can be observed, which is characteristic of semiconductors (Figure5C). Every phase absorbs not only in the UV range, but also in the visible part of the spectrum. The hexagonal phase, due to its pale yellow color, absorbs only below 500 nm, while the blue colored orthorhombic phase has absorption also above 550 nm, and so does monoclinic MoO3. Based on the spectra, the band gaps were determined, which were 3.07 eV for h-MoO3, 3.33 eV for o-MoO3, and 3.02 eV for m-MoO3.
3.4. Gas Sensing
3.4.1. Checking Crystalline Phases and Morphology at 500◦C
The gas sensing properties were tested between room temperature up to 500◦C. However, at lower temperatures the gas sensing signals were so small that they could not be evaluated properly.
Therefore, the responses to various H2gas concentrations were only recorded at 500◦C. Accordingly, the present study serves only as a short test about the gas sensing of hydrothermally prepared m-MO3, but later a more detailed study is needed with lower sensing temperatures and various test gases.
Due to the relatively high operating temperature, before the gas sensing investigations, it was needed to check the possible phase and morphology transformations occurring at 500◦C, at the temperature of the gas sensing tests. Hence, all the MoO3polymorphs had a 1 h heat treatment at 500Nanomaterials 2020, 10, x FOR PEER REVIEW ◦C, and then they were studied by XRD and SEM (Figure6). 9 of 13
Figure 6. XRD patterns (A) and SEM images of different MoO3 phases after the 500 °C heat treatment., (a) MoO3-10, monoclinic phase (CrCl3,240 °C, 6 h), (b) MoO3-8, orthorhombic phase (CTAB, 240 °C, 6 h), (c) MoO3-1, hexagonal phase (90 °C, 3 h).
3.4.2. Gas Sensing Tests
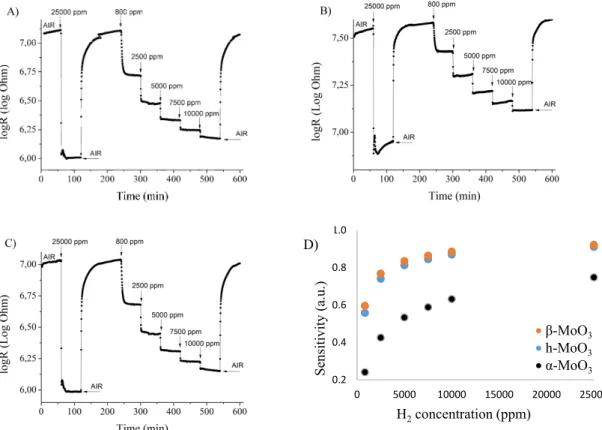
During the tests the samples gave an n-type response, namely, their electrical resistance was reduced when exposed to hydrogen, which is typical for an n-type semiconductor reacting to a reducing gas [40]. The change in the logarithm of their electrical resistance as a function of time is presented in (Figure 7A–C). The sensitivity (S) of the sensors can be calculated using the following formula [41]: 𝑆 = |∆ |, where ∆R is the change in electrical resistance due to the presence of the gas, while Rbase is the baseline electrical resistance of the material. As the baseline did not slip significantly, we selected the measured electrical resistance before the introduction of the 25,000 ppm H2 gas as Rbase. It can be observed that the sensitivity does not increase linearly with the increasing H2 concentration, and this might be related to the saturation of the gas sensing active sites (Figure 7D).
Based on the gas sensing results, m- (β-) MoO3 is more sensitive to the H2 gas than o- (α-) MoO3 which has, however, a larger specific surface area. Probably the density of surface active site is different in their case, which can be explained by, e.g., different amounts and forms of pre-adsorbed oxygen (O2- , O- or O2-) or the difference in surface OH groups similar to m- and h-WO3 [40,42]. The annealed h- MO3, which transformed into o-MoO3 at 500 °C has a similar sensitivity to the monoclinic polymorph.
Probably the hexagonal-orthorhombic transformation caused an increase in the number of active sites or in the surface area, which might explain this.
Figure 6.XRD patterns (A) and SEM images of different MoO3phases after the 500◦C heat treatment., (a) MoO3-10, monoclinic phase (CrCl3, 240◦C, 6 h), (b) MoO3-8, orthorhombic phase (CTAB, 240◦C, 6 h), (c) MoO3-1, hexagonal phase (90◦C, 3 h).
Nanomaterials2020,10, 891 9 of 12
Based on SEM and XRD results, we concluded that the heat treatment did not change the phase and morphology of o- and m-MoO3. However, the initially h-MoO3phase transformed into o-MoO3, and the morphology changed, as well. The heated h-MoO3(now o-MoO3) samples consisted of no hexagonal rods as before, but 10–20 nm wide, 200–300 nm long side-adhered plates, and irregular particles in various sizes (10–500 nm, Figure6).
3.4.2. Gas Sensing Tests
During the tests the samples gave an n-type response, namely, their electrical resistance was reduced when exposed to hydrogen, which is typical for an n-type semiconductor reacting to a reducing gas [40]. The change in the logarithm of their electrical resistance as a function of time is presented in (Figure7A–C). The sensitivity (S) of the sensors can be calculated using the following formula [41]:S= R|∆R|
base, where∆Ris the change in electrical resistance due to the presence of the gas, whileRbaseis the baseline electrical resistance of the material. As the baseline did not slip significantly, we selected the measured electrical resistance before the introduction of the 25,000 ppm H2gas as Rbase. It can be observed that the sensitivity does not increase linearly with the increasing H2concentration, and this might be related to the saturation of the gas sensing active sites (Figure7D). Based on the gas sensing results, m- (β-) MoO3is more sensitive to the H2gas than o- (α-) MoO3which has, however, a larger specific surface area. Probably the density of surface active site is different in their case, which can be explained by, e.g., different amounts and forms of pre-adsorbed oxygen (O2−, O−or O2−
) or the difference in surface OH groups similar to m- and h-WO3[40,42]. The annealed h-MO3, which transformed into o-MoO3at 500◦C has a similar sensitivity to the monoclinic polymorph. Probably the hexagonal-orthorhombic transformation caused an increase in the number of active sites or in the surface area, which might explain this.Nanomaterials 2020, 10, x FOR PEER REVIEW 10 of 13
Figure 7. Results of the gas sensing test of the different MoO3 phases. (A) MoO3-10, monoclinic phase (CrCl3,240 °C, 6 h); (B) MoO3-8, orthorhombic phase (CTAB, 240 °C, 6 h); (C) MoO3-1, hexagonal phase (90 °C, 3 h); (D) sensitivity of the MoO3 polymorphs.
Table 3. Response and return times of sensors using 25,000 ppm H2.
Sample Response Time (min) Recovery Time (min)
MoO3-10, monoclinic 1.2 22.5
MoO3-8, orthorhombic 1.2 10.1
MoO3-1, hexagonal 1.2 20.3
The response time was defined as the time at which the electrical resistance reaches 90% of the maximum signal given to a certain gas concentration and the recovery time was defined as the time needed to return to 10% of the maximum signal after finishing the gas pulse. These values are given for each sample using 25,000 ppm H2 (Table 3). Based on the data, the response time of all samples is low, approx. 1 min. The samples with a similar sensitivity (monoclinic and transformed hexagonal) also have a similar recovery time, approx. 20 min. The recovery time was lower for the fiber-like o- MoO3 sample. This might be explained by its lower number of gas sensing active sites, which also explained the lower sensitivity of this sample.
4. Conclusions
In this study, we investigated the effect of various parameters on the hydrothermal preparation of MoO3, for the first time also at 240 °C, focusing on the changes in the crystalline phases and morphology of the products. We used different temperatures (90/210/240 °C) and durations (3/6 h) to investigate their role in our reaction system. At 240 °C, we also tested the effect of CTAB and CrCl3
additives, respectively. As a result, h-MoO3 formed at 90 °C independently on the duration and crystallized in the form of hexagonal rods. At 210 °C with 3 h reaction time, the product was a mixture of h- and o-MoO3, while with 6 h it was pure o-MoO3, alike at 240 °C, with nanofibrous morphology.
0.2 0.4 0.6 0.8 1.0
0 5000 10000 15000 20000 25000
Sensitivity (a.u.)
H2concentration (ppm)
•β-MoO3
•h-MoO3
•α-MoO3 D)
Figure 7.Results of the gas sensing test of the different MoO3phases. (A) MoO3-10, monoclinic phase (CrCl3, 240◦C, 6 h); (B) MoO3-8, orthorhombic phase (CTAB, 240◦C, 6 h); (C) MoO3-1, hexagonal phase (90◦C, 3 h); (D) sensitivity of the MoO3polymorphs.
Nanomaterials2020,10, 891 10 of 12
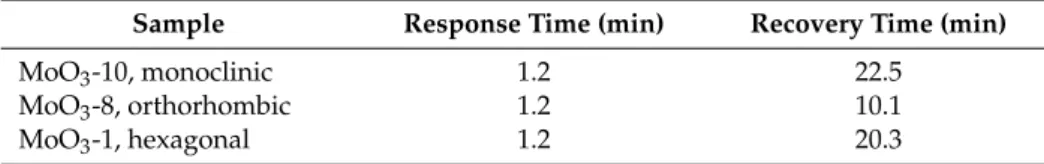
The response time was defined as the time at which the electrical resistance reaches 90% of the maximum signal given to a certain gas concentration and the recovery time was defined as the time needed to return to 10% of the maximum signal after finishing the gas pulse. These values are given for each sample using 25,000 ppm H2(Table3). Based on the data, the response time of all samples is low, approx. 1 min. The samples with a similar sensitivity (monoclinic and transformed hexagonal) also have a similar recovery time, approx. 20 min. The recovery time was lower for the fiber-like o-MoO3sample. This might be explained by its lower number of gas sensing active sites, which also explained the lower sensitivity of this sample.
Table 3.Response and return times of sensors using 25,000 ppm H2.
Sample Response Time (min) Recovery Time (min)
MoO3-10, monoclinic 1.2 22.5
MoO3-8, orthorhombic 1.2 10.1
MoO3-1, hexagonal 1.2 20.3
4. Conclusions
In this study, we investigated the effect of various parameters on the hydrothermal preparation of MoO3, for the first time also at 240◦C, focusing on the changes in the crystalline phases and morphology of the products. We used different temperatures (90/210/240◦C) and durations (3/6 h) to investigate their role in our reaction system. At 240◦C, we also tested the effect of CTAB and CrCl3
additives, respectively. As a result, h-MoO3 formed at 90◦C independently on the duration and crystallized in the form of hexagonal rods. At 210◦C with 3 h reaction time, the product was a mixture of h- and o-MoO3, while with 6 h it was pure o-MoO3, alike at 240◦C, with nanofibrous morphology.
With the use of the CTAB additive, we obtained pure o-MoO3in the form of nanofibers, but with a radically reduced diameter due to the presence of the additive. However, when we applied CrCl3, it resulted in the metastable m-MoO3phase at both reaction durations with nanosheet morphology.
The gas sensing properties of the MoO3samples against H2were also tested. The m-MoO3was found to be more sensitive than the o-MoO3.
Author Contributions:Conceptualization, T.N.-K., I.M.S., and G.P.; methodology, T.N.-K. and I.M.S.; investigation, T.N.-K., L.S., I.E.L., K.L., and P.P.; writing—original draft preparation, T.N.-K.; writing—review and editing, K.L., P.P., I.M.S., and G.P.; supervision, I.M.S. All authors have read and agreed to the published version of the manuscript.
Funding:This research was funded by NRDI grant numbers K 124212, TNN_16 123631. The work performed within project no. VEKOP-2.3.2-16-2017-00013 was supported by the European Union and the State of Hungary, co-financed by the European Regional Development Fund. The research reported in this paper was supported by the Higher Education Excellence Program of the Ministry of Human Capacities in the frame of Nanotechnology and Materials Science research area of Budapest University of Technology (BME FIKP-NAT). The APC was funded by the Budapest University of Technology and Economics.
Acknowledgments:The authors thank T. Igricz (Budapest University of Technology and Economics, Department of Organic Chemistry and Technology) for help in the Raman measurements.
Conflicts of Interest:The authors declare no conflict of interest.
References
1. Krobkrong, N.; Itthibenchapong, V.; Khongpracha, P.; Faungnawakij, K. Deoxygenation of oleic acid under an inert atmosphere using molybdenum oxide-based catalysts. Energy Convers. Manag. 2018,167, 1–8.
[CrossRef]
2. Alam, U.; Kumar, S.; Bahnemann, D.; Koch, J.; Tegenkamp, C.; Muneer, M. Harvesting visible light with MoO3 nanorods modified by Fe(iii) nanoclusters for effective photocatalytic degradation of organic pollutants.
Phys. Chem. Chem. Phys.2018,20, 4538–4545. [CrossRef] [PubMed]
Nanomaterials2020,10, 891 11 of 12
3. Yogananda, H.S.; Nagabhushana, H.; Darshan, G.P.; Basavaraj, R.B. MoO3 nanostructures from EGCG assisted sonochemical route: Evaluation of its application towards forensic and photocatalysis. J. Alloys Compd.2018,745, 874–891. [CrossRef]
4. Li, B.; Wang, X.; Wu, X.; He, G.; Xu, R.; Lu, X.; Wang, F.R.; Parkin, I.P. Phase and morphological control of MoO3−x nanostructure for efficient cancer theragnosis therapy.Nanoscale2017,9, 11012–11016. [CrossRef]
[PubMed]
5. Song, Y.; Zhao, J.; Zhao, Y.; Huang, Z.; Li, Y.; Wu, G. Synthesis ofα-MoO3 nanobelts with preferred orientation and good photochromic performance.CrystEngComm2016,18, 6502–6512. [CrossRef]
6. Xie, Z.; Feng, Y.; Wang, F.; Chen, D.; Zhang, Q.; Zeng, Y.; Lv, W.; Liu, G. Construction of carbon dots modified MoO3/g-C3N4Z-scheme photocatalyst with enhanced visible-light photocatalytic activity for the degradation of tetracycline.Appl. Catal. B Environ.2018,229, 96–104. [CrossRef]
7. Phuruangrat, A.; Cheed-im, U.; Thongtem, T.; Thongtem, S. Influence of Gd dopant on photocatalytic properties of MoO3 nanobelts.Mater. Lett.2016,173, 158–161. [CrossRef]
8. Chithambararaj, A.; Sanjini, N.S.; Velmathi, S.; Bose, A.C. Preparation of h-MoO3 and a-MoO3 nanocrystals:
Comparative study on photocatalytic degradation of methylene blue under visible light irradiation.Phys.
Chem. Chem. Phys.2013,15, 14761–14769. [CrossRef]
9. Illyaskutty, N.; Kohler, H.; Trautmann, T.; Schwotzer, M.; Mahadevan Pillai, V.P. Hydrogen and ethanol sensing properties of molybdenum oxide nanorods based thin films: Effect of electrode metallization and humid ambience.Sens. Actuators B Chem.2013,187, 611–621. [CrossRef]
10. Liu, Y.; Yang, S.; Lu, Y.; Podval’naya, N.V.; Chen, W.; Zakharova, G.S. Hydrothermal synthesis of h-MoO3 microrods and their gas sensing properties to ethanol.Appl. Surf. Sci.2015,359, 114–119. [CrossRef]
11. Xu, Y.; Xie, L.; Zhang, Y.; Cao, X. Hydrothermal synthesis of hexagonal MoO3 and its reversible electrochemical behavior as a cathode for Li-ion batteries.Electron. Mater. Lett.2013,9, 693–696. [CrossRef]
12. Han, B.; Lee, K.; Lee, Y.; Kim, S.; Park, H.; Hwang, B.; Kwak, D.; Park, K. MoO3 nanostructured electrodes prepared via hydrothermal process for lithium ion batteries.Int. J. Electrochem. Sci.2015,10, 4232–4240.
13. Dhanasankar, M.; Purushothaman, K.K.; Muralidharan, G. Optical, structural and electrochromic studies of molybdenum oxide thin films with nanorod structure.Solid State Sci.2010,12, 246–251. [CrossRef]
14. Chithambararaj, A.; Rajeswari Yogamalar, N.; Bose, A.C. Hydrothermally synthesized h-MoO3 andα-MoO3 nanocrystals: New findings on crystal-structure-dependent charge transport.Cryst. Growth Des.2016,16, 1984–1995. [CrossRef]
15. Kumar, V.V.; Gayathri, K.; Anthony, S.P. Synthesis ofα-MoO3 nanoplates using organic aliphatic acids and investigation of sunlight enhanced photodegradation of organic dyes.Mater. Res. Bull.2016,76, 147–154.
[CrossRef]
16. De Castro, I.A.; Datta, R.S.; Ou, J.Z.; Castellanos-gomez, A.; Sriram, S.; Daeneke, T.; Kalantar-zadeh, K.
Molybdenum oxides—From fundamentals to functionality.Adv. Mater. 2017,29, 1701619. [CrossRef]
17. Szilágyi, I.M.; Madarász, J.; Pokol, G.; Király, P.; Tárkányi, G.; Saukko, S.; Mizsei, J.; Tóth, A.L.; Szabó, A.;
Varga-Josepovits, K. Stability and controlled composition of hexagonal WO3. Chem. Mater. 2008, 20, 4116–4125. [CrossRef]
18. Badr, A.M.; El-Anssary, E.H.; Elshaikh, H.A.; Afify, H.H. Hydrothermal synthesis and influence of later heat treatment on the structural evolution, optical and electrical properties of nanostructuredα-MoO3 single crystals.J. Phys. D Appl. Phys.2017,50, 505111. [CrossRef]
19. Bouzidi, A.; Benramdane, N.; Tabet-derraz, H.; Mathieu, C.; Khelifa, B.; Desfeux, R. Effect of substrate temperature on the structural and optical properties of MoO3 thin films prepared by spray pyrolysis technique.Mater. Sci. Eng. B2003,97, 5–8. [CrossRef]
20. Bai, S.; Chen, S.; Chen, L.; Zhang, K.; Luo, R.; Li, D.; Liu, C.C. Ultrasonic synthesis of MoO3 nanorods and their gas sensing properties.Sens. Actuators B Chem.2012,174, 51–58. [CrossRef]
21. Yan, H.; Song, P.; Zhang, S.; Zhang, J.; Yang, Z.; Wang, Q. Au nanoparticles modified MoO3 nanosheets with their enhanced properties for gas sensing.Sens. Actuators B Chem.2016,236, 201–207. [CrossRef]
22. Chang, W.C.; Qi, X.; Kuo, J.C.; Lee, S.C.; Ng, S.K.; Chen, D. Post-deposition annealing control of phase and texture for the sputtered MoO3 films.CrystEngComm2011,13, 5125–5132. [CrossRef]
23. Haro-Poniatowski, E.; Jouanne, M.; Morhange, J.F.; Julien, C.; Diamant, R.; Fernández-Guasti, M.;
Fuentes, G.A.; Alonso, J.C. Micro-Raman characterization of WO3 and MoO3 thin films obtained by pulsed laser irradiation.Appl. Surf. Sci.1998,127–129, 674–678. [CrossRef]
Nanomaterials2020,10, 891 12 of 12
24. Maiti, P.; Guha, P.; Singh, R.; Dash, J.K.; Satyam, P.V. Optical band gap, local work function and field emission properties of MBE grown B-MoO3 nanoribbons.Appl. Surf. Sci.2019,476, 691–700. [CrossRef]
25. Wang, L.; Zhang, G.-H.; Sun, Y.-J.; Zhou, X.-W.; Chou, K.-C. Preparation of ultrafineβ-MoO3 from industrial grade MoO3 powder by the method of sublimation.J. Phys. Chem. C2016,120, 19821–19829. [CrossRef]
26. Mizushima, T.; Moriya, Y.; Phuc, N.H.H.; Ohkita, H.; Kakuta, N. Soft chemical transformation ofα-MoO3 to β-MoO3 as a catalyst for vapor-phase oxidation of methanol.Catal. Commun.2011,13, 10–13. [CrossRef]
27. Pham, T.T.P.; Nguyen, P.H.D.; Vo, T.T.; Nguyen, H.H.P.; Luu, C.L. Facile method for synthesis of nanosized β–MoO3 and their catalytic behavior for selective oxidation of methanol to formaldehyde.Adv. Nat. Sci.
Nanosci. Nanotechnol.2015,6, 045010. [CrossRef]
28. Alsaif, M.M.Y.A.; Balendhran, S.; Field, M.R.; Latham, K.; Wlodarski, W.; Ou, J.Z.; Kalantar-Zadeh, K.
Two dimensionalα-MoO3 nanoflakes obtained using solvent-assisted grinding and sonication method:
Application for H2 gas sensing.Sens. Actuators B Chem.2014,192, 196–204. [CrossRef]
29. Arachchige, H.M.M.M.; Comini, E.; Zappa, D.; Sberveglieri, G. Gas Sensing Properties of MoO3.Proceedings 2017,1, 449. [CrossRef]
30. Mane, A.A.; Moholkar, A.V. Orthorhombic MoO3 nanobelts based NO2 gas sensor.Appl. Surf. Sci.2017,405, 427–440. [CrossRef]
31. Martínez, H.M.; Torres, J.; Rodríguez-García, M.E.; López Carreño, L.D. Gas sensing properties of nanostructured MoO3 thin films prepared by spray pyrolysis.Phys. B Condens. Matter2012,407, 3199–3202.
[CrossRef]
32. Brunauer, S.; Emmett, P.H.; Teller, E. Adsorption of gases in multimolecular layers.J. Am. Chem. Soc.1938, 60, 309. [CrossRef]
33. Szilágyi, I.M.; Bakos, L.P.; Nóra, J.; Moura da Silva Bezerra da Costa, U.C.; László, K.; Lábár, J.; Igricz, T.;
Varga-Josepovits, K.; Pasierb, P.; Färm, E.; et al. Photocatalytic and gas sensitive multiwalled carbon prepared by atomic layer deposition.Nanomaterials2020,10, 252.
34. Liu, Y.; Feng, P.; Wang, Z.; Jiao, X.; Akhtar, F. Novel fabrication and enhanced photocatalytic MB degradation of hierarchical porous monoliths of MoO3 nanoplates.Sci. Rep.2017,7, 1845. [CrossRef]
35. Chithambararaj, A.; Bose, A.C. Hydrothermal synthesis of hexagonal and orthorhombic MoO3 nanoparticles.
J. Alloys Compd.2011,509, 8105–8110. [CrossRef]
36. Sinaim, H.; Jin, D.; Sung, J.; Phuruangrat, A.; Thongtem, S. Free-polymer controlling morphology of L-MoO3 nanobelts by a facile hydrothermal synthesis, their electrochemistry for hydrogen evolution reactions and optical properties.J. Alloys Compd.2012,516, 172–178. [CrossRef]
37. Gao, B.; Fan, H.; Zhang, X. Hydrothermal synthesis of single crystal MoO3 nanobelts and their electrochemical properties as cathode electrode materials for rechargeable lithium batteries.J. Phys. Chem. Solids2012,73, 423–429. [CrossRef]
38. Senthilkumar, R.; Anandhababu, G.; Mahalingam, T.; Ravi, G. Photoelectrochemical study of MoO3 assorted morphology films formed by thermal evaporation.J. Energy Chem.2016,25, 798–804. [CrossRef]
39. Hui, B.; Li, G.; Zhao, X.; Wang, L.; Wu, D.; Li, J.; Via, B.K. h-MoO3 microrods grown on wood substrates through a low-temperature hydrothermal route and their optical properties.J. Mater. Sci. Mater. Electron.
2017,28, 3264–3271. [CrossRef]
40. Szilágyi, I.M.; Saukko, S.; Mizsei, J.; Tóth, A.L.; Madarász, J.; Pokol, G. Gas sensing selectivity of hexagonal and monoclinic WO3to H2S.Solid State Sci.2010,12, 1857–1860. [CrossRef]
41. Chaudhari, G.N.; Bende, A.M.; Bodade, A.B.; Patil, S.S.; Sapkal, V.S. Structural and gas sensing properties of nanocrystalline TiO2:WO3-based hydrogen sensors.Sens. Actuators B Chem.2006,115, 297–302. [CrossRef]
42. Szilágyi, I.M.; Fórizs, B.; Rosseler, O.; Szegedi, Á.; Németh, P.; Király, P.; Tárkányi, G.; Vajna, B.;
Varga-Josepovits, K.; László, K.; et al. WO3 photocatalysts: Influence of structure and composition.
J. Catal.2012,294, 119–127. [CrossRef]
©2020 by the authors. Licensee MDPI, Basel, Switzerland. This article is an open access article distributed under the terms and conditions of the Creative Commons Attribution (CC BY) license (http://creativecommons.org/licenses/by/4.0/).