Introduction
In 1991, the EU introduced the Nitrates Directive, which aimed to reduce water pollution caused or induced by nitrates from agricultural sources. The Directive requires Member States to apply agricultural action programme measures throughout their whole territory or within nitrate vulnerable zones (NVZs). Action programme measures are required to promote best practice in the use and storage of fertiliser and manure (EEA, 2018). Today, after 29 years, it can be stated that the regulation has failed to achieve its goal, namely that of reducing agricultural NP loads into the envi- ronment. The reason is that Nitrates Directive focused on diminishing point-source agricultural NP loads, which are by an order of magnitude less than diffuse NP loads derived from extremely high animal densities. In the review on the NP turnover of the EU countries, according to the Hun- garian approach in estimating livestock units (Hajas and Rázsó, 1969), around 75 livestock units (LU) / 100 hectares of agricultural land proved to be the optimum (Csathó and Radimszky, 2012). Effective reduction of agricultural NP loads to the environment can only achieved by drastically reducing animal densities in the countries with the highest values, in other words, having the most positive / extreme NP balances within the EU (Stanners and Bourdeau, 1995;
World Bank, 2005). In parallel, livestock densities should be increased to the optimum level in the EU countries with the lowest values i.e. in the Central- and Eastern European countries, for rural development purposes (Altieri, 2012;
Csathó and Radimszky, 2009, 2012).
It is important to note that the Present Nmax values in the 59/2008 Ministry of Agriculture decree, Appendix 3, were based on national average yield levels, which were much lower than those obtained in the best farms. As a result, the maximum permissible N doses, established for average farm conditions (soil quality, farmer’s financial status, etc.), are not adequate for the farmers who have the most productive soils, and who consequently possess the best financial sta- tuses. In addition, both the area of irrigated land and crop yield averages have increased significantly since 2008.
There are several indicators which characterise the effi- ciency of the nutrient supply. Agronomists most commonly use Agronomic efficiency (AEN), which is defined as units increase in yield per units input. To calculate AEN, it is essential to know the yield of the unfertilised plot (without nutrient input). It is possible mainly in field trials, due to the fact that agricultural farms usually don’t have fields with zero nutrient input (Tillman et al., 2002).
Apparent Recovery Efficiency (AREN) is one of the more complex forms of indicators, representing the differ- ence in nutrient uptake between the fertilised and the unfer- tilised plot relative to the quantity of input applied (Cassman et al., 2002). When tracers such as 15N are used, the recovery is known as True Recovery Efficiency (TREn). The Nitrogen Use Efficiency (NUE) is an easy-to-use indicator for applying agricultural (crop and animal production) and food systems to control the N balance. The mass balance using N input and N output data may be calculated as: NUE = N output / N input. It looks easy to use but determining and measur- ing the exact value of the components is difficult (Oenema Béla PIRKÓ*, Sándor KOÓS*, József SZABÓ*†, László RADIMSZKY*, Péter CSATHÓ*, Tamás ÁRENDÁS**, Nándor FODOR** and Anita SZABÓ*
Results of Hungarian field test trials set up for establishing new maximum permitted N dose values
The advancement of crop production has not yet been followed by the increase in maximum permitted nitrogen doses set out in the Hungarian Action Programme of the Nitrate Directive. According to the farmers’ observations, crops grown in nitrate vulnerable zones with good agricultural conditions already have much higher nitrogen uptake than the maximum permitted values, so the genetic potential of the plants cannot be exploited at the current level. In order to prove this, in the autumn of 2017, a small-plot long-term experiment was set up in three different regions of Hungary. The results were evaluated in a complex way, based on an agronomic approach, Nitrogen Use Efficiency (NUE) and an economic approach. In terms of the agronomic evaluation, no clear differences were found between treatments: the highest yields were obtained in respect of different treatments at the three experimental sites, but the differences were not significant. From the point of view of NUE, the Nmax experiment on the Nagyhörcsök calcareous chernozem soil showed the highest values, which, according to the EU N Expert Panel (EUNEP), are already in the unfavourable soil depletion range. From the economic point of view, there was no significant difference in net profits between the Present and New planned Nmax values. The EUNEP approach also confirms the need to increase Nmax values in order to decrease the potential for soil depletion. However, with a view to establishing the final optimum range for the EUNEP, it seems necessary to take into account economic considerations as well, especially regarding the financial conditions of Central and Eastern European countries.
Keywords: Nitrate Directive, agronomic approach, Nitrogen Use Efficiency, economic approach, EU N Expert Panel JEL classification: Q10, Q24
* Institute for Soil Sciences and Agricultural Chemistry, Centre for Agricultural Research (ATK TAKI). Herman Ottó út 15. Budapest, H-1022, Hungary. Correspond- ing author: koos.sandor@agrar.mta.hu
** Agricultural Institute, Centre for Agricultural Research (ATK MGI). Brunszvik u. 2. Martonvásár, H-2462, Hungary.
Received: 15 March 2020, Revised: 25 May 2020, Accepted: 26 May 2020.
et al., 2009). NUE depends on the system and its management:
it increases as the N output in harvested products increases and/or the N input decreases. Conversely, NUE decreases when the N output in harvested products is relatively low and the N input relatively high (Oenema et al., 2016).
NUE shows what percentage of the applied N is used by plants. The value of NUE can move over a wide scale:
from only about 30% until up to 80% in a well-planned plot experiment. Besides fertiliser rate and timing factors, till- age, soil management, and environmental conditions can further influence the level of efficiency (Cassman et al., 2002). NUE indicators provide a measure for the amount of N that is retained in crop or animal products, relative to the amount of N applied or supplied. N surplus is an indicator for the N pressure of the farm on the wider environment; it also depends on the pathway through which surplus N is lost, either as NH3 volatilization, NO3 leaching and/or nitrifica- tion/denitrification. Management has a large effect on both NUE and N surplus (Tamminga, 1996; Mosier et al., 2004).
The basis of the economic evaluation was the data of the European Farm Accountancy Data Network (FADN) sys- tem maintained by the Agricultural Research Institute. The (FADN) provides detailed financial economic information at farm level on more than 80,000 farms in Europe. The data is collected in a systematic way on an annual basis and the information collected for each sample farm contains more than 1,000 variables. FADN contains harmonised farm-level data across Europe: the data elements to be provided to the European Commission (EC) and bookkeeping principles (such as depreciation) are the same in all countries. The data to be uploaded and the exact definition of each data element are defined in the FADN Farm Return (Vrolijk et al., 2016).
Data collection extends to individual enterprises and joint ventures, which is justified because there are significant differences between the two categories in respect of almost all factors. Values also vary widely, depending on whether the national average or the average of the farms that deter- mine sales are taken into consideration.
In autumn 2017, a new programme was started in Hun- gary which aimed to prove that maximum permissible N kg/
ha doses for Hungarian arable crops are much lower than the N doses necessary for achieving high crop yield levels in the best farms. The first year results obtained in the three small plot field trials set up in characteristic Hungarian soil types are presented in this paper. Besides the agronomic approach, the NUE as well as the economic approach are shown in the paper.
Methodology
Agronomic evaluation
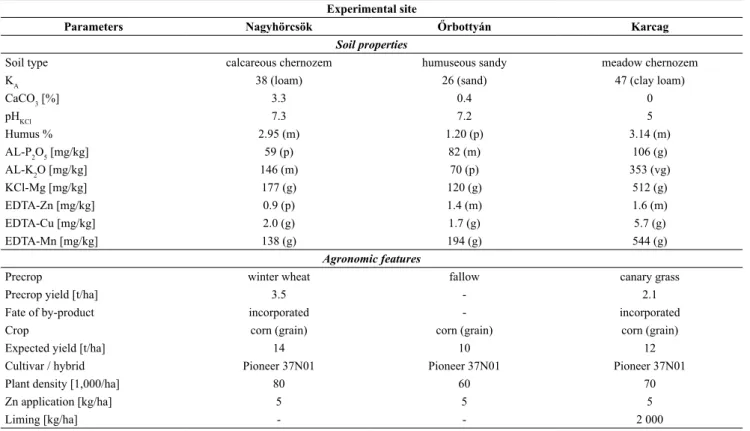
Soil properties of the three experimental sites are shown in Table 1. From the point of views of soil texture, reaction status, organic matter content, as well as available soil nutri- ent contents, the three sites show characteristic differences.
Experimental soils represent the most widespread soil types of Hungary, only brown forest soils missing.
Expected yield levels as well as plant densities were adjusted to the soil and climatic conditions. Prior setting up the field trials, 5 kg/ha Zn was applied, while 2 t/haCaCO3 only in the Karcag site with low pH (Table 1).
Table 1: Soil properties and agronomic characteristics of the experimental sites.
Experimental site
Parameters Nagyhörcsök Őrbottyán Karcag
Soil properties
Soil type calcareous chernozem humuseous sandy meadow chernozem
KA 38 (loam) 26 (sand) 47 (clay loam)
CaCO3 [%] 3.3 0.4 0
pHKCl 7.3 7.2 5
Humus % 2.95 (m) 1.20 (p) 3.14 (m)
AL-P2O5 [mg/kg] 59 (p) 82 (m) 106 (g)
AL-K2O [mg/kg] 146 (m) 70 (p) 353 (vg)
KCl-Mg [mg/kg] 177 (g) 120 (g) 512 (g)
EDTA-Zn [mg/kg] 0.9 (p) 1.4 (m) 1.6 (m)
EDTA-Cu [mg/kg] 2.0 (g) 1.7 (g) 5.7 (g)
EDTA-Mn [mg/kg] 138 (g) 194 (g) 544 (g)
Agronomic features
Precrop winter wheat fallow canary grass
Precrop yield [t/ha] 3.5 - 2.1
Fate of by-product incorporated - incorporated
Crop corn (grain) corn (grain) corn (grain)
Expected yield [t/ha] 14 10 12
Cultivar / hybrid Pioneer 37N01 Pioneer 37N01 Pioneer 37N01
Plant density [1,000/ha] 80 60 70
Zn application [kg/ha] 5 5 5
Liming [kg/ha] - - 2 000
Nutrient supply categories: p = poor; m = medium; g = good; vg = very good.
The field trials were set up with 8 treatments, in 3 repli- cations, in randomised block design, where the size of plots were 10x10 m (100 m2). Treatments were as follows:
• Treatment 1.) Pro Planta (PP) NPK doses, as rec- ommended by the economic and environmentally friendly advisory Pro Planta system, level 2 (Csathó et al., 2007);
• Treatment 2.) N: Present Nmax value (59/2008. MA Decree, Appendix 3), PK: PP recommendation, level 4 (Csathó et al., 2007);
• Treatment 3.) N: New planned Nmax level (KITE, 2016), PK: PP recommendation, level 4 (Csathó et al., 2007);
• Treatment 4.) MÉM NAK intensive recommendation.
From treatments 5 to 8, the treatments of the classical NPK demand trial;
• Treatment 5.) PK;
• Treatment 6.) NK;
• Treatment 7.) NP;
• Treatment 8.) NPK.
The N-P2O5-K2O kg/ha doses applied in the field trials can be found in Table 3.
Expected yield levels were estimated so that to explore the genetic potential of the maize hybrids. When optimum plant densities were determined, special soil and climatic conditions were taken into account. Adequate plant density is a prerequisite for obtaining high yields. When expected yield levels were estimated, optimum weather conditions were taken for granted. Obviously, this factor is the bottleneck among all the factors. There was no irrigation in the small plot field trials; therefore, under our continental climate, in breeding season all type of years (average, advantageous and disadvantageous) can occur, determining actual maize yields to an extent above all the other factors. With this approach, under disadvantageous weather conditions for maize produc- tion, there is a risk that there will be high difference between expected and obtained yield levels, affecting both NUE and economic evaluations.
Although in Nagyhörcsök and Karcag, the by-product of the precrop was incorporated to the soil, there were no extra N doses applied for counterbalancing the disadvantageously high C to N ratio of the by-product. It was taken for granted that the N doses calculated for high expected yield levels were high enough for providing extra N for cellulose decom- posing soil microorganisms.
Meteorology data
The climate of the three experimental areas can be char- acterised as follows.
Nagyhörcsök: The average annual temperature is 10.1- 10.3 °C, the summer half-year 17.0 °C. The annual precipi- tation is 570-600 mm. Precipitation during the vegetation period is 320-340 mm. The aridity index is 1.17-1.22.
Őrbottyán: Average annual temperature is 10.0-10.2 °C.
The annual precipitation is 560-580 mm, of which 320-330 mm falls during the vegetation period. The aridity index is 1.20-1.25.
Karcag: The average annual temperature is 10.2-10.4 °C, the average temperature during the vegetation period is 17.4- 17.6 °C. The annual precipitation is 490-510 mm and the precipitation during the vegetation period is around 300 mm.
This is the driest region in the country. The aridity index is around 1.40.
NUE evaluation
Besides the agronomic approach, the three Nmax small plot field trials were evaluated by the EU N Expert Panel (EUNEP) approach as well (Oenema et al., 2016). It is well known that both the input and output blocks of the EUNEP approach were elaborated for the farm-gate system. Only N inputs entering farm-gate and N outputs leaving farm-gate are taken into consideration in this approach. Differences between N inputs and outputs are equal to the farm-gate N balance.
Obviously, only surface N balances can be calculated in the three Nmax small plot field trials evaluated in this paper.
The input side of the surface N balance approach is the amount of N (kg/ha) applied to the field or the plot. So as to adjust the surface N balance methodology to the farm-gate N balance approach, only the N content of harvested yield removed from the field was taken into account in the output side of the surface N balance approach.
According to the Hungarian Action Programme (59/2008 MA Decree, Appendix 4) standard, the specific N content of maize (N content of one tonne maize grain plus the N content of the stalk belonging to the one tonne maize grain) is 25 kg N/t. If we count only the amount of N removed by the grain yield, approximately 20 kg N/t maize grain should appear on the output side together with grain yields (t/ha). At the other end, according to EUNEP approach, within the input side, besides fertiliser N, entering farm-gate, wet and dry N deposition, as well as seed N content are also taken into account. In order to fit the surface N balance methodology to EUNEP approach, we considered that wet and dry N deposi- tion plus maize seed N content comprise the input side, as extra N input amount is counterbalanced on the output side by increasing the 20 kg N/t specific N content (grain only), to 25 kg N/t specific N content of maize (grain plus stalk).
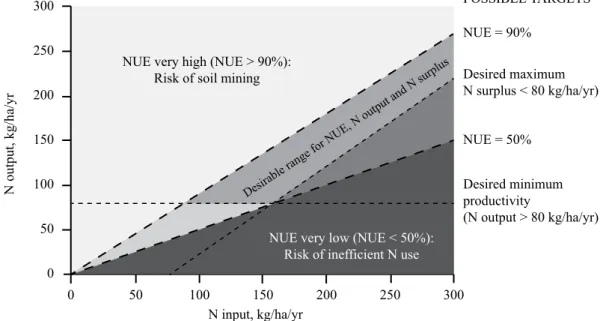
From the point of view of intensity, Hungarian farm- ers running their farms on high yield potential soils, with favourable agro-ecological as well as economic conditions can be comparable to some Western European farmers. As a consequence, besides the agronomic approach, the small plot and farm level Nmax field trials, set up on characteris- tic Hungarian soils, must undergo the evaluation using the EUNEP approach as well. The principle of the model used in the EUNEP can be seen in Figure 1.
When determining NUE, using the EUNEP approach, adopted to single field units, only the ratio of and differ- ence between crop N uptake (as outcome side) and applied N (as input side) are taken into account. According to this approach, soil N supplying capacity is not taken into con- sideration neither in determining NUE, nor in establishing maximum permitted N doses. According to this approach, when the ratio of crop N uptake versus applied N is between
0.5 and 0.9 (50 to 90%), crop N fertiliser practice is accepted as sound. Whenever this indicator comes close to or exceeds 90%, the risk of soil N depletion, while reaching or exceed- ing 50%, the risk of wasteful, uneconomic N fertilising prac- tice with enhanced pollution of the environment increases.
The optimum interval is considered to be between 0.8 and 0.9 (80 to 90%). Namely, N input must exceed crop N uptake by 10 to 20%. With this approach, N balances up to +80 kg/
ha are stated as sustainable ones. According to the model elaborated by the EU N Expert Panel, the minimum N use intensity requirement is at least 80 kg/ha/yr N application for meeting crop N demands adequately.
As already mentioned, in this approach, the volume of both N inputs and N outputs are taken into account (Oenema et al., 2016). As a comparison, of the 50 thousand parcels / fields (1.3 million hectares) of the Hungarian Nitrates Database, according to the year 2016 evaluation, 40% failed to satisfy this requirement, i.e. in 40% of the parcels there was less than 80 kg/ha N applied as N input. This indicates, from the point of view of agricultural N loads, the endangered areas are not in the Eastern- and Central European countries, but, rather, in the Western European ones (MTA ATK TAKI, 2018).
Economic evaluation
An important aspect of the evaluation of the experiments was that the effects of the increased doses of fertilisers were not only evaluated on the basis of their agronomic and effi- ciency aspects, but also in terms of their economic impact.
To do this, we needed the main economic indicators of Hun- garian maize production for 2018, which were provided by the Research Institute of Agricultural Economics. The data included the selling price and the yield, which were used to determine the average production value per hectare. In terms of costs, direct variable costs and total production costs were itemised. This was used to determine the total cost of maize production per hectare of the national average without ferti- lisation. To this, we added the cost of fertiliser per hectare to
the treatments of the experiment, so we got the total cost of production. By multiplying the yields and the sales price the production value can be determined and the financial result can be calculated for each experimental treatment. The cost were determined in Hungarian Forint and Euro. The cost in EUR were calculate on this exchange rate: 1 EUR = 323.2 HUF (time period between September and December, 2018)
Results
Agronomic evaluation
The small plot field trials were first evaluated with the classical agronomic / agrochemical approach, where soil N supply is taken into consideration. In this approach, crop N demand is provided partly by soil N supply, and, only the missing part, by mineral fertiliser and/or manure. The amount of N provided by soil N supply is estimated by soil N test method calibrated in long-term field trials. In Hun- gary, soil organic matter content (SOM) is used as soil N test method. The small plot N trials were set up in the three sites with different agro-ecological conditions, and soil N supplies (Table 1).
A) Nagyhörcsök, calcareous chernozem soil
The most intensive maize field trial was conducted in this site with a fertile soil with good water regime and high yield capacities. Crop density (80,000 plants/ha) and expected yield level (14.0 t/ha) was the highest in this trial, as com- pared to the other two trials. Meteorological conditions in 2017/2018 were favourable for maize production, verified by the 12.1 t/ha grain yield obtained in the average of the trial (Table 2).
On average, maize grain yield was 12.0 t/ha, which, although high, yet 2.0 t/ha less than the expected yield level.
300
0 50 100 150 200 250 300
250
150 200
N output, kg/ha/yr
N input, kg/ha/yr
Desired minimum productivity
(N output > 80 kg/ha/yr) NUE very high (NUE > 90%):
Risk of soil mining Desired maximum
N surplus < 80 kg/ha/yr) POSSIBLE TARGETS
NUE = 50%
NUE = 90%
100 50 0
NUE very low (NUE < 50%):
Risk of inefficient N use Desirable range for NUE, N output and N surplus
Figure 1: The principle and optimum interval of the required Nitrogen Use Efficiency (NUE), elaborated by the EU N Expert Panel
Source: Oenema et al. (2016)
In the classical N-, P- and K- demand part of the trial (Treat- ments 5 to 8), response to N fertilisation was 1.2 t/ha, to P, 1.2 t/ha, and, to K, 0.0 t/ha. Responses to N, P and K fertilisa- tion – except for K– proved the soil NPK supply categories elaborated in the Pro Planta (PP) system to be sound.
In the four recommendation treatments (Treatments 1 to 4), which were elaborated by different advisory systems and approaches, there was no difference in the grain yields of the first three treatments (PP level 2; Present Nmax value;
New planned Nmax value). The grain yield in the MÉM NAK intensive recommendation treatment was, however, 1.1 to 1.4 t/ha higher than in Treatments 1 to 3. The reason for that might partly be the enhanced PK doses, which were applied to this soil with poor-medium P supplies (Table 2).
It is important to remark that intensive MÉM NAK doses did not result in any yield surpluses over Treatments 1 to 3, neither on the Karcag meadow chernozem soil with good to very good soil PK supplies, nor in the Őrbottyán humuseous sandy soil with poor to medium PK soil supplies (Table 2).
In practical terms, there was no difference between the yields of the treatments of the Present Nmax values (170 kg/ha N) and the New planned Nmax values (210 kg/ha N) (Table 2).
It is also important to mention that, having the first year of the planned four-year field trial, LSD 5% values were higher than usual, and most of the differences among the treatments were not significant.
B) Őrbottyán, humuseous sandy soil
The less intensive maize field trial was conducted in this site with low clay content, low natural NPK pools, low NPK supplying capacity and a disadvantageous water regime.
Crop density (60,000 plants/ha) and expected yield level (10.0 t/ha) was the lowest in this trial, as compared to the other two trials. Meteorological conditions in 2017/2018 were favourable for maize production, and grain yields obtained in the average of the trial (7.2 t/ha) was remarkable for a sandy soil with low soil NPK supplying and water hold- ing capacities (Table 2).
This 7.0 t/ha average yield, however, was 3.0 t/ha less, than expected yield level was. This fact draws the atten- tion to the importance of determining proper expected yield
levels. Even in the field trials, either small plot trials, or farm level field trials, aiming to set new, higher planned Nmax val- ues than the present one (KITE, 2016; 59/2008 AM Decree).
Net income can diminish if advised NPK doses – affected by both soil NPK supplies and expected yield levels – are above the optimum.
In the classical N-, P- and K- demand part of the trial (Treatments 5 to 8), response to N fertilisation was 1.8 t/ha, to P, 0.3 t/ha, and, to K, 0.5 t/ha. Among the three field trials, soil N and K supplies were the lowest in this trial, and, as a result, responses to N and K fertilisation, the highest ones.
Responses to N, P and K fertilisation proved the soil NPK supply categories elaborated in the Pro Planta (PP) system to be sound.
In the four recommendation treatments (Treatments 1 to 4), elaborated by different advisory systems and approaches, the effect of soil heterogeneity common in sandy soils could also have an effect on the yields. Maize grain yields varied between 6.9 and 7.8 t/ha, practically independently from NPK doses (Table 2). Compared to the yield in Present Nmax treatment (150 kg/ha N), there was no yield surplus on the New planned Nmax treatment (180 kg/ha N) (Table 2).
C) Karcag, meadow chernozem soil
The Karcag field trial was in the middle of the three tri- als in respect of intensity of crop production. Medium crop density (70,000 plants/ha) and expected yield level (12.0 t/
ha) were introduced in this trial.
On average, the maize grain yield was around 9.0 t/ha, i.e., 3.0 t/ha less than the expected yield level. Expected yield levels in all the three sites should be adjusted the really accessible yield levels, both for economic and environmental protection purposes. Meteorological conditions in 2017/2018 were more or less favourable for maize production: average grain yield was 8.6 t/ha (Table 2). Due to a summer wind- storm, however, a maize stand was lodged. Harvested grain yields could also have been affected by that.
In the classical N-, P- and K- demand part of the trial (Treatments 5 to 8), response to N fertilisation was 1.4 t/
ha, to P 0.1 t/ha, and, to K, 0.0 t/ha. Responses to N, P and K fertilisation proved the soil NPK supply categories elabo- Table 2: Agronomic evaluation in field trials.
Treatment
Nmax 1 field trial Calcareous chernozem,
Nagyhörcsök (NH)
Nmax 2 field trial Humuseous sandy soil,
Őrbottyán (ŐB)
Nmax 3 field trial Meadow chernozem,
Karcag (KA) N P2O5 K2O Grain yield
t/ha N P2O5 K2O Grain yield
t/ha N P2O5 K2O Grain yield
kg/ha kg/ha kg/ha t/ha
PP 2 186 90 135 12.20 175 63 135 7.80 178 0 0 8.61
Present Nmax 170 106 170 12.51 150 77 168 7.23 160 55 68 8.18
Planned new Nmax 210 106 170 12.39 180 77 168 6.90 190 55 68 9.47
MÉM NAK 280 280 336 13.60 260 160 280 7.16 240 132 216 9.17
PK 0 100 200 10.80 0 100 200 5.89 0 100 200 7.18
NK 210 0 200 10.82 180 0 200 7.45 190 0 200 8.48
NP 210 100 0 12.29 180 100 0 7.24 190 100 0 8.96
NPK 210 100 200 11.99 180 100 200 7.71 190 100 200 8.56
LSD 5% - - - 1.57 - - - 1.74 - - - 1.29
Mean 185 110 176 12.08 163 85 169 7.17 167 68 119 8.58
Nagyhörcsök, Őrbottyán, Karcag: 5.0 kg/ha Zn; Karcag: 2,000 kg/ha CaCO3. Source: own composition
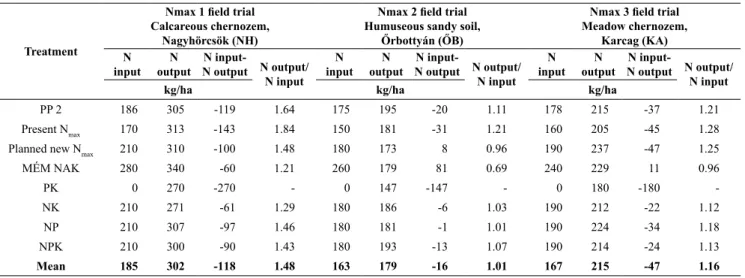
Table 3: NUE evaluation in field trials.
Treatment
Nmax 1 field trial Calcareous chernozem,
Nagyhörcsök (NH)
Nmax 2 field trial Humuseous sandy soil,
Őrbottyán (ŐB)
Nmax 3 field trial Meadow chernozem,
Karcag (KA) inputN N
output N input-
N output N output/
N input
inputN N
output N input-
N output N output/
N input
inputN N
output N input-
N output N output/
N input
kg/ha kg/ha kg/ha
PP 2 186 305 -119 1.64 175 195 -20 1.11 178 215 -37 1.21
Present Nmax 170 313 -143 1.84 150 181 -31 1.21 160 205 -45 1.28
Planned new Nmax 210 310 -100 1.48 180 173 8 0.96 190 237 -47 1.25
MÉM NAK 280 340 -60 1.21 260 179 81 0.69 240 229 11 0.96
PK 0 270 -270 - 0 147 -147 - 0 180 -180 -
NK 210 271 -61 1.29 180 186 -6 1.03 190 212 -22 1.12
NP 210 307 -97 1.46 180 181 -1 1.01 190 224 -34 1.18
NPK 210 300 -90 1.43 180 193 -13 1.07 190 214 -24 1.13
Mean 185 302 -118 1.48 163 179 -16 1.01 167 215 -47 1.16
rated in the Pro Planta (PP) system to be sound. In the four recommendation treatments (Treatments 1 to 4), elaborated by different advisory systems and approaches, the effect of summer windstorm and lodging could have an effect on the yields. Maize grain yields varied between 8.2 and 9.8 t/ha, practically independently from NPK doses (Table 2).
Comparing the grain yields of the New planned Nmax value treatments (190 kg/ha N) to the Present Nmax value (160 kg/ha N), there was a 1.3 t/ha surplus, which cannot be explained by the effect of the extra 30 kg/ha N applica- tion, but, rather, by the differences in the lodged maize stand.
Due to the fact that the Karcag meadow soil with clay loam soil texture has a water holding capacity above the optimum, a temporary water stand can also affect maize grain yields (Table 2).
As a summary, it can be stated that there was practically no difference between the maize grain yields of the Present and the New planned Nmax value treatments in two of the three sites (Nagyhörcsök and Őrbottyán). Further research is needed to demonstrate the real differences between the Present and the New planned Nmax values in Karcag meadow soil (Table 2). Responses to N, P and K fertilisation proved that the soil NPK supply categories elaborated in the Pro Planta (PP) system were sound.
The differences between expected and real yield levels draw the attention to the importance of determining proper expected yield levels. Expected yield levels should be adjusted the really accessible yield levels, both for economic and environmental protection purposes. In the average of the three sites, the response to N application was 1.4 t/ha, to P-, 0.5 t/ha and to K-, 0.0 t/ha. Amongst the recommendation treatments, the highest average yield was obtained at the MÉM NAK advice. Average yields in the other three treat- ments were more as the same.
Evaluation of the NUE
In case the soil N supplying capacity is not taken into consideration when estimating N fertiliser use efficiency, Nitrogen Use Efficiency (NUE) is determined by the ratio between N uptake or output and N applied or input. Accord-
ing to the EU N Expert Panel (EUNEP) approach, which does not take into account soil N supplying capacity, the optimum range is within 80 kg/ha N balance surpluses and 90% efficiencies. Higher N balance values result in enhanced risk of environmental pollution. On the other hand, higher efficiency values can lead to soil N depletion, according to the EUNEP approach.
A) Nagyhörcsök, calcareous chernozem soil
In all the treatments, NUE reached higher than 100%
efficiency (1.21 to 1.84), i.e. crop N uptake surpassed the amount of N applied. As a result, according to the EUNEP approach, among the three sites, this site showed the most unfavourable, the most soil N depleting NUE and N balance values (Table 3). In the classical N-, P- and K- demand part of the trial (Treatments 5 to 8), there was lower NUE value than in the four recommendation treatments (Treatments 1 to 4). The only exception was the intensive MÉM NAK treat- ment, in which the lowest NUE value was obtained all over the trial, but, still, far above the optimum interval (see Figure 1). According to the EUNEP approach, this treatment is con- sidered to be the least soil N depleting one. Comparing the Present Nmax to the New planned Nmax treatments, the former one is higher, which, from the point of view of the EUNEP approach, is more disadvantageous (Table 3). It is important to mention that in the year of 2017/2018 weather conditions were favourable for maize production, with 10.8 to 12.3 t/ha maize grain yields achieved (Table 2).
B) Őrbottyán, humuseous sandy soil
Of the three experimental sites, according to the EUNEP approach, the Őrbottyán trial, set up on a humuseous sandy soil, showed the best NUE values, as well as N balance val- ues (Table 3). In the classical N-, P- and K- demand part of the trial (Treatments 5 to 8), NUE values varied between 1.01 and 1.07. In the four recommendation treatments (Treat- ments 1 to 4) NUE values were between 0.69 and 1.21, with highest (most unfavourable) values in the Present Nmax (2.) treatment. According to the EUNEP approach NUE evalua-
tion, MÉM NAK treatment, with its 0.69 NUE value, and 81 kg/ha N balance, was situated below the optimum interval (Figure 1), and proved to less economic, as well as poten- tially polluting the environment (Table 3). It is important to mention that in the year of 2017/2018 weather conditions were favourable for maize production, with 7.2 to 7.7 t/ha maize grain yields achieved (Table 2).
The low NUE values were obtained due to the fact that expected yield levels were unrealistically high. The results in the Őrbottyán trial reveal that farmers, running their farms on fields with unfavourable soil properties and low natural soil fertility, should pay attention to their planned yield lev- els, as well as suggested N doses so that they would beset more realistically. In addition to this, the results verify that even with this being the case, there is no risk that the ratio between N output an N input should fall below the unfavour- able level of 50% (Table 3).
C) Karcag, meadow chernozem
The Nmax trial results set up in Karcag, on a meadow cher- nozem soil, were situated in between the other two experi- ments, however, showing more similar NUE and N bal- ance values to the Őrbottyán trial, according to the EUNEP approach (Table 3). In the classical N-, P- and K- demand part of the trial (Treatments 5 to 8), in the treatments with N application, NUE values varied between 1.12 and 1.18, which, according to the EUNEP approach, is slightly soil N depleting. In the four recommendation treatments (Treat- ments 1 to 4) NUE values were between 0.96 and 1.21. In the Present Nmax (2.) and New planned Nmax (3.) treatments, NUE values were practically the same (varying between 1.28 and 1.25) (Table 3). It is important to mention that in the year of 2017/2018 weather conditions were favourable for maize production, with 8.5 to 9.0 t/ha maize grain yields (Table 2).
Economic evaluation
Before starting the evaluation, it is important to note that fertiliser doses in the experiments – and therefore the costs – were significantly above the national average. While
the latter cost around 41,000 HUF (€120), the fertilisation cost of each treatment was several times higher, in some cases exceeding 200,000 HUF (€600). The MÉM NAK treat- ment was the most expensive in all cases. This system was developed decades ago at a time of low fertiliser prices and in many cases is based on the principle of soil fertilisation, leading to good, very good soil PK supplies. Due to the high expected yield levels, fertiliser doses exceeded the national average in all the other treatments as well. As a result, the cost of fertilisation in the experiment has become dominant within the total cost of production, something which is not true regarding the national situation. Because the purpose of the experiment was to investigate the effects of the high- est fertiliser doses, we assume this change was justified and does not diminish the relevance of the evaluation.
Comparison of treatments
It can be seen that the doses recommended by the MÉM NAK system are far higher than in all the other treatments, and that as a result, the fertilisation costs are the highest. The value of the extra yield due to the excess fertiliser applied is far outweighed by the cost increase, and therefore the lowest net profit was achieved in this treatment at all the three sites (Table 4).
Comparing the Present and New planned Nmax treatment, no significant difference can be detected in the average of the three sites. On the best and the least favourable production classes, the net profit was higher in the Present Nmax treat- ments, however, on the production class in Karcag which has medium attributes, the New planned Nmax treatment signifi- cantly increased profitability. This is due to the remarkable increase in yields at this site due to the higher nitrogen dose, which is not the case in the other two sites (Table 4).
From an economic point of view, PP 2 was clearly the most effective treatment. This is due to the fact that, even with low fertiliser input, that there was no noticeable reduc- tion in yields, moreover, on sandy soil this treatment pro- vided the best yield. All this confirms that the fertiliser doses recommended by the Pro Planta advisory system, based on the scientific evaluation of long-term experimental results, Table 4: Economic evaluation of the field trials.
Treatment
Nmax 1 field trial Calcareous chernozem,
Nagyhörcsök (NH)
Nmax 2 field trial Humuseous sandy soil,
Őrbottyán (ŐB)
Nmax 3 field trial Meadow chernozem,
Karcag (KA) Fertiliser
cost
Total input cost
duction Pro- value
profit Net Ft/ha
Fertiliser cost
Total input cost
duction Pro- value
Net profit Ft/ha
Fertiliser cost
Total input cost
duction Pro- value
profit Net Ft/ha
Ft/ha Ft/ha Ft/ha
PP 2 140,856 392,758 551,968 159,210 123,085 374,987 352,898 -22,089 62,544 314,446 389,545 75,099 Present Nmax 151,032 402,934 565,993 163,060 128,636 380,538 327,109 -53,429 99,228 351,130 370,090 18,960 Planned new Nmax 165,087 416,988 560,564 143,576 139,177 391,079 312,179 -78,900 109,769 361,671 428,454 66,782 MÉM NAK 315,141 567,043 615,309 48,265 234,217 486,119 323,942 -162,177 198,950 450,852 414,881 -35,972 PK 94,686 346,588 488,627 142,040 94,686 346,588 266,483 -80,105 94,686 346,588 324,847 -21,741 NK 116,968 368,870 489,532 120,663 106,427 358,329 337,062 -21,266 109,940 361,842 383,663 21,821 NP 125,293 377,195 556,040 178,845 114,752 366,654 327,561 -39,093 118,266 370,168 405,380 35,212 NPK 168,473 420,375 542,467 122,092 157,932 409,834 348,826 -61,008 161,446 413,348 387,282 -26,065 Mean 159,692 411,594 546,313 134,719 137,364 389,266 324,507 -64,758 119,354 371,256 388,018 16,762 Source: own composition
are both environmentally friendly and economically efficient (Csathó et al., 2007; Németh, 2006) (Table 4).
The treatments in the classical N-, P- and K- demand part of the trial (Treatments 5 to 8) varied significantly in terms of profitability. Nitrogen application resulted in higher sur- pluses, and in its absence the most significant yield reduction occurred. This was not the case with potassium and phos- phorus. Potassium had the lowest effect, and its absence did not cause any yield decreases in Nagyhörcsök and Karcag, but it did in the sandy soil with low K supplying capacity.
The effect of phosphorus was placed between the other two nutrients from an economic point of view (Table 4).
The planned yield levels were not achieved in the treat- ments at any of the soil productivity sites. The biggest defi- cit was in Őrbottyán; furthermore, significant differences in profitability are observable between the three soil produc- tivity sites. In all the treatments in Őrbottyán (sandy soils) negative net profits were obtained, which clearly indicates that the planned yield levels are unrealistic at this site. On the other hand, in Nagyhörcsök, with the highest yields, in all treatments significant net profits were obtained, with the highest value observed in the Present Nmax treatment. The net profit in the PP 2 treatment is slightly less than that. At the Karcag site, PP 2 treatment was the most favourable, even ahead of the New planned Nmax plots. Only the plots fertilised with the dose of MÉM NAK were loss-making at this site (Table 4).
If we examine the results of treatments on the average of the three sites, it can be concluded that the highest net profit can be achieved in the PP 2 treatment. Its value exceeds that of the New planned Nmax treatment by 60% (about 30,000 HUF/ha or €90 /ha). Comparing the Present and the New planned Nmax values, there is no significant difference, the profitability was more favourable at two production sites
with the application of the existing values and at one produc- tion site with the planned values (Table 4).
Discussion
As the European Union does not compensate for crop and income losses due to restrictions in Annex 3 of FVM (MARD) Decree No. 59/2008., efforts have been made to establish scientifically based New planned Nmax values so that agronomically justified N quantities can be applied without restriction to farms with higher yields in better soil potential areas. The Nmax experiments conducted on typical Hungarian soils provide an opportunity to evaluate the impact of each soil and treatment in terms of a complex agronomic, Nitro- gen Use Efficiency (NUE) and economical approach.
As a by-product of adopting an approach involving three different evaluations, various optimums were found at the experimental sites and treatments. The most significant differences were found between the optimum of the EU Expert Panel approach (NUE) and the economic approach (Figure 2).
Nevertheless, we consider it desirable and essential that the optimum interval of the new NUE approach should also take into account economic considerations, with particular attention to the much less favourable economic conditions faced by farmers in Central and Eastern European coun- tries as compared to their counterparts in Western European countries. Economic considerations can prevail when, while determining the N needs of the cultivated plants, we take the N supply of soils into account. This modification is especially significant on soil characterised by loam to clay soil texture and deep and humus rich soil “A” horizon. The findings of the Hungarian long-term nitrogen fertilisation experiments
–600 –500 –400 –300 –200 –100 0 100 200 300 400 500 600
ECON EUR 337,51
Régi N-max NH
PP 2 NH
Új N-max NH
NP NH
NPK NH
NK NH
Régi N-max KA
Új N-max KA
PP 2 KA
Régi N-max ŐB
MÉM NAK NH
NP KA
NPK KA
NK KA
PP 2 ŐB
NPK ŐB
NK ŐB
NP ŐB
MÉM NAK KA
Új N-max ŐB
MÉM NAK ŐB –1,50
–1,25 –1,00 –0,75 –0,50 –0,25 0,00 0,25 0,50 0,75 1,00 1,25 1,50
NUE OPT
Profit EUR/ha DIST. from NUE OPT
Figure 2: Correlation between the profit and the distance from the NUE optimum.
Columns: Net profits, line: Distance from the NUE optimum, i.e. NUE optimum minus actual NUE value.
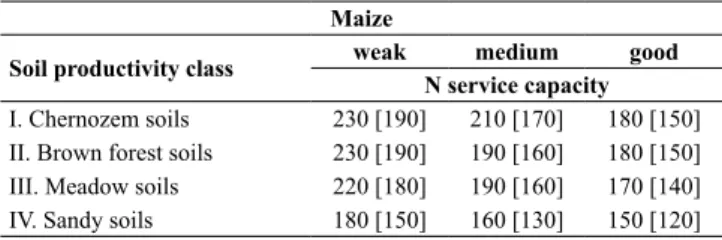
Table 5: The New planned Nmax values for maize.
Maize
Soil productivity class weak medium good N service capacity I. Chernozem soils 230 [190] 210 [170] 180 [150]
II. Brown forest soils 230 [190] 190 [160] 180 [150]
III. Meadow soils 220 [180] 190 [160] 170 [140]
IV. Sandy soils 180 [150] 160 [130] 150 [120]
230: New planned Nmax value (kg/ha); [190]: Present Nmax value (kg/ha) Source: own composition
confirmed that taking into account the nitrogen supplying capacity of the soils resulted high accessible yield levels and provided good net profit, while no decrease of soil organic matter content, or enhanced nitrate leaching was occurred.
As a result, and due to the compulsion to comply with the proposed NUE more intensive N farming requirements, it is an urgent task to develop and pass into law new and higher Nmax values for the main arable crops. A possible example for the New planned Nmax values can be seen in the next table (Table 5) for maize. When elaborating of the Present and the New planned Nmax values, the natural N supplying capacity of the soils were taken into account, therefore they meet the economic requirements as well.
As a result, and due to the compulsion to comply with the proposed NUE more intensive N farming requirements, it is an urgent task to develop and pass into law new and higher Nmax values for the main arable crops. A possible example for the New planned Nmax values can be seen in the next table (Table 5) for maize. When elaborating of the Present and the New planned Nmax values, the natural N supplying capacity of the soils were taken into account, therefore they meet the economic requirements as well.
Finally, it is important to highlight the need to continue the experiments in order to reduce the year effect and to refine the recommended values.
Acknowledgments
The work has been supported by the Hungarian Ministry of Agriculture (AGMF/61/2019).
References
Altieri, M.A. (2012): Convergence or divide in the movement for sustainable and just agriculture, 1–9. In Lichtfouse, E. (eds.):
Organic Fertilization, Soil Quality and Human Health. Sustain- able Agricultural Reviews. Springer, Dordrecht-Heidelberg- New York-London. https://doi.org/10.1007/978-94-007-4113- Cassman, K.G., Dobermann, A.R. and Walters, D.T. (2002): Agroe-3_1 cosystems, Nitrogen-use Efficiency and Nitrogen Management.
Ambio, 31 (2), 132–140. https://doi.org/10.1579/0044-7447- 31.2.132
Csathó, P. and Radimszky, L. (2009): Two worlds within EU27:
sharp contrasts in organic and mineral NP use, NP bal-
ances and soil P status. Widening and deepening gap be- tween Western and Central Europe. Communications in Soil Science and Plant Analysis, 40, 999–1019. https://doi.
org/10.1080/00103620802693151
Csathó, P. and Radimszky, L. (2012): Sustainable agricultural NP turnover in the EU 27 countries, 161–186. In Lichtfouse, E.
(eds.): Organic Fertilization, Soil Quality and Human Health.
Sustainable Agricultural Reviews. Springer, Dordrecht-Heidel- berg-New York-London. https://doi.org/10.1007/978-94-007- 4113-3_7
Csathó, P., Árendás, T.,Fodor, N. and Németh, T. (2007): A legelter- jedtebb hazai trágyázási szaktanácsadási rendszerek tesztelése szabadföldi kísérletekben. Agrokémia és Talajtan 56 (1), 173–
190. https://doi.org/10.1556/Agrokem.56.2007.1.13
European Environment Agency (2018): Nitrate Directive. https://
www.eea.europa.eu/archived/archived-content-water-topic/
water-pollution/prevention-strategies/nitrate-directive
Hajas, J. and Rázsó, I. (1969): Agriculture in numbers.
(Mezőgazdaság számokban) Mezőgazdasági Kiadó, Budapest.
(In Hungarian)
Mosier, A.R., Syers, J.K. and Freney J.R. (eds.) (2004): Agriculture and the Nitrogen Cycle: Assessing the Impacts of Fertilizer Use on Food Production and the Environment. Scientific Commit- tee on Problems of the Environment (SCOPE) series 65. Wash- ington, D.C., USA.
MTA ATK TAKI (2018): A Helyes Mezőgazdasági Gyakor- lat (HMGY) szabályrendszerében rögzített tilalmi időszak hosszának felülvizsgálata a rendelkezésre álló terhelési adatok elemzése, valamint környezeti összefüggés vizsgálatok elvég- zése. Jelentés. MTA ATK TAKI, Budapest.
Németh, T. (2006): Application of the Bray-Mitscherlich equation approach for economically and environmentally sound fer- tilization of field crops in Hungary. Communications in Soil Science and Plant Analysis, 37 (15-20), 2227–2247. https://doi.
org/10.1080/00103620600817556
Oenema, O., Brentrup, F. et al. (2016): EU Nitrogen Expert Pan- el. Nitrogen Use Efficiency (NUE) – Guidance document for assessing NUE at farm level. Wageningen University, Nether- lands.
Oenema, O., Witzke, H.P., Klimont, Z., Lesschen, J.P. and Velthof, G.L. (2009): Integrated assessment of promising measures to decrease nitrogen losses from agriculture in EU-27. Agricul- ture, Ecosystems & Environment, 133 (3-4), 280–288. https://
doi.org/10.1016/j.agee.2009.04.025
Stanners, D. and Bourdeau, P. (eds.) (1995): Europe’s Environ- ment: The Dobris Assessment. European Environment Agency.
Copenhagen, Denmark.
Tamminga, S. (1996): A review on environmental impacts of nu- tritional strategies in ruminants. Journal of Animal Science, 74 (12), 3112–3124. https://doi.org/10.2527/1996.74123112x Tilman, D., Cassman, K.G., Matson, P.A., Naylor, R. and Polasky,
S. (2002): Agricultural sustainability and intensive production practices. Nature, 418, 671–677. https://doi.org/10.1038/na- ture01014
Vrolijk, H., Poppe, K. and Keszthelyi, Sz. (2016): Collecting sus- tainability data in different organisational settings of the Euro- pean Farm Accountancy Data Network. Studies in Agricultural Economics, 118 (3), 138–144. https://doi.org/10.7896/j.1626 World Bank (2005): Food safety and agricultural health standards:
challenges for opportunities in developing country exports. Re- port No. 31207. World Bank, Washington, DC, USA.