This article is a pre-print copy of the original published article in Thrombosis Research. The definitive publisher-authenticated version is available online at:
https://doi.org/10.1016/j.thromres.2019.01.006
Neutrophil extracellular traps in thrombi retrieved during interventional treatment of ischemic arterial diseases
Ádám Z. Farkas,*1 Veronika J. Farkas,*1 István Gubucz,2 László Szabó,3 Krisztián Bálint,1 Kiril Tenekedjiev,4,5 Anikó I. Nagy,6 Péter Sótonyi,6 László Hidi,6 Zoltán Nagy,2 István Szikora,2 Béla Merkely6 and Krasimir Kolev1
1Department of Medical Biochemistry, Semmelweis University, Budapest, Hungary
2National Institute of Clinical Neurosciences, Budapest, Hungary
3Department of Functional and Structural Materials, Institute of Materials and Environmental Chemistry, Research Centre for Natural Sciences, Hungarian Academy of Sciences, Budapest, Hungary
4Department of Information Technology, Nikola Vaptsarov Naval Academy, Varna, Bulgaria
5Australian Maritime College, University of Tasmania, Launceston, Australia
6Heart and Vascular Center, Semmelweis University, Budapest, Hungary
*These authors contributed equally to the study
Correspondence: Krasimir Kolev, Semmelweis University, Department of Medical Biochemistry, 1094 Budapest, Tűzoltó utca 37-47., Hungary, tel.: +36 1 4591500/60035, fax:
+36 1 2670031, e-mail: Krasimir.Kolev@eok.sote.hu
Highlights
‐ Neutrophil extracellular traps (NETs) modify the structure and stability of fibrin.
‐ NET content of thrombi varies at different locations (brain, heart, peripheral arteries).
‐ DNA and histones in thrombi correlate with age and systemic inflammatory markers.
‐ The amount of fibrin is similar at all examined arterial locations.
‐ Thicker fibrin fibers are formed in coronaries than in brain and peripheral arteries.
Abstract
Introduction-The ultrastructure and cellular composition of thrombi has a profound effect on the outcome of acute ischemic stroke (AIS), coronary (CAD) and peripheral artery disease (PAD). Activated neutrophils release a web-like structure composed mainly of DNA and citrullinated histones, called neutrophil extracellular traps (NET) that modify the stability and lysability of fibrin. Here, we investigated the NET-related structural features of thrombi retrieved from different arterial localizations and their interrelations with routinely available clinical data.
Patients and methods-Thrombi extracted from AIS (n=78), CAD (n=66) or PAD (n=64) patients were processed for scanning electron microscopy, (immune)stained for fibrin, citrullinated histone H3 (cH3) and extracellular DNA. Fibrin fiber diameter, cellular components, DNA and cH3 were measured and analyzed in relation to clinical parameters.
Results-DNA was least present in AIS thrombi showing a 2.5-fold lower DNA/fibrin ratio than PAD, whereas cH3 antigen was unvaryingly present at all locations. The NET content of thrombi correlated parabolically with systemic inflammatory markers and positively with patients’ age. The median platelet content was lower in PAD (2.2%) than in either AIS (3.9%) or CAD (3.1%) and thrombi from smokers contained less platelets than non-smokers. Fibrin fibers were significantly thicker in male patients with CAD (median fiber diameter 76.3 nm) compared to AIS (64.1 nm) or PAD (62.1 nm) and their diameter correlated parabolically with systemic inflammatory markers.
Conclusions-The observed NET-related variations in thrombus structure shed light on novel determinants of thrombus stability that eventually affect both the spontaneous progress and therapeutic outcome of ischemic arterial diseases.
Keywords: Fibrin, Myocardial infarction, Neutrophil Extracellular Traps, Peripheral Artery Disease, Stroke
Abbreviations:
AIS Acute ischemic stroke
ASA Acetylsalicylic acid
CAD Coronary artery disease
cH3 Citrullinated histone H3
CRP C-reactive protein
FD50 Median of fluorescent signal ratio of fibrin/extracellular DNA
FH50 Median of fluorescent signal ratio of fibrin/citrullinated histone H3
NET Neutrophil extracellular trap
PAD Peripheral artery disease
SEM Scanning electron microscopy
sF Surface fibrin fiber occupancy
sPlt Surface platelet occupancy
WBC White blood cell
Introduction
Cardiovascular disorders remain the leading cause of death worldwide, coronary artery disease (CAD) and acute ischemic stroke (AIS) representing the two medical conditions with the strongest impact on mortality and disability [1]. The prevalence of peripheral artery disease (PAD) has also increased in the past years [2], thus contributing to the growing disease burden of arterial thrombotic disorders.
Intravascular clot formation has long been known to be linked to inflammation, but in the past decade a series of findings related to neutrophil extracellular traps (NETs) revealed new aspects of the role of inflammatory cells in hemostasis [3]. The scaffold of these web-like structures released by neutrophil granulocytes during a specific program of cell-death called NETosis [4] is composed mainly of DNA [5]. During the early phase of NETosis the arginine residues of histone proteins are being deiminated (citrullinated) by the enzyme peptidyl- arginine-deiminase 4, thus cH3 is considered to be a specific marker of NETs [6]. Strong evidence supports the role of NETs in both deep venous [7-11] and arterial thrombi [12-14], and they are now regarded as an additional scaffold of thrombus formation tightly intertwined with the fibrin matrix. In a previous study, we demonstrated massive presence of extracellular DNA and histones in thrombi removed with surgery from patients with PAD [15] and recent studies showed the presence of NETs in ischemic stroke thrombi [16, 17].
Tissue damage in ischemic cardiovascular disease is often a consequence of embolization from unstable thrombi [18], whereas the clinical outcome of the interventional or lytic treatment in AIS, CAD and PAD is also affected by the structural phenotype of fibrin, the primary matrix of thrombi [19]. The structural features of fibrin are greatly modified in the presence of NET or extracellular matrix components and this modification determines the mechanical and lytic stability of thrombi [15, 20, 21]. These facts justify the growing interest in investigating thrombus composition [22, 23], but very few data are available concerning the fibrin structure in relation to the cellular and NET content of thrombi in the clinical setting of
AIS. In view of the expanding application of mechanical thrombectomy to treat large vessel occlusions causing AIS, elaborate characterization of NET components in the culprit clot composition could refine the need for new therapeutics targeting the NETs [17], whereas associations of clot composition and routinely available clinical data, as well as comparisons with thrombi from other therapeutic interventions (CAD, PAD) could help the identification of etiology- and localization-specific predictors for optimal post-interventional treatment to prevent re-occlusion.
Patients and methods
The detailed methods section is available as an Online Resource.
Between 2014 and 2016, 208 consecutive patients (66 CAD, 64 PAD and 78 AIS) were prospectively enrolled (for patients’ characteristics see Online Resource Table I). Thrombi were collected during acute therapeutic catheter interventions in CAD, open surgery in PAD or via stent-retriever thrombectomy in AIS [24]. Informed written consent was obtained from all individual participants or their legal guardians. Our study was approved by the institutional and regional ethical board (Ref.#8/2014/18.09.2014). All procedures performed in studies involving human participants were in accordance with the ethical standards of the institutional and regional research committee and with the 1964 Helsinki declaration and its later amendments.
Thrombus occupancy by cells and fibrin was determined from morphological examination of scanning electron microscopy (SEM) images. Thrombus composition was then expressed as percentage of regions occupied by each component out of the total area of the image. The morphometric analysis also included the manual measurement of 300 fibrin fiber diameters followed by evaluation of their distribution using scripts running under Image Processing Toolbox of Matlab R2015a (Mathworks, Natick, MA) as previously described [25- 27].
Multiple (6 to 15, depending on the size of the thrombus sample) sections of each thrombus were fluorescently stained with the TOTO-3 nucleic acid dye for extracellular DNA and with indirect immunofluorescence staining for cH3 and fibrin. Confocal laser scanning microscopic images were taken and quantitatively analyzed based on the fibrin/DNA and fibrin/cH3 ratios determined from the image area covered by the respective fluorescent signal.
For statistical evaluation each thrombus was characterized by a single parameter, the median of these area ratios in the separate sections (FD50 and FH50 for fibrin/DNA and fibrin/cH3, respectively).
Regression analysis and statistical hypothesis testing were performed on an array of thrombus composition and routine clinical data of each patient. Previously described algorithms were used (Kuiper statistical test for equality of distribution [28], one-tail statistical test for median equality [25], linear regression models with response variable described as quadratic function of one or two explanatory variables [25]) with modifications detailed in the Online Resource.
Results and Discussion Extracellular DNA and cH3
Our previous in vitro [15] and a recent ex vivo [16] study provided evidence that NET components (DNA, histones) modify the structure of fibrin, increase its mechanical stability and render clots less sensitive to lysis with tissue-type plasminogen activator/plasminogen. In line with the recently reported findings in ischemic stroke thrombi [16, 17], our present work confirms the presence of NET components in AIS thrombi, but we also demonstrate that extracellular DNA content – the major meshwork-forming constituent of NETs – of AIS (median FD50 of 0.208) thrombi is similar to CAD and 2.5-fold lower than in PAD thrombi (median FD50 of 0.082, p=0.0013, Figure 1). Thus, compared to other artery locations, in AIS
the NET meshwork impedes the least the fibrinolytic therapeutic approach to restore the patency of occluded vessels, a fact that deserves attention when making therapeutic decisions in stroke. Diabetes also had a significant effect on the relative DNA content in PAD, the FD50 ratio was 2-fold higher in diabetic than in non-diabetic patients (0.0654 vs. 0.1383, p=0.0131).
Figure 1. Indirect immunofluorescent imaging and fibrin/DNA area ratio in arterial thrombi from coronary (CAD), peripheral artery disease (PAD), and acute ischemic stroke (AIS). Following interventional extraction of thrombi from coronary artery disease (A), peripheral artery disease (B) and acute ischemic stroke (C) patients, cryosections were prepared and treated with the fluorescent DNA dye TOTO-3, mouse anti-human fibrin and rabbit anti- human cH3 antibodies followed by the respective species-specific fluorescent anti-IgG antibodies as described in Patients and methods. Images were taken with a confocal laser
microscope (red, fibrin; green, cH3; blue, extracellular DNA). Based on the fluorescent signal the ratio of cross-section area occupied by fibrin and DNA was determined in 6-15 regions of each thrombus and the median values of these ratios for each thrombus (FD50) were evaluated (D). A lower value FD50 indicates a higher relative DNA content in clots. The columns and bars represent median and IQR values. The patient number in each group was nCAD=49, nPAD=57 and nAIS=64. p-values result from one-tailed hypothesis testing for medians (significant if p-value less than 0.05) using Bootstrap resampling of n’=10,000 for each statistical test.
During the early phase of NETosis the arginine residues of histone proteins are being deiminated (citrullinated) by the enzyme peptydil-arginine-deiminase 4, thus cH3 is considered to be a specific marker of NETs [6]. This antigen was present in all clots (FH50, Figure I in the Online Resource) – in line with the recently reported findings in ischemic stroke thrombi [16].
No significant quantitative differences were observed between cH3 content at different vascular locations, which could be attributed to the role of citrullination limited to triggering NET formation and thus differences in the tiny quantities of citrullinated histones sufficient to initiate NETosis are not necessarily detectable after the completion of the process when we performed the observations. Because thrombin is able to degrade citrullinated histones [29], extracellular DNA appears to be a more stable marker of NETosis in thrombi. Such an interpretation of the FD50 and FH50 findings is in line with our results regarding the effects of oral anticoagulants, as the treatment with such drugs leads to a two-fold higher relative cH3 content in all thrombi (FH50 decreased from 1.431 to 0.665, p=0.0174). Because of the common use of statins in hypercholesterolemia, we evaluated the effects of these drugs on the NET markers in dyslipidemic patients: neither FH50, nor FD50 was changed by this cholesterol-lowering medication.
In view of the stabilizing impact of NETs on thrombi, an important observation from our work was that both the DNA and the cH3 content, as hallmarks of NETs, correlated positively with the patients’ age (except for cH3 in AIS). The regression models used to evaluate the associations are described in the Online Resource (Tables II-III). FD50 showed an inverse correlation in all main groups up to the age of 57 years (R2adj=0.30 and 0.33 in AIS and
PAD and a stronger association in CAD, R2adj=0.99) (Table 1, Figure III in the Online Resource). In AIS no further associations with FD50 were revealed, but in CAD an inverse correlation was found between FD50 and fibrinogen level, and a parabolic association between FD50 and WBC count with a minimum at 11×103/µL (Figure IVB in the Online Resource). A parabolic regression model described the dependence of FD50 on C-reactive protein (CRP) in the range of 0-7.2 mg/L in PAD thrombi (Figure IVC in the Online Resource). Absolute neutrophil count showed similar, parabolic interrelation with FH50, with a minimum at about 5 to 8×10³/µL (Figure VI and Table II in the Online Resource). These data suggest the local inflammatory process accompanied by NET release in thrombi is associated with mild to moderate increase in the systemic signs of inflammation (WBC, CRP), whereas their extremely high systemic levels are probably related to additional loci, distinct from the thrombi.
FD50 FH50
R2adj n pANOVA R2adj n pANOVA
All patients
Neutrophil count - - - 0.38 28 1.22×10⁻³
Coronary artery disease
Age at intervention 0.99 21 2.98×10⁻¹¹ 0.71 21 6.09×10⁻⁵
WBC 0.48 35 1.50×10⁻⁵ - - -
Neutrophil count 0.89 13 1.81×10⁻⁴ - - -
Fibrinogen level 0.58 22 6.19×10⁻⁴ - - -
Peripheral artery disease
Age at operation 0.33 18 3.68×10⁻² 0.39 41 4.33×10⁻⁵
CRP 0.75 12 6.31×10⁻³ - - -
Acute ischemic stroke
Age at intervention 0.3 18 5.71x10⁻² - - -
Neutrophil count - - - 0.63 23 3.36×10⁻⁵
Table 1. Strength of association between median fibrin/DNA ratio (FD50), median fibrin/cH3 ratio (FH50) and patient age or inflammatory laboratory markers. The regression models and their coefficients for each dependence are presented as an Online Supplement (Tables II&III). WBC=white blood cell count, CRP=C-reactive protein, n=sample size, R2adj=adjusted coefficient of determination, pANOVA=p-value of the analysis of variance (significant if p-value less than 0.05), (-), no considerable dependence (R2adj<0.3), n=sample size constrained to variable range for which the dependence is valid (defined in Table II).
In AIS no significant association was found between FH50 and age at intervention, whereas in the CAD group FH50 showed an inverse correlation with age (R2adj=0.71). The same
association pattern could be observed in PAD between age 50 to 80, and a positive correlation above 80 years (n=11, R2adj=0.52, pANOVA=1.7×10⁻²). Because histones are known to confer mechanical and lytic resistance to fibrin [15], this data can be interpreted as an age-dependent clot-stabilizing effect, which suggests an improved response to lytic treatment in younger patients, as well as that stabilization of the structure in older patients could favor the success of mechanical intervention. In addition, in PAD the strength of association between the NET content of thrombi and patients’ age was increased by atherosclerotic etiology or systemic indicators of inflammation (CRP, leukocytosis, plasma fibrinogen) (Table II).
The age trend in FH50 of AIS patients was reinforced by malignant co-morbidities, known to exert an independent NET-promoting effect [30], to an R2adj value of 0.90 which points to an increased lytic resistance in this subgroup of patients (Table II). Generally (evaluating all main groups together) the interrelation of the local NET-marker FH50 and the systemic inflammatory indicators followed a rather complex trend in thrombi removed from patients with malignancy (Figure 2). Although FH50 correlated positively with WBC count at fibrinogen levels less than 4 g/l, the correlation was inverted at higher fibrinogen concentrations (n=20, R2adj=0.65, pANOVA=1.9×10⁻⁴).
Figure 2. The joint impact of fibrinogen and white blood cell count on the ratio of fibrin/cH3 in thrombi extracted from patients with malignancy. The regression model and its coefficients are presented as an Online Supplement (Table III). Regression surface is shown for data points (o) after outlier (x) rejection. FH50=The median of fluorescent signal ratio of fibrin/cH3, WBC=White blood cell count.
Platelets in thrombi
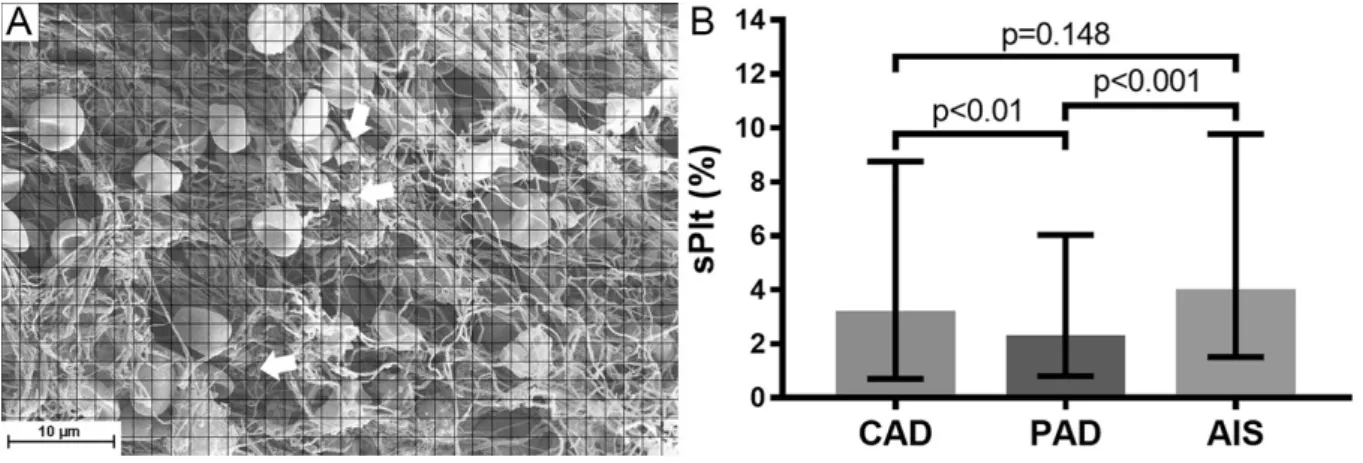
Because of the known direct [31-35] and indirect (through von Willebrand factor [36]) NET interactions with platelets and the role of platelets in fibrin formation [37], it was of interest to look at platelet content of the clots. Although in this study we did not observed any associations between measured platelet occupancy and NET components, the SEM analysis of cellular components of thrombi retrieved from AIS, CAD and PAD patients revealed a marked difference in their platelet content (sPlt, Figure 3). AIS thrombi showed 1.8-fold higher median platelet occupancy than PAD thrombi (sPlt 3.9 vs. 2.2%, p<0.001), whereas sPlt difference from CAD thrombi was observed only in male patients (4.9% in AIS vs. 2.8% in CAD, p=0.0032). These several-fold differences in sPlt can lead to major downstream alterations through the signal amplification of the coagulation cascade as platelets usually initiate clotting in arteries. Our sPlt results in CAD were similar to those reported before by others [38], however concerning AIS other studies found higher platelet content in thrombi [39, 40]. The inconsistency of these data could be a result of many factors: group heterogeneity, the smaller sample size in the earlier AIS studies, variations in the rheological conditions of the culprit sites of emboli causing stroke.
Figure 3. Platelet content of arterial thrombi from from coronary (CAD), peripheral artery disease (PAD), and acute ischemic stroke (AIS). The area of SEM images occupied by platelets or platelet conglomerates (indicated by arrows) was determined as percentage of the total thrombus area (sPlt) as described in Patients and methods (A). The number of observations (evaluated thrombus images, #O) were #OCAD=301 (from n=62 patients),
#OPAD=298 (n=61) and #OAIS=376 (n=77). B: The columns and bars represent median and IQR values. p-values result from one-tailed hypothesis testing for medians (significant if p-value less than 0.05) using Bootstrap resampling of n’=10,000 for each statistical test.
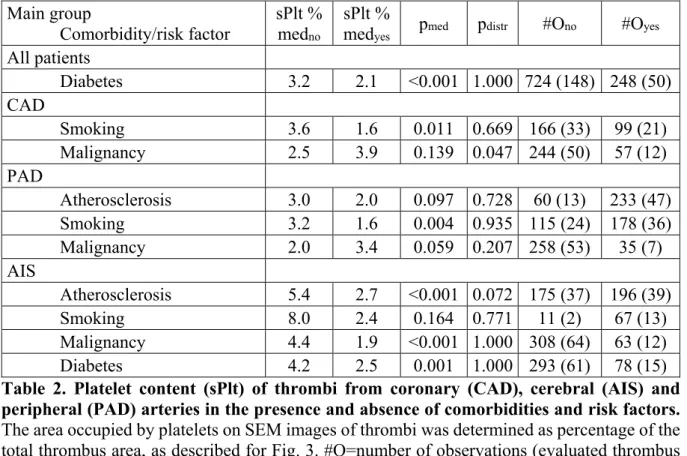
Several factors could be identified as modulators of platelet content (Table 2). In AIS with atherosclerotic etiology the median of the sPlt values (2.7%) was 2-fold lower than in the rest of the AIS cases (5.4%), but no such etiology-related difference was seen in PAD thrombi.
The presence of a malignant neoplasm was associated with a decreased median sPlt (1.9%) compared to patients with no malignant comorbidity (4.4%) only in AIS thrombi, but not in CAD and PAD. In thrombi removed from diabetic patients we measured lower sPlt values (2.1% compared to 3.2% in non-diabetic patients, p<0.001). Renal insufficiency had no significant effects on the investigated structural parameters. Smoking is a recognized risk factor in ischemic cardiovascular diseases, but a recent study showed that in ST-elevation myocardial infarction the platelet content of thrombi was not altered by smoking [41]. In the current study we observed that in all main groups, the size of which allowed for statistical evaluation, the thrombus occupancy by platelets was more than two-fold lower in active smokers compared to non-smokers, median sPlt 3.6% vs. 1.6% in CAD and 3.2% vs. 1.6% in PAD (there were only 2 documented non-smokers in the AIS group, thus no statistical evaluation could be done). This
surprising finding could be attributed to a phenomenon observed in studies designed to evaluate platelet responsiveness to clopidogrel. Whole blood aggregation-based assays indicated improved drug-response in smokers compared to non-smokers (“smokers’ paradox”). However, a careful analysis of the laboratory data revealed that this apparent improvement in the inhibition of platelet reactivity in whole blood aggregation is related to an off-drug effect of hematocrit [42, 43]. Smokers are known to have higher hemoglobin levels [44] and in our study a similar difference was observed with blood hemoglobin of 8.6 mmol/L in smokers (n=74) versus 7.9 mmol/L in non-smokers (n=61, p=0.0124), which could contribute to the observed difference in the platelet content of thrombi. Interestingly, blood platelet content was not associated with sPlt.
Main group
Comorbidity/risk factor sPlt % medno
sPlt %
medyes pmed pdistr #Ono #Oyes
All patients
Diabetes 3.2 2.1 <0.001 1.000 724 (148) 248 (50)
CAD
Smoking 3.6 1.6 0.011 0.669 166 (33) 99 (21)
Malignancy 2.5 3.9 0.139 0.047 244 (50) 57 (12)
PAD
Atherosclerosis 3.0 2.0 0.097 0.728 60 (13) 233 (47)
Smoking 3.2 1.6 0.004 0.935 115 (24) 178 (36)
Malignancy 2.0 3.4 0.059 0.207 258 (53) 35 (7)
AIS
Atherosclerosis 5.4 2.7 <0.001 0.072 175 (37) 196 (39)
Smoking 8.0 2.4 0.164 0.771 11 (2) 67 (13)
Malignancy 4.4 1.9 <0.001 1.000 308 (64) 63 (12)
Diabetes 4.2 2.5 0.001 1.000 293 (61) 78 (15)
Table 2. Platelet content (sPlt) of thrombi from coronary (CAD), cerebral (AIS) and peripheral (PAD) arteries in the presence and absence of comorbidities and risk factors.
The area occupied by platelets on SEM images of thrombi was determined as percentage of the total thrombus area, as described for Fig. 3. #O=number of observations (evaluated thrombus images); the numbers in parentheses after the #O indicate the numbers of patients included in the respective groups; med=median; no/yes in subscript refers to the presence of the respective comorbidity/risk factor; pmed=p-value resulting from one-tailed hypothesis testing for medians (significant if p-value less than 0.05); pdistr=p-value from Kuiper-test for distributions performed with Bootstrap resampling of n=10,000 for each statistical test.
Fibrin content and fibrin fiber thickness
Because of the known effects of NET components on purified fibrin structure [15], in the present study we investigated the alterations in fibrin content and fiber thickness in thrombi.
Although the fibrin fiber occupancy (sF) was statistically higher in PAD thrombi (98.1±5.6%) compared to AIS (97.1±7.93%, p=0.043) or CAD (96.8±8.1%, p=0.0081) groups, these differences were not considerable in magnitude and thus fibrin content could be used as a reference value for the content of NET constituents (justifying the interpretation of the FD50 and FH50 ratio values as measures of DNA and cH3 content of thrombi).
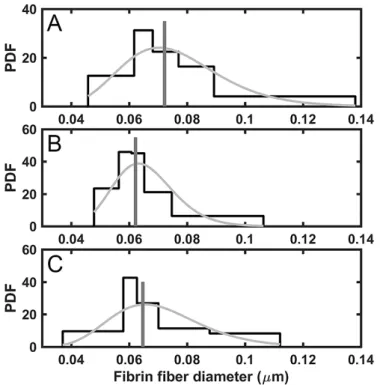
Fibrin fiber thickness has a direct effect on the viscoelastic properties of the clots and their mechanical stability [45]. The median of fibrin fiber diameter measured in this study was significantly higher in CAD thrombi compared to AIS or PAD samples (Figure 4). These tendencies in the fiber size of the three main groups were due to the structural pattern of fibrin in male patients (median fiber diameter in CAD: 76.3 nm [67.2-90.8, n=41; AIS: 64.1 nm [58.6- 85.3] n=46, p=0.0093 compared to CAD; PAD: 62.1 nm [57.4-75.2], n=34, p=0.0002 compared to CAD), whereas fiber diameter did not differ in females from these groups. Because the mechanical stability of thicker fibrin fibers is higher [45], this data indicates that thrombi of male CAD are the most stable. Furthermore, chronic acetylsalicylic acid (ASA) treatment prior to the acute ischemic event was associated with an increased fiber diameter only in males (No ASA: 64.4 nm [58.6-78.4] n=45; ASA: 70.9 nm [61.9-88.8] n=68, p=0.022). ASA had no other significant effects on the measured structural parameters. Regarding comorbidities, accompanying malignant neoplasms reduced fibrin fiber thickness only in PAD (No malignant comorbidity: 64.3 nm [59.2-73.8] n=53 vs. malignant comorbidity: 57.9 nm [54.1-58.7], n=7, p=0.018), but not in AIS and CAD.
The alterations in fibrin structure cannot be attributed to the effect of NETs, because PAD thrombi showed the highest relative DNA and cH3 content and the thinnest fibers,
whereas in purified fibrin clots DNA and histones increase the fiber diameter [15]. This discrepancy could be explained at least in part by differences in pre-procedural medication.
While all CAD patients received chronic ASA prophylaxis, only a quarter of the AIS and half of the PAD patients were treated with ASA prior the acute intervention. ASA is known to have platelet-independent effects, such as fibrin acetylation, which leads to thicker fibers [46, 47].
Clinical trials demonstrate sex differences in response to ASA treatment [48], which is in agreement with our data showing that ASA treatment results in thicker fibrin fibers only in male patients.
Figure 4. Fibrin fiber diameter in thrombi removed from different localizations. Manual measurement of 300 fibrin fiber diameters was performed on 5 SEM images of each thrombus followed by evaluation of their distribution. A: Coronary artery disease (CAD), B: Peripheral artery disease (PAD), C: Acute ischemic stroke (AIS). The graphs show the probability density function (PDF) of the empiric distribution (black histogram) and the fitted theoretical lognormal distribution (gray curve). Median values are indicated by vertical lines. The number of thrombi in each group was nCAD=62, nPAD=61, nAIS=77. Both the PAD (p=0.0026) and the AIS group (p=0.0132) had a significantly lower median fibrin fiber diameter, as compared to CAD samples according to one-tailed hypothesis test (significant if p-value less than 0.05) using Bootstrap resampling of n’=10,000.
Out of the three main groups only in AIS thrombi a parabolic dependence of fibrin fiber median on CRP was found with a minimum at about 5 mg/L CRP (n=16, R2adj=0.48,
pANOVA=1.1×10⁻⁶). CAD thrombi showed a similar correlation between the median diameter of fibrin fibers in thrombi and another acute phase protein, the plasma fibrinogen with a minimum at 4.0 g/L (n=35, R2adj=0.35, pANOVA=1.9×10⁻⁴, Figure II and Table II in the Online Resource).
The previously reported data on the association of fibrin structure and CRP are inconsistent and controversial with studies variably showing that: 1) CRP-treated fibrin clots had thicker fibrin fibers [49]; 2) a lower CRP (<2 mg/L) was associated with greater fibrin fiber diameters compared to CRP>5 mg/L in thrombi removed from CAD [50]. In our study fibrin fiber diameters did not differ significantly in CAD patients with low CRP (<5 mg/L), compared to those with higher values (71.88 nm [63.34-86.24] n=43 vs. 72.26 nm [61.12-98.48], n=18, p=0.4825) probably due to the dominant ASA effect discussed above. Plasma fibrinogen level also showed a correlation with symptom-to-intervention time (Figure VII and Table II in the Online Resource). A strong parabolic regression (n=35, R2adj=0.34, pANOVA=8.3×10⁻⁸) was observed in thrombi retrieved in less than 24 hours after the onset of symptoms, with the minimum value at about 6 hours. CRP showed no significant association with time. Similarly, we did not identify any significant associations between symptom-to-intervention time and platelet occupancy, fiber diameter, FD50 or FH50.
Study limitations
Our study has several limitations arising both from the extraction and the processing of thrombi. We were able to study only thrombi that had been successfully retrieved. Moreover, even removed thrombi could have been partially fragmented, without the embolic debris, which might not be completely representative of the whole in situ clot structure. The extraction of clots was performed using different techniques at the different locations (heart, brain, peripheral artery), which in the case of thrombus aspiration may lead to the distortion of structure. Another source of error is the heterogeneity of thrombi, especially if we consider the old age of some
peripheral clots. It is highly probable that these samples contain older, more organized parts as well as fresh sections only recently formed on the surface with distinct structural differences.
Finally, there are numerous factors that can affect thrombus structure, and thus it is hard to evaluate the effects of only one isolated determinant. These limitations were at least partially overcome by the number of processed samples, by imaging multiple sections from different parts of the thrombi, and using a robust statistical evaluation, including the homogeneity verification of the compared groups.
Conclusion
This study provides comparative data on the NET content and related platelet occupancy and fibrin structure of thrombi extracted from patients with acute ischemic stroke, myocardial infarction and peripheral artery disease. These results further our understanding of the structural determinants of the mechanical and lytic stability of thrombi and thus they may contribute to refine the strategies for interventional or enzymatic treatment of acute thrombotic episodes, as well as to provide clues for targeted secondary prevention.
Acknowledgements
The authors are grateful to A. Tanka-Salamon for the help in immunostaining and confocal laser scanning microscopy imaging, I. Kovalszky for providing the cryosection equipment and to Gy. Oravecz for the help in preparing the samples.
Funding
This work was supported by the Hungarian National Research, Development and Innovation Office (NKFIH) [grant number 112612 and 129528 to K.K.]; the Higher Education Institutional Excellence Programme of the Ministry of Human Capacities in Hungary, within
the framework of the Molecular Biology thematic programme of the Semmelweis University [to K.K.] and the János Bolyai Scholarship of the Hungarian Academy of Sciences [to A.I.N.].
Conflict of interest: The authors declare that they have no conflict of interest.
References
1. The top 10 causes of death. World Health Organization. 2017.
http://www.who.int/mediacentre/factsheets/fs310/en/. Accessed July 3 2018.
2. Fowkes FG, Rudan D, Rudan I, Aboyans V, Denenberg JO, McDermott MM et al. Comparison of global estimates of prevalence and risk factors for peripheral artery disease in 2000 and 2010: a systematic review and analysis. Lancet. 2013;382(9901):1329-40. doi:10.1016/S0140-6736(13)61249- 0.
3. Brinkmann V, Reichard U, Goosmann C, Fauler B, Uhlemann Y, Weiss DS et al. Neutrophil extracellular traps kill bacteria. Science. 2004;303(5663):1532-5. doi:10.1126/science.1092385.
4. Fuchs TA, Abed U, Goosmann C, Hurwitz R, Schulze I, Wahn V et al. Novel cell death program leads to neutrophil extracellular traps. J Cell Biol. 2007;176(2):231-41. doi:10.1083/jcb.200606027.
5. Wang Y, Li M, Stadler S, Correll S, Li P, Wang D et al. Histone hypercitrullination mediates chromatin decondensation and neutrophil extracellular trap formation. J Cell Biol. 2009;184(2):205-13.
doi:10.1083/jcb.200806072.
6. Leshner M, Wang S, Lewis C, Zheng H, Chen XA, Santy L et al. PAD4 mediated histone hypercitrullination induces heterochromatin decondensation and chromatin unfolding to form neutrophil extracellular trap-like structures. Front Immunol. 2012;3:307. doi:10.3389/fimmu.2012.00307.
7. Fuchs TA, Brill A, Duerschmied D, Schatzberg D, Monestier M, Myers DD, Jr. et al. Extracellular DNA traps promote thrombosis. Proc Natl Acad Sci U S A. 2010;107(36):15880-5.
doi:10.1073/pnas.1005743107.
8. Savchenko AS, Martinod K, Seidman MA, Wong SL, Borissoff JI, Piazza G et al. Neutrophil extracellular traps form predominantly during the organizing stage of human venous thromboembolism development. J Thromb Haemost. 2014;12(6):860-70. doi:10.1111/jth.12571.
9. von Bruhl ML, Stark K, Steinhart A, Chandraratne S, Konrad I, Lorenz M et al. Monocytes, neutrophils, and platelets cooperate to initiate and propagate venous thrombosis in mice in vivo. J Exp Med. 2012;209(4):819-35. doi:10.1084/jem.20112322.
10. Martinod K, Demers M, Fuchs TA, Wong SL, Brill A, Gallant M et al. Neutrophil histone modification by peptidylarginine deiminase 4 is critical for deep vein thrombosis in mice. Proc Natl Acad Sci U S A. 2013;110(21):8674-9. doi:10.1073/pnas.1301059110.
11. van Montfoort ML, Stephan F, Lauw MN, Hutten BA, Van Mierlo GJ, Solati S et al. Circulating nucleosomes and neutrophil activation as risk factors for deep vein thrombosis. Arterioscler Thromb Vasc Biol. 2013;33(1):147-51. doi:10.1161/ATVBAHA.112.300498.
12. Borissoff JI, Joosen IA, Versteylen MO, Brill A, Fuchs TA, Savchenko AS et al. Elevated levels of circulating DNA and chromatin are independently associated with severe coronary atherosclerosis and a prothrombotic state. Arterioscler Thromb Vasc Biol. 2013;33(8):2032-40.
doi:10.1161/ATVBAHA.113.301627.
13. de Boer OJ, Li X, Teeling P, Mackaay C, Ploegmakers HJ, van der Loos CM et al. Neutrophils, neutrophil extracellular traps and interleukin-17 associate with the organisation of thrombi in acute myocardial infarction. Thromb Haemost. 2013;109(2):290-7. doi:10.1160/TH12-06-0425.
14. Stakos DA, Kambas K, Konstantinidis T, Mitroulis I, Apostolidou E, Arelaki S et al. Expression of functional tissue factor by neutrophil extracellular traps in culprit artery of acute myocardial infarction.
Eur Heart J. 2015;36(22):1405-14. doi:10.1093/eurheartj/ehv007.
15. Longstaff C, Varju I, Sotonyi P, Szabo L, Krumrey M, Hoell A et al. Mechanical Stability and Fibrinolytic Resistance of Clots Containing Fibrin, DNA, and Histones. J Biol Chem.
2013;288(10):6946-56. doi:10.1074/jbc.M112.404301.
16. Laridan E, Denorme F, Desender L, Francois O, Andersson T, Deckmyn H et al. Neutrophil extracellular traps in ischemic stroke thrombi. Ann Neurol. 2017. doi:10.1002/ana.24993.
17. Ducroux C, Di Meglio L, Loyau S, Delbosc S, Boisseau W, Deschildre C et al. Thrombus Neutrophil Extracellular Traps Content Impair tPA-Induced Thrombolysis in Acute Ischemic Stroke. Stroke.
2018;49(3):754-7. doi:10.1161/STROKEAHA.117.019896.
18. Schwartz RS, Burke A, Farb A, Kaye D, Lesser JR, Henry TD et al. Microemboli and microvascular obstruction in acute coronary thrombosis and sudden coronary death: relation to epicardial plaque histopathology. J Am Coll Cardiol. 2009;54(23):2167-73. doi:10.1016/j.jacc.2009.07.042.
19. Undas A, Ariens RA. Fibrin clot structure and function: a role in the pathophysiology of arterial and venous thromboembolic diseases. Arterioscler Thromb Vasc Biol. 2011;31(12):e88-99.
doi:10.1161/ATVBAHA.111.230631.
20. Rottenberger Z, Komorowicz E, Szabo L, Bota A, Varga Z, Machovich R et al. Lytic and mechanical stability of clots composed of fibrin and blood vessel wall components. J Thromb Haemost.
2013;11(3):529-38. doi:10.1111/jth.12112.
21. Komorowicz E, Balazs N, Varga Z, Szabo L, Bota A, Kolev K. Hyaluronic acid decreases the mechanical stability, but increases the lytic resistance of fibrin matrices. Matrix Biol. 2016.
doi:10.1016/j.matbio.2016.12.008.
22. Sporns PB, Hanning U, Schwindt W, Velasco A, Minnerup J, Zoubi T et al. Ischemic Stroke: What Does the Histological Composition Tell Us About the Origin of the Thrombus? Stroke.
2017;48(8):2206-10. doi:10.1161/strokeaha.117.016590.
23. Gounis MJ, Chapot R. Histological Composition and the Origin of the Thrombus: A New Diagnostic Assay for Secondary Stroke Prevention? Stroke. 2017;48(8):2040-1.
doi:10.1161/STROKEAHA.117.017630.
24. Campbell BC, Mitchell PJ, Kleinig TJ, Dewey HM, Churilov L, Yassi N et al. Endovascular therapy for ischemic stroke with perfusion-imaging selection. N Engl J Med. 2015;372(11):1009-18.
doi:10.1056/NEJMoa1414792.
25. Kovacs A, Sotonyi P, Nagy AI, Tenekedjiev K, Wohner N, Komorowicz E et al. Ultrastructure and composition of thrombi in coronary and peripheral artery disease: correlations with clinical and laboratory findings. Thromb Res. 2015;135(4):760-6. doi:10.1016/j.thromres.2015.02.004.
26. Varju I, Sotonyi P, Machovich R, Szabo L, Tenekedjiev K, Silva MM et al. Hindered dissolution of fibrin formed under mechanical stress. J Thromb Haemost. 2011;9(5):979-86. doi:10.1111/j.1538- 7836.2011.04203.x.
27. Nikolova N, Toneva-Zheynova D, Tenekedjiev K, Kolev K. Monte Carlo Statistical Tests for Identity of Theoretical and Empirical Distributions of Experimental Data. In: Chan WKW, editor.
Theory and Applications of Monte Carlo Simulations. IntechOpen: InTech; 2013. p. 1-26.
28. Nikolova N, Chai S, Ivanova SD, Kolev K, Tenekedjiev K. Bootstrap Kuiper Testing of the Identity of 1D Continuous Distributions using Fuzzy Samples. International Journal of Computational Intelligence Systems. 2015;8 (Suppl. 2):63-75. doi:10.1080/18756891.2015.1129592.
29. Barranco-Medina S, Pozzi N, Vogt AD, Di Cera E. Histone H4 promotes prothrombin autoactivation. J Biol Chem. 2013;288(50):35749-57. doi:10.1074/jbc.M113.509786.
30. Demers M, Krause DS, Schatzberg D, Martinod K, Voorhees JR, Fuchs TA et al. Cancers predispose neutrophils to release extracellular DNA traps that contribute to cancer-associated thrombosis. Proc Natl Acad Sci U S A. 2012;109(32):13076-81. doi:10.1073/pnas.1200419109.
31. Pereira LF, Marco FM, Boimorto R, Caturla A, Bustos A, De la Concha EG et al. Histones interact with anionic phospholipids with high avidity; its relevance for the binding of histone-antihistone immune complexes. Clin Exp Immunol. 1994;97(2):175-80.
32. Watson K, Gooderham NJ, Davies DS, Edwards RJ. Nucleosomes bind to cell surface proteoglycans.
J Biol Chem. 1999;274(31):21707-13.
33. Semeraro F, Ammollo CT, Morrissey JH, Dale GL, Friese P, Esmon NL et al. Extracellular histones promote thrombin generation through platelet-dependent mechanisms: involvement of platelet TLR2 and TLR4. Blood. 2011;118(7):1952-61. doi:10.1182/blood-2011-03-343061.
34. Clejan L, Menahem H. Binding of deoxyribonucleic acid to the surface of human platelets. Acta Haematol. 1977;58(2):84-8.
35. Dorsch CA. Binding of single-strand DNA to human platelets. Thromb Res. 1981;24(1-2):119-29.
36. Ward CM, Tetaz TJ, Andrews RK, Berndt MC. Binding of the von Willebrand factor A1 domain to histone. Thromb Res. 1997;86(6):469-77.
37. Collet JP, Montalescot G, Lesty C, Weisel JW. A structural and dynamic investigation of the facilitating effect of glycoprotein IIb/IIIa inhibitors in dissolving platelet-rich clots. Circ Res.
2002;90(4):428-34.
38. Zalewski J, Bogaert J, Sadowski M, Woznicka O, Doulaptsis K, Ntoumpanaki M et al. Plasma fibrin clot phenotype independently affects intracoronary thrombus ultrastructure in patients with acute myocardial infarction. Thromb Haemost. 2015;113(6):1258-69. doi:10.1160/TH14-09-0801.
39. Niesten JM, van der Schaaf IC, van Dam L, Vink A, Vos JA, Schonewille WJ et al. Histopathologic composition of cerebral thrombi of acute stroke patients is correlated with stroke subtype and thrombus attenuation. PLoS One. 2014;9(2):e88882. doi:10.1371/journal.pone.0088882.
40. Kim SK, Yoon W, Kim TS, Kim HS, Heo TW, Park MS. Histologic Analysis of Retrieved Clots in Acute Ischemic Stroke: Correlation with Stroke Etiology and Gradient-Echo MRI. AJNR Am J Neuroradiol. 2015;36(9):1756-62. doi:10.3174/ajnr.A4402.
41. Fuijkschot WW, Groothuizen WE, Appelman Y, Radonic T, van Royen N, van Leeuwen MA et al.
Inflammatory cell content of coronary thrombi is dependent on thrombus age in patients with ST- elevation myocardial infarction. J Cardiol. 2017;69(1):394-400. doi:10.1016/j.jjcc.2016.10.003.
42. Kim YG, Suh JW, Kang SH, Park JJ, Yoon CH, Cho YS et al. Cigarette Smoking Does Not Enhance Clopidogrel Responsiveness After Adjusting VerifyNow P2Y12 Reaction Unit for the Influence of Hemoglobin Level. JACC Cardiovasc Interv. 2016;9(16):1680-90. doi:10.1016/j.jcin.2016.05.036.
43. Kim YG, Suh JW, Sibbing D, Kastrati A, Ko YG, Jang Y et al. A laboratory association between hemoglobin and VerifyNow P2Y12 reaction unit: A systematic review and meta-analysis. Am Heart J.
2017;188:53-64. doi:10.1016/j.ahj.2017.03.006.
44. Nordenberg D, Yip R, Binkin NJ. The effect of cigarette smoking on hemoglobin levels and anemia screening. JAMA. 1990;264(12):1556-9.
45. Weisel JW. Structure of fibrin: impact on clot stability. J Thromb Haemost. 2007;5 Suppl 1:116-24.
doi:10.1111/j.1538-7836.2007.02504.x.
46. He S, Bark N, Wang H, Svensson J, Blomback M. Effects of acetylsalicylic acid on increase of fibrin network porosity and the consequent upregulation of fibrinolysis. J Cardiovasc Pharmacol.
2009;53(1):24-9. doi:10.1097/FJC.0b013e3181953e0f.
47. Bjornsson TD, Schneider DE, Berger H, Jr. Aspirin acetylates fibrinogen and enhances fibrinolysis.
Fibrinolytic effect is independent of changes in plasminogen activator levels. J Pharmacol Exp Ther.
1989;250(1):154-61.
48. Harris WH, Salzman EW, Athanasoulis CA, Waltman AC, DeSanctis RW. Aspirin prophylaxis of venous thromboembolism after total hip replacement. N Engl J Med. 1977;297(23):1246-9.
doi:10.1056/NEJM197712082972302.
49. Li R, Ren M, Luo M, Chen N, Zhang Z, Luo B et al. Monomeric C-reactive protein alters fibrin clot properties on endothelial cells. Thromb Res. 2012;129(5):e251-6. doi:10.1016/j.thromres.2012.03.014.
50. Undas A, Plicner D, Stepien E, Drwila R, Sadowski J. Altered fibrin clot structure in patients with advanced coronary artery disease: a role of C-reactive protein, lipoprotein(a) and homocysteine. J Thromb Haemost. 2007;5(9):1988-90. doi:10.1111/j.1538-7836.2007.02637.x.
ONLINE SUPPLEMENT
Neutrophil extracellular traps in thrombi retrieved during interventional treatment of ischemic arterial diseases
Ádám Z. Farkas,1 Veronika J. Farkas,1 István Gubucz,2 László Szabó,3 Krisztián Bálint,1 Kiril Tenekedjiev,4,5 Anikó I. Nagy,6 Péter Sótonyi,6 László Hidi,6 Zoltán Nagy,2 István Szikora,2 Béla Merkely6 and Krasimir Kolev1
1Department of Medical Biochemistry, Semmelweis University, Budapest, Hungary
2National Institute of Clinical Neurosciences, Budapest, Hungary
3Department of Functional and Structural Materials, Institute of Materials and Environmental Chemistry, Research Centre for Natural Sciences, Hungarian Academy of Sciences, Budapest, Hungary
4Department of Information Technology, Nikola Vaptsarov Naval Academy, Varna, Bulgaria
5Australian Maritime College, University of Tasmania, Launceston, Australia
6Heart and Vascular Center, Semmelweis University, Budapest, Hungary
Patient characteristics
Between 2014 and 2016, 208 consecutive patients (66 coronary artery disease, CAD patients; 64 peripheral artery disease, PAD patients and 78 acute ischemic stroke, AIS patients) were prospectively enrolled. Clinical characteristics and basic laboratory findings of the patient cohort are summarized in supplementary Table I. Atherosclerosis was diagnosed if atherosclerotic plaques were visible during the procedure or via carotid ultrasound (B mode). The patients were considered dyslipidemic if they had elevated fasting blood cholesterol or triglyceride levels, or were on lipid lowering therapy. Thrombophilia was determined from patient history.
Thrombus collection
In the case of CAD and PAD patients thrombi were collected during acute therapeutic catheter interventions and operations, as previously described [1]. In AIS, thrombi were removed via stent-retriever thrombectomy from acutely occluded large vessels of the circle of Willis. All patients with a definite diagnosis of AIS eligible for mechanical thrombectomy were included during the study period providing that a clot was successfully removed. Prior to mechanical thrombectomy recombinant tissue-type plasminogen activator was administered to patients who were eligible for intravenous thrombolysis. The study was approved by the institutional and regional ethical board (Ref.#8/2014/18.09.2014) and informed written consent was obtained from all participants or their legal guardians. The research also conforms to the principles outlined in the Declaration of Helsinki.
Scanning Electron Microscope (SEM) imaging
Samples were fixed and processed immediately after extraction according to a previously published method [2], which was followed by taking randomly selected images from separate parts of thrombi to control for composition heterogeneity. Altogether 10 images were taken of each thrombus with SEM EVO40 (Carl Zeiss GmbH, Oberkochen, Germany), using two different magnifications (5000x, 20000x). Surface occupancy of cellular components and fibrin network was determined in typically 5 images (exceptionally 4) at the lower magnification after dividing the images to 864 equal sized square regions of interest using Photoshop 7.0.1 CE (Adobe, San José, CA, USA) and based on morphological characteristics each region was classified as occupied by fibrin, platelets, other blood cells or their combinations. Thrombus composition was then calculated as percentage of regions occupied by each component out of the total area of the image as previously described [3]. The morphometric analysis also included the manual measurement of 300 fibrin fiber diameters followed by evaluation of their distribution using scripts running under Image Processing Toolbox of MatLab R2015a (Mathworks, Natick, MA) as previously described [1, 2, 4].
Immunofluorescent imaging
Thrombus samples were placed in isopentane immediately after intervention and stored at -80°C until further processing.
Cryosections of 6 µm thickness were made from 6 to 15 different areas of the thrombi, depending on thrombus size. Extracellular
human citrullinated histone H3 monoclonal antibodies (ab5103, Abcam, Cambridge, UK). To visualize fibrin and cH3 Alexa Fluor 488 goat anti-rabbit IgG (A11008, Life Technologies, Budapest, Hungary) and Alexa Fluor 546 goat anti-mouse IgG (A11003, Life Technologies, Budapest, Hungary) antibodies were used. Fifteen images were taken from each thrombus using confocal laser scanning microscopy (Zeiss LSM 710, EC Plan-Neofluar 20x/0.50 M27 objective, Carl Zeiss, Jena, Germany) with the following excitation/emission wavelengths: fibrin: 543/589, cH3: 488/516 and DNA: 633/670. To quantify the area of different fluorescent signals Image J software (NIH, Bethesda, MD, USA) was used as previously described [1], median values of fibrin/DNA (FD50) and fibrin/citrullinated histone H3 ratio (FH50) distribution were determined.
Statistical analysis
Each patient was characterized by an array of routine clinical data, immunofluorescent data, fiber diameter and surface occupancy data from tj number of SEM images. The data were analyzed using regression analysis and/or hypothesis testing for identifying characteristics, dependences and influences between the different features of the patients. If the analyzed dependencies did not include the occupancy data, the sample sets are crisp, because each patient’s data forms one observation in the sample. However, if occupancy data were analyzed, the sections of a thrombus could not be treated as separate observations, because the intra-individual heterogeneity would have been neglected and the patients with larger sets of SEM data would be ascribed a higher weight in the conclusion derived. That is why, the sets of occupancy data were treated as fuzzy samples. The degree of membership to the general population of any observation of patient number j in such a fuzzy sample was assumed to be 1/tj. The so formed fuzzy sample accounted for inter-individual heterogeneity in thrombus occupancy, because each patient would influence the conclusions equally.
A Kuiper statistical test for equality of distribution [5] and a one-tail statistical test for median equality [1] were used to identify differences in the characteristics of two one-dimensional continuous populations. Each of the populations was represented by independent and identically distributed samples of observations which could be either crisp or fuzzy. In order to achieve highly confident estimates of the statistical significance of differences of data showing large dispersions within samples of a relatively small size, bootstrap procedures that do not use any parametric assumptions were implemented with 10,000 pseudo-realities [6] and equal size generation over empirical cumulative distribution function as previously described [7]. Thus, we achieve a higher discriminative power than the conventional statistics in high-dispersion samples (reducing the p-values for real differences and increasing the p- values for no differences independently of the pattern of data distribution).
The linear regression models with response variable described as quadratic function of one or two explanatory variables were built using previously described algorithms [1] with modifications. The singular value decomposition of the design matrix and the outlier detection algorithm using multiple testing procedures were the same. The major modification was that weighted least square
Supplemental Tables, Figures and Figure Legends
In this section we provide additional information for a more detailed and complete view of the results reported in the main text of the article. Clinical characteristics and basic laboratory findings of the patient cohort are summarized in the supplementary Table I. Figure I represents the relative citrullinated histone H3 content of peripheral, coronary artery disease and acute ischemic stroke as FH50.
Table II shows the associations between fibrin fiber median, the median values of fluorescent fibrin/DNA (FD50), fibrin/citrullinated histone H3 ratio (FH50) and clinical data; as well as constraints that strengthen the regressions. For the visual presentation of the correlations seen in Table II, each regression is plotted on Figures II-VII. The 3D regression model of Figure 5 in the main text and its coefficients are reported in Table III. As supplementary data we also present the joint impact of fibrinogen level and patients’ age on the ratio of fluorescent fibrin/extracellular DNA in Figure VIII. The model, and the coefficients of this regression are also reported in Table III.
CRP=C-reactive protein, Hgb=hemoglobin, ASA=acetylsalicylic acid, rtPA=recombinant tissue-type plasminogen activator.
CAD (66) PAD (64) AIS (78) All (208)
Patient characteristics
Male 68.2% (45/66) 56.3% (36/64) 61.5% (48/78) 62% (129/208)
Patients’ age 63±14.9 (66) 68.7±10.8 (64) 60±10.5 (78) 63.6±12.6 (208)
Laboratory findings
WBC (103/µL) 12.4±4.9 (66) 10.1±3.5 (62) 10.6±4.1 (78) 11±4.3 (206)
Plt (103 /µL) 233±78 (66) 222±87 (62) 213±60 (78) 222±75 (206)
CRP (mg/L) 12.9±25.6 (65) 29.2±49.5 (33) 12±22.7 (62) 15.9±31.6 (160)
Hgb (mmol/L) 8.3±1.3 (66) 7.8±1.8 (62) 8.3±1.3 (78) 8.1±1.5 (206)
Fibrinogen (g/L) 3.7±1.1 (49) 4.1±1.2 (36) 2.4±1.3 (29) 3.5±1.4 (114)
Leukocytosis (WBC>104 /µL) 63.6% (42/66) 40.3% (25/62) 48.7% (38/78) 51% (105/206) Elevated CRP (CRP>10 mg/L) 29.2% (19/65) 51.5% (17/33) 25.8% (16/62) 32.5% (52/160) Elevated fibrinogen (Fibrinogen>4 g/L) 36.7% (18/49) 52.8% (19/36) 6.9% (2/29) 34.2 (39/114) Etiology
Thrombophilia 0% (0/66) 0% (0/17) 5.2% (4/77) 2.5% (4/159)
Cardiac embolization 0% (0/66) 11.8% (2/17) 49.4% (38/77) 25.2% (40/159)
Atherosclerosis 100% (66/66) 70.6% (12/17) 26% (20/77) 61% (97/159)
Dissection 0% (0/66) 0% (0/17) 3.9% (3/77) 1.9% (3/159)
Cryptogenic 0% (0/66) 17.6% (3/17) 15.6% (12/77) 9.4% (15/159)
Data of thrombi
Vessel diameter (mm) 3.3±0.6 (66) 10.5±15.6 (63) 2.5±0.7 (78) 5.2±9.3 (207)
Symptom-to-intervention time (h) 3 [2-8.75] (58) 24 [12-48] (57) 5.3 [4.4-6.5] (77) 6 [4-12] (192) Medication prior to intervention
ASA 100% (62/62) 41.9% (26/62) 24.7% (18/73) 53.8% (106/197)
Clopidogrel 100% (62/62) 22.6% (14/62) 12.3% (9/73) 43.1% (85/197)
Oral anticoagulant - 6.7% (1/15) 19.5% (15/77) -
rtPA - - 51.3% (40/78) -
Heparin 100% (66/66) 100% (64/64) 100% (78/78) 100% (208/208)
Statin 13% (8/64) 42% (22/52) 25% (16/63) (46/179)
Comorbidities and risk factors
Atherosclerosis 100% (66/66) 79.4% (50/63) 50.6% (39/77) 75.2% (155/206)
Hyperlipidaemia 50% (33/66) 55.6% (35/63) 35.1% (27/77) 46.1% (95/206)
Uremia 18.2% (12/66) 9.5% (6/63) 0% (0/78) 8.7% (18/207)
Thrombophilia 3% (2/66) 1.6% (1/63) 2.6% (2/78) 2.4% (5/207)
Tumor 18.2% (12/66) 11.1% (7/63) 15.6% (12/77) 15% (31/206)
Smoking
Never 54% (34/63) 41.3% (26/63) 12.5% (2/16) 43.7% (62/142)
Former 7.9% (5/63) 0% (0/63) 6.3% (1/16) 4.2% (6/142)
Currently smoking 38.1% (24/63) 58.7% (37/63) 81.3% (13/16) 52.1% (74/142)
Figure I. Fibrin/citrullinated histone H3 (cH3) area ratio in arterial thrombi from different localizations. Based on the fluorescent signal (Fig. 1 in the main text) the ratio of cross-section area occupied by fibrin and cH3 was determined in 6-15 regions of each thrombus and the median values of these ratios for each thrombus (FH50) were evaluated. A lower value FH50 indicates a higher relative cH3 content in clots. The columns and bars represent median and IQR values. The number of patients in each group was
for each statistical test.
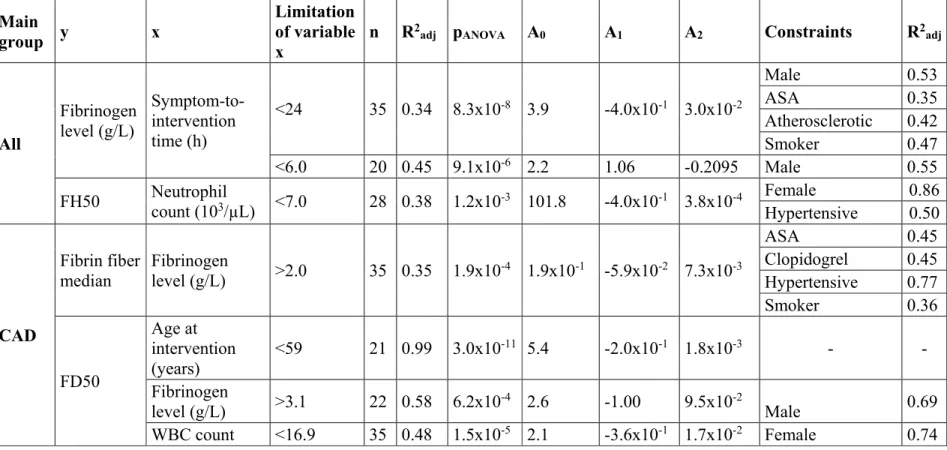
Table II. Relationship between fibrin fiber median, fibrin/extracellular DNA ratio (FD50), fibrin/citrullinated histone H3 ratio (FH50) and age of patients or inflammatory laboratory markers. CAD=coronary artery disease, PAD=peripheral artery disease, AIS=acute ischemic stroke; ASA= acetylsalicylic acid; x, y=independent variables for 2D regression model; n=sample size, R2adj=adjusted coefficient of determination, pANOVA=p-value of the analysis of variance (significant if p-value less than 0.05), A0, A1, A2: coefficients of the 2D regression model; equation for 2D regression model: y=A0+A1*x+A2*x2+e. Only clinical constraints that increase the strength of association (R2adj) of the y,x pairs are presented with the respective modified R2adj values.
Main
group y x
Limitation of variable x
n R2adj pANOVA A0 A1 A2 Constraints R2adj
All
Fibrinogen level (g/L)
Symptom-to- intervention time (h)
<24 35 0.34 8.3x10⁻⁸ 3.9 -4.0x10⁻¹ 3.0x10⁻²
Male 0.53
ASA 0.35
Atherosclerotic 0.42
Smoker 0.47
<6.0 20 0.45 9.1x10⁻⁶ 2.2 1.06 -0.2095 Male 0.55
FH50 Neutrophil
count (103/µL) <7.0 28 0.38 1.2x10⁻³ 101.8 -4.0x10⁻¹ 3.8x10⁻⁴ Female 0.86 Hypertensive 0.50
CAD
Fibrin fiber median
Fibrinogen
level (g/L) >2.0 35 0.35 1.9x10⁻⁴ 1.9x10⁻¹ -5.9x10⁻² 7.3x10⁻³
ASA 0.45
Clopidogrel 0.45 Hypertensive 0.77
Smoker 0.36
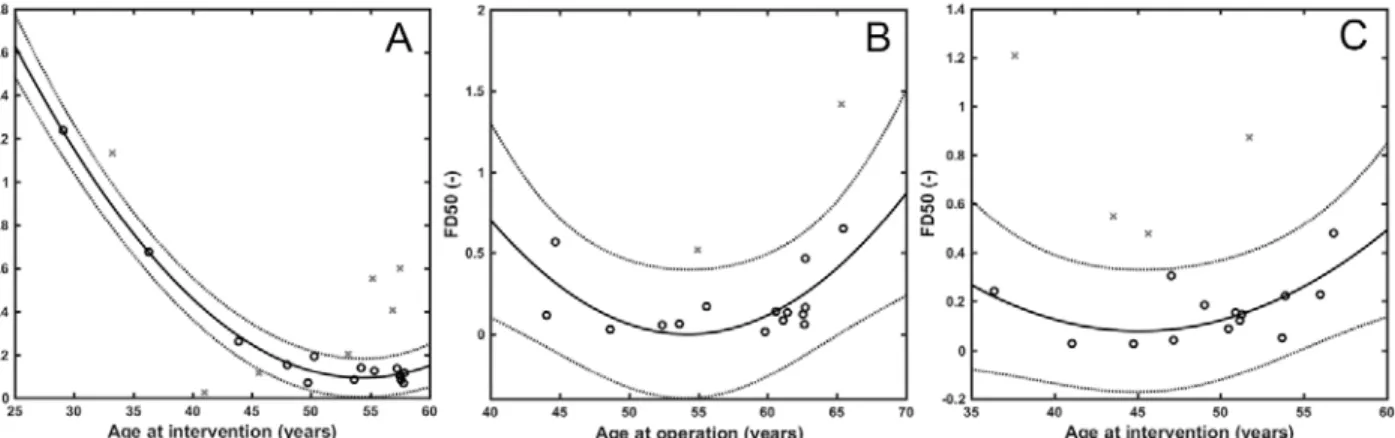
FD50
Age at intervention (years)
<59 21 0.99 3.0x10⁻¹¹ 5.4 -2.0x10⁻¹ 1.8x10⁻³ - - Fibrinogen
level (g/L) >3.1 22 0.58 6.2x10⁻⁴ 2.6 -1.00 9.5x10⁻² Male 0.69 WBC count <16.9 35 0.48 1.5x10⁻⁵ 2.1 -3.6x10⁻¹ 1.7x10⁻² Female 0.74
Elevated
fibrinogen 0.71 FH50
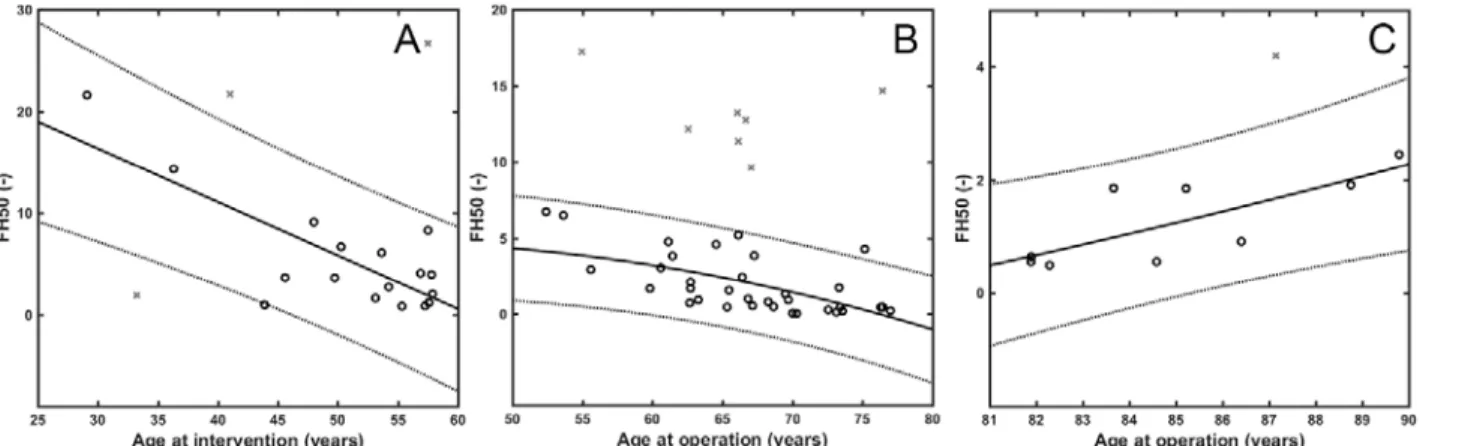
Age at intervention (years)
<59 21 0.71 6.1x10⁻⁵ 87.8 -3.1 2.8x10⁻²
Male 0.86
ASA 0.79
PAD
FD50
Age at operation (years)
<66 18 0.33 3.7x10⁻² 10.3 -3.8x10⁻¹ 3.5x10⁻³
Atherosclerotic 0.47 Hypertensive 0.39
Smoker 0.41
CRP (mg/L) <7.2 12 0.75 6.3x10⁻³ 3.2x10⁻¹ -1.5x10⁻¹ 1.71x10⁻² - -
FH50
Age at operation (years)
50-80 41 0.39 4.3x10⁻⁵ 15.0 -1.9x10⁻¹ -
Female 0.98
ASA 0.87
Clopidogrel 0.47
Diabetic 0.90
Hypertensive 0.47 Elevated CRP 0.90
>80 11 0.52 1.7x10⁻² - -1.7x10⁻¹ 2.1x10⁻³ Hypertensive 0.61
AIS
Fibrin fiber
median CRP (mg/L) <24 16 0.48 1.1x10⁻⁶ 7.2x10⁻² -3.7x10⁻³ 3.4x10⁻⁴ Male 0.56 Leukocytosis 0.82 FD50
Age at intervention (years)
<57 18 0.30 5.7x10⁻² 3.9 -1.7x10⁻¹ 1.9x10⁻³ Male 0.81
FH50
Age at intervention (years)
- 64 0.02 - - - 3.8x10⁻³ Tumor 0.90
Neutrophil
count (103/µL) <7.0 23 0.63 3.4x10⁻⁵ 145.2 -5.6x10⁻¹ 5.3x10⁻⁴ Hypertensive 0.81
acute ischemic stroke. Fibrin fiber median determined by morphometric analysis of scanning electron micrographs shown as a function of blood fibrinogen level for coronary artery disease (A) and C-reactive protein (CRP) in acute ischemic stroke (B) thrombi.
Regression curve (solid line) according to the model equation in Table II with 95% confidence intervals (dashed lines) is shown for data points (o) after outlier (x) rejection.
artery disease (A), peripheral artery disease (B) and acute ischemic stroke (C). Regression curve (solid line) according to the model equation in Table II with 95% confidence intervals (dashed lines) is shown for data points (o) after outlier (x) rejection (2 outliers are not shown because they are out of the chosen ordinate scale).
Figure IV. Associations between the median of fibrin/extracellular DNA ratio (FD50) and blood fibrinogen level (A), white blood cell (WBC) count (B) in coronary artery disease, and C-reactive protein (CRP) in peripheral artery disease (C).
Regression curve (solid line) with 95% confidence intervals (dashed lines) is shown for data points (o) after outlier (x) rejection (2 outliers are not shown because they are out of the chosen ordinate scale).
Figure V. Associations between the median of fibrin/citrullinated histone H3 ratio (FH50) and the age of patients in coronary artery disease (A), and peripheral artery disease (B, C). Regression curve (solid line) with 95% confidence intervals (dashed lines) is shown for data points (o) after outlier (x) rejection (2 outliers are not shown because they are out of the chosen ordinate scale).
data points (o) after outlier (x) rejection (2 outliers are not shown because they are out of the chosen ordinate scale).
Figure VII. Associations between symptom to intervention time and plasma fibrinogen concentration including all groups.
Symptom to intervention time less, than 6 hours (A), or 24 hours (B). Regression curve (solid line) with 95% confidence intervals (dashed lines) is shown for data points (o) after outlier (x) rejection.
Table III. Relationship between fibrin/extracellular DNA ratio (FD50), fibrin/citrullinated histone H3 ratio (FH50) and inflammatory laboratory markers, age of patients. WBC=White blood cell count; y, x1,x2=independent variables for 3D regression model; n=sample size, R2adj=adjusted coefficient of determination, pANOVA=p-value of the analysis of variance (significant if p-value less than 0.05), A0, A10, A01, A20, A11, A02=coefficients of the 3D regression model; equation for 3D regression model:
y=A0+A10*x1+A01*x2+A20*x12+A11*x1*x2+A02*x22+e.