Is the ef fi ciency of the healthcare system linked to the country ’ s economic performance?
Beveridgeans versus Bismarckians
GRA ZYNA KOZU _ N-CIE SLAK
Faculty of Economics and Finance, Casimir Pulaski University of Technology and Humanities, ul.
Chrobrego 31, 26-600, Radom, Poland
Received: December 29, 2017 • Revised manuscript received: March 12, 2019 • Accepted: June 25, 2019
© 2020 Akademiai Kiado, Budapest
ABSTRACT
This paper examines the Bismarckian and Beveridgean-style healthcare systems in 25 OECD countries to identify the relationship between the efficiency of the country’s healthcare delivery arrangement and its economic wealth.
The Data Envelopment Analysis (DEA) is applied as a quantitative tool. I examine three models using infant mortality and potential years of life lost as output indicators. These models differ only in the way of expressing healthcare inputs. The DEA computations show that neither the Bismarckian nor the Beveridgean healthcare system has a clear advantage over the other when inputs are expressed by health expenditure as a percentage of GDP. The model which uses USD per head expenditure data at purchasing power parity shows a slight advantage of the Beveridge-style systems. This confirms the common opinion that the Bismarck-style systems perform worse in controlling the costs. When inputs are expressed using physical units (medical staff and equipment), DEA shows that the Beveridge system is significantly more efficient than the Bismarckian ones. I analyse the relationship between the DEA scores and the country’s GDP per capita, as well. This analysis shows that more developed economies are technically less efficient. Thesefindings are consistent with the belief that technical efficiency is only one of the many criteria that determine the quality of the healthcare system and patient satisfaction.
KEYWORDS
healthcare systems, efficiency, DEA, economic welfare
JEL CLASSIFICATION INDICES H21, H51, I11, I18
E-mail: g.kozun@uthrad.pl
1. INTRODUCTION
The Social Insurance Healthcare System (SIH) and the National Health Service System (NHS), also termed as the Bismarck and Beveridge healthcare models respectively, are the dominant arrangements in the developed world. But no national healthcare system is purely Bismarckian or Beveridgean and different national arrangements tend to converge. Despite the tendency to converge, it is common to divide the countries into two groups, representing the dominant insurance-based or tax-based healthcare system.
The aim of this study is to examine the relationship between the efficiency of the healthcare systems (both the Bismarckian and Beveridgean) and the level of the countries’ economic performance, expressed in terms of GDP per capita.
The rest of the paper is organised as follows. Section 1 presents a review of the literature that deals with the comparative assessment of the healthcare systems. Section 2 describes the methodological framework. Section 3 introduces the empirical framework, while Section 4 presents the results of the Data Envelopment Analysis (DEA) efficiency computations. Section 5 examines the correlation between the DEA efficiency scores and the country’s GDP per capita. The article ends with a theoretical interpretation of the results.
2. LITERATURE REVIEW
The beginning of the 21st century brought a global recession which in turn depleted the public resources available for healthcare. This, in turn, intensified the debate on the failure of the existing healthcare systems and the need for reforms. Examples of the studies on healthcare reforms can be found in the works ofFreeman (1998);Saltman–Figueras (1998);
Lameire et al. (1999); Busse et al. (2004); Nemec – Kolisnichenko (2006); Kutzin et al.
(2010).
The focus of the healthcare policy makers and practitioners has been on efficiency–the relationship between healthcare efforts and their effects, which describe the performance of the health delivery systems with respect to population health needs, responsiveness and availability. In the background of all these discussions, questions arise about the best model of healthcare arrangement, the advantages and limitations of the existing systems, as well as the key non-medical determinants of the health status of the population. Pelone et al.
(2008)inferred that a healthcare system can be considered to be of‘high level quality’if it successfully achieves the expected results across six main dimensions: effectiveness, technical efficiency, accessibility, equity of access, timeliness and safety. These authors, however, correctly pointed out the difficulties arising due to the lack of up-to-date and comparable data, and the fact that many healthcare indicators are quality related and not very objective.
The literature has not come to a conclusion with regard to which model shows a better performance (e.g.Kuvikova 2004;Zee–Kroneman 2007;Wagstaff 2009;Wendt 2009;Or et al.
2010;Delnoij 2013).Joumard et al. (2010)estimated the healthcare efficiency and contribution of healthcare expenditure in 29 OECD countries to life expectancy, taking into account the lifestyle and socio-economic factors. The empirical analysis showed that all countries had ample
room for raising the efficiency of healthcare spending and not a single system showed a sys- tematically better performance.
Asandului et al. (2014) evaluated the efficiency of the public healthcare systems in 30 European countries in 2010. The research established that there are several countries, both developed and developing, which are efficient, while a great majority of the countries in the sample are also inefficient.Medeiros–Schwierz (2015)used models with different combi- nations of inputs (per capita expenditure on healthcare, physical inputs and environmental variables) and output variables (life expectancy, healthy life expectancy and amenable mortality rates). Their results suggested that on average the EU life expectancy at birth could be increased by 2.3% (1.8 years) and average amenable mortality rates could be nearly halved.
Dutu –Sicari (2016) calculated the DEA efficiency scores for the OECD states. They used life expectancy at birth as a proxy of the health system’s outcomes. Since life ex- pectancy is likely to be driven also by factors that do not necessarily have a direct causal link to the healthcare system, the variable representing the monetary value of inputs (total per capita expenditure on healthcare) was complemented by a second input variable capturing the effects of the socio-economic environment and lifestyle factors. The results from the estimation showed significant potential efficiency gains on both the output and input side.
Dlouhy (2016)examined the efficiency of NHSs in 34 countries of the WHO in the European Region. As input measures, he used the number of hospital beds, physicians and nurses. The number of inpatient care discharges and number of outpatient contacts represented the outputs.
The author applied the DEA model with and without the parameters of unobserved measures.
The computations showed that the DEA models, which took into account the unobserved measures, led to improved DEA efficiency scores, but they did not affect the ranking of the analysed healthcare systems.
This research joins the discussion on the efficiency of the Bismarckian and Beveridgean approaches and identifies the relationship between the efficiency level of the healthcare system and country’s economic welfare.
3. METHODOLOGY
I applied the DEA method as a tool to evaluate the efficiency of healthcare systems in 25 OECD countries between 2005 and 2015.1The states were selected due to their similar socio- economic development. This method was successfully used to evaluate the efficiency at the micro, mezzo and macroeconomic levels, of both the public and private sector entities. The DEA was introduced by Charnes et al. (1978), who, based on the work of Farrell (1957), proposed a basic DEA model–the radial CCR model (named after the names of its authors) with the assumption of a constant return to scale (CRS). The CCR model was extended to account for technologies that expressed variable returns to scale (VRS) byBanker et al. in
1Editor’s note: The same method is applied in the paper ofDinca et al.“The efficiency of the health care systems in EU countries–A DEA analysis”in the present issue of Acta Oeconomica.
1984. The DEA evaluates the technical efficiency and aims at estimating the relationship between the inputs and outputs of homogeneous objects. The main advantage of the DEA technique is that it does not require the specification of a particular functional form of technology. It is a powerful method for evaluating the relative efficiency when there are multiple inputs and outputs. The DEA identifies a ‘frontier’, based on which relative per- formance among all the decision-making units (DMUs) in the sample can be compared–the DEA benchmarks the analysed DMU only against the best ones that form the frontier of efficiency (productivity frontier). An object is recognised as 100% efficient (DEA efficiency measured51) when comparisons with other DMUs in a sample do not reveal evidence of inefficiency in the use of any input or output. If the DMU is not at the frontier, it implies that it is inefficient–its distance from the frontier determines the inefficiency level and the DEA measure d < 1 (for the mathematical foundations of the DEA computations refer Cooper et al. 2007).
Over the years, simple DEA models have been enhanced by several modifications that enable users to have a better fit of the appropriate DEA variant to suit their research needs. I made the following modifications:
To avoid the so-called Farrell’s weak efficiency (apparent efficiency) the non-radial approach has been applied to measure distances from the efficiency frontier. These DEA models are termed as slack-based measures (SBM)2.
To avoid redundancy of the efficient leaders, the DEA super-efficiency (SE) model developed byBanker et al. (1989)andAndersen–Petersen (1993)has been used. The SE DEA model is identical to the standard model, except that the DMU under evaluation is excluded from the reference set. It ranks the efficient DMUs and the efficiency indicators may be greater than one (suggesting“over-efficiency”).
Under the assumption of the VRS (as done in this study), the SE DEA model may be infeasible for some efficient DMUs. This issue can be resolved by using the generalised orientation of the SE DEA model. The DEA model with generalised orientation extends the orientation of the model from the traditional input-orientation and output- orientation to the modified input-orientation, input-prioritised non-orientation, modi- fied output-orientation and output-prioritised non-orientation. All of the extended orientations are always feasible in the associated super-efficiency models (Cheng et al.
2011).
To sum up, the super-efficiency and non-oriented slack-based DEA model under the assumption of the VRS, DEA SE-NO-SBM-V will be applied. The mathematical expression is as follows (Tone 2002):
dDEA−SE−NO−SBM¼min f;j;λ
1þm1 Pm
i¼14io
11s Ps
r¼1jro
(1)
2For details, seeTone (2001).
Subject to:
Xn
j¼1j≠o
xijλjoxio4io≤xioði¼1; . . . mÞ;
Xn
j¼1 j≠o
yrjλjoyrojro≥yroðr¼1; . . . sÞ;
4io; jro; λjo≥0;
where:
dDEA−SE−NO−SBM- efficiency score of the DMUo(o51,. . .,n), xij- amount of thei-thinput of the DMUj(i51,. . .,m), yrj- amount of ther-thoutput of the DMUj(r 51,. . ., s),
λjo- the intensity factor associated with the DMUj and designated for the analysed DMUo (j51,. . ., n).
Weighted by lambda coefficients, the sum of the inputs (outputs) of the DMUs, which are the reference objects for the DMUo, shows the recommended value of the inputs (outputs) of the DMUo, at which it becomes efficient.
4io- indicates the required percentage reduction of thei-thinput, jro- indicates the required percentage increase of ther-thoutput.
The formula of the DEA SE-NO-SBM-V model facilitates ranking of the relative efficiencies of multiple systems (here, 25 countries) by consuming multiple inputs (health expenditure, medical staff and equipment) in order to produce multiple outputs (health status indicators expressed by infant mortality and potential years of life lost).
4. EMPIRICAL FRAMEWORK
The study covers 25 OECD member states between 2005 and 20153. The sample has been stated due to the homogeneity requirement that is reflected by a relatively similar level of the countries’
economic development expressed by GDP per capita at purchasing power parity (PPP). The coefficient of variation for this variable is low (0.22) which confirms the relative homogeneity of the sample. I examined three models (Table 1).
First, the DEA is applied to evaluate the success in transforming health inputs (expressed by HE/GDP in Model A, HEpc in Model B and MD, PN ME in model C) into health status
3The research sample covers: 12 Bismarck-style healthcare systems (Poland, Hungary, Lithuania, Estonia, Slovakia, the Czech Republic, Slovenia, France, Germany, Austria, the Netherlands and Japan) and 13 Beveridge-style ones (the United Kingdom, Finland, Denmark, South Korea, Israel, New Zealand, Australia, Canada, Iceland, Portugal, Greece, Spain, Italy). For various reasons 10 OECD member countries were left out from the sample.
improvement (reflected in IM and PYLL). As the output indicators are de-stimulants (a higher value of a variable means a less desirable situation in the considered phenomenon), their conversion into positive measures is necessary (respectively IM*51000-IM and PYLL*51000-PYLL). The assessment of the efficiency of healthcare systems at the country level involves some difficulty with the selection of the appropriate input–output periods. This is because the results achieved by the healthcare system in every single year do not arise directly from the inputs incurred in that year.
Therefore, the indicators used in this study represent the arithmetic averages of the data over a period of 2005–2015. As a second step, the DEA scores achieved in this step are correlated with the countries’ development indicators. The Pearson correlation coefficient allows us to assess the strength and the direction of the relationship between the two variables.
5. DEA COMPUTATION RESULTS
5.1. Model A
The DEA calculations for Model A (input indicator expressed by the total health expenditure as a percentage of GDP) identified five countries as the efficiency leaders: these include two states with the Bismarckian healthcare system (Estonia and the Czech Republic) and three with the Beveridgean systems (Israel, Korea and Iceland). The remaining list of the countries ranges from 4% for Poland up to 40% for France. Despite this, the diversity of the DEA efficiency scores for the sample is low (the coefficient of variation is 0.17).Figure 1shows the ranking of the analysed DMUsTable 2.
Table 1. DEA input–output indicators
Inputs (average 2005–2015) Abbreviation Outputs (average 2005–2015) Abbreviation Model A
Health expenditure as % GDP HE/GDP Infant mortality per 1,000 live births IM Potential years of life lost per 1,000
inhabitants
PYLL
Model B
Health expenditure per capita HEpc Infant mortality per 1,000 live births IM Potential years of life lost per 1,000
inhabitants
PYLL
Model C
Medical doctors per 1,000 inhabitants MD Infant mortality per 1,000 live births IM Practicing nurses per 1,000
inhabitants
PN Potential years of life lost per 1,000 inhabitants
PYLL
Medical equipment per one million inhabitants
ME
Source:Own compilation.
The mean value of the DEA efficiency scores is d 5 0.82 for the Bismarckian states and d50.70 for the Beveridgean ones. This implies that the‘average’Bismarckian healthcare system is incurring about 18% more cost than it would if it were efficient, while the‘average’ Bever- idgean system is producing about 30% more cost than it would at the frontier.
The maximum value of the DEA efficiency score is more advantageous for the Bismarckian system (d 5 1.069) than for the Beveridgean one (d 5 1.008). Likewise, the minimum DEA Figure 1.DEA-SE-NO-V efficiency scores (Model A)
Source:Own work based onTable A3(Bismarckians –in black, Beveridgeans–in grey).
Table 2.DEA-SE-NO-V efficiency scores–Model A
Model A
Bismarck-style healthcare systems Beveridge-style healthcare systems
Country DEA scoredA Rank Country DEA scoredA Rank
Austria 0.659 21 Australia 0.814 14
Czech Republic 1.000 5 Canada 0.649 22
Estonia 1.069 1 Denmark 0.636 23
France 0.595 25 Finland 0.876 9
Germany 0.612 24 Greece 0.727 17
Hungary 0.785 15 Iceland 1.002 3
Japan 0.848 11 Israel 1.001 4
Lithuania 0.910 7 Italy 0.871 10
Netherland 0.690 19 Korea 1.008 2
Poland 0.959 6 New Zealand 0.685 20
Slovakia 0.825 13 Portugal 0.701 18
Slovenia 0.886 8 Spain 0.838 12
United Kingdom 0.744 16
Source:Own calculations performed with theDEA solver. LV 8.0.
efficiency scores are worse for the Bismarckian healthcare system (d 5 0.595) than for the Beveridgean ones (d5 0.636).
5.2. Model B
The DEA calculations for Model B (input indicator expressed by the total health expenditure per capita) identified seven relatively efficient healthcare systems. These include the same leaders as listed in Model A plus Poland and Slovenia. The DEA efficiency scores in this model show a slightly higher variation (0.28). The countries that have been assessed as relatively inefficient show an efficiency gap from 8% in Lithuania up to 55% in Denmark. The Bismarckian-style Polish healthcare system achieved DEA over-efficiency (dB51.067) and placed at the top of the ranking (Figure 2;Table 3).
The mean value of the DEA efficiency scores in Model B is almost the same for both the Bismarckian and the Beveridgean states and amounts tod 50.78 and d5 0.79, respectively.
Thus, the ‘average’ healthcare system, no matter what model is used, is incurring about 20%
more expenditure than it would if it were efficient. The maximum DEA efficiency score is slightly higher for the Bismarckian Poland (d 5 1.067) than for the Beveridgean Israel (d 5 1.002), while the minimum DEA scores for both healthcare systems amount to approximatelyd50.45 (Beveridgean Denmark and Bismarckian Germany).
5.3. Model C
The DEA calculations for Model C (inputs expressed by indicators of medical staff and medical equipment) identified the highest number of relatively efficient healthcare systems: eight Bev- eridgean-style economies (Greece, Israel, Korea, UK, Canada, Iceland, Italy and Spain) and five Bismarckian healthcare systems (Poland, Hungary4, Japan, Slovenia and the Netherlands). The other states reveal a relative inefficiency, which ranges from 14% for Portugal up to 50% for Figure 2. DEA-SE-NO-V efficiency scores (Model B)
Source:Own work based on Table A3(Bismarckians–in black, Beveridgeans –in grey).
4Since 2010 the Hungarian healthcare system has been undergoing fundamental changes. The pre-1990 system of tax- financing and centralised decision-making has been restored. After the liberal-minded, market oriented reforms in the early 1990s, and in the period of 2006–2008, Prime Minister Viktor Orban reversed these developments and reintro- duced the healthcare system similar to the Semashko model of centrally planned economies (Mihalyi 2017).
Germany. Despite this, the diversity of the DEA efficiency scores for the sample is rather low (the coefficient of variation is 0.23).Figure 3shows the ranking of the analysed DMUsTable 4.
The mean value of the DEA efficiency scores amounts tod50.83 for the Bismarckian states andd50.86 for the Beveridgean ones. This implies that the‘average’healthcare system, both Bismarckian and Beveridgean, is producing respectively 17% and 14% more expensive than they would be if they were efficient. The maximum values of the DEA efficiency scores are very similar for four states (Greece, Poland, Israel and Korea) and amount to 1.124–1.094. Likewise, Table 3.DEA-SE-NO-V efficiency scores–Model B
Model B
Bismarck-style healthcare systems Beveridge-style healthcare systems
Country DEA scoredB Rank Country DEA scoredB Rank
Austria 0.463 22 Australia 0.574 19
Czech Republic 1.000 6 Canada 0.478 21
Estonia 1.001 5 Denmark 0.450 25
France 0.484 20 Finland 0.774 15
Germany 0.453 24 Greece 0.794 13
Hungary 0.802 12 Iceland 1.002 3
Japan 0.891 9 Israel 1.002 2
Lithuania 0.922 8 Italy 0.855 11
Netherland 0.458 23 Korea 1.001 4
Poland 1.067 1 New Zealand 0.632 17
Slovakia 0.761 16 Portugal 0.792 14
Slovenia 1.000 7 Spain 0.859 10
United Kingdom 0.607 18
Source:Own calculations performed with theDEA solver. LV 8.0.
Figure 3.DEA-SE-NO-V efficiency scores (Model C)
Source:Own work based onTable A3(Bismarckians –in black, Beveridgeans–in grey).
the minimum DEA efficiency scores are almost the same for Germany and Denmark (d50.500 and d50.507, respectively).
5.4. Summary of the DEA computations
Although this study provides clear rankings of the examined healthcare systems (Figures 1–3), it is crucial to emphasise strongly that the DEA efficiency scores reveal the success in which a given set of efforts (inputs) are transformed into a given set of results (outputs) by a given sample of DMUs. Therefore, the selection of the appropriate input–output indicators as well as the selection of compared units becomes very significant for the authentic results. Hence, all the conclusions should be interpreted within a specific research framework. Models A and B, which differed only in the manner of expressing healthcare spending (% of GDPvs.USD per capita) delivered very similar results and the DEA scores for these two models showed a very strong correlation (Pearson correlation coefficient equals to 91%). In turn, there is no significant relationship between the DEA scores for Model A and Model C, in which input indicators reflected healthcare sources in physical units (PCC539%). Furthermore, the efficiency scores for Model C showed a moderate correlation with those obtained for Model B (PCC 554%).
These imply that if the sample of the examined countries is homogeneous in terms of economic development, it is more informative to use monetary indicators expressed in USD per capita (PPP) than as a percentage of GDP.
Table 4. DEA-SE-NO-V efficiency scores–Model C
Model C
Bismarck-style healthcare systems Beveridge-style healthcare systems
Country DEA scoredC Rank Country DEA scoredC Rank
Austria 0.539 23 Australia 0.580 22
Czech Republic 0.847 15 Canada 1.004 7
Estonia 0.766 19 Denmark 0.507 24
France 0.712 20 Finland 0.796 17
Germany 0.500 25 Greece 1.142 1
Hungary 1.061 5 Iceland 1.002 9
Japan 1.003 8 Israel 1.101 3
Lithuania 0.631 21 Italy 1.001 11
Netherland 1.000 12 Korea 1.094 4
Poland 1.128 2 New Zealand 0.834 16
Slovakia 0.777 18 Portugal 0.862 14
Slovenia 1.001 10 Spain 1.000 13
United Kingdom 1.008 6
Source:Own calculations performed with theDEA solver. LV 8.0.
The following table sums up the DEA calculation results according to four criteriaTable 5.
In the Model A, the higher number of Beveridge healthcare systems have been assessed as DEA efficient (23%). It is only 17% for Bismarckians. However, the efficiency gap for the “average”
Beveridge healthcare system is bigger than for the Bismarckians (30%vs. 18%). For Model A the number of states with the DEA scores in the highest quartile is bigger for states with Bismarckian healthcare systems (4 states), but at the same time the number of countries with the DEA scores in the lowest quartile is smaller for the countries operating the Beveridge-style systems (three coun- tries). Hence, taking into account Model A, no healthcare system is clearly better than the other.
Model B shows the slight advantage of the Beveridge-style healthcare systems over the Bismarckian ones–for Beveridgeans the DEA score in the highest quartile is bigger (4) and the number of countries with the DEA score in the lowest quartile is smaller (3). The“average”
efficiency gap is very similar for both healthcare systems, but the percentage of countries assessed as DEA efficient is higher for Bismarckian (33%) than for Beveridgeans (23%).
In Model C, the DEA analysis recognises the countries with the Beveridge-style healthcare as being clearly more efficient than the Bismarckian ones–for the Beveridgeans, the DEA scores in the highest quartile equal 5 and the number of countries with scores in the lowest quartile is only 2. Moreover, the efficiency gap for the“average”Beveridge healthcare system is smaller than for the Bismarckians (14%vs.17%). Additionally, as much as 62% of the countries with the Bev- eridge healthcare system have been assessed as DEA efficient while for the countries with the Bismarck-style healthcare it is only 41%.
6. IS THERE A LINK BETWEEN THE COUNTRIES ’ WELL-BEING AND THE EFFICIENCY OF HEALTHCARE SYSTEM?
The aim of this section is examining the relationship between the DEA efficiency of healthcare systems and the level of economic welfare reflected in the income of the“average”inhabitant, Table 5.Comparison of DEA computation results
Bismarck healthcare systems
Beveridge healthcare systems
Model Model
A B C A B C
Percentage of states assessed as DEA efficient, %
17 33 41 23 23 62
Efficiency gap for the“average”healthcare system, %
18 22 17 30 21 14
Number of states with the DEA score in the highest quartile
4 3 2 3 4 5
Number of states with the DEA score in the lowest quartile
4 4 5 3 3 2
Source: Own compilation based onTables 2–4.
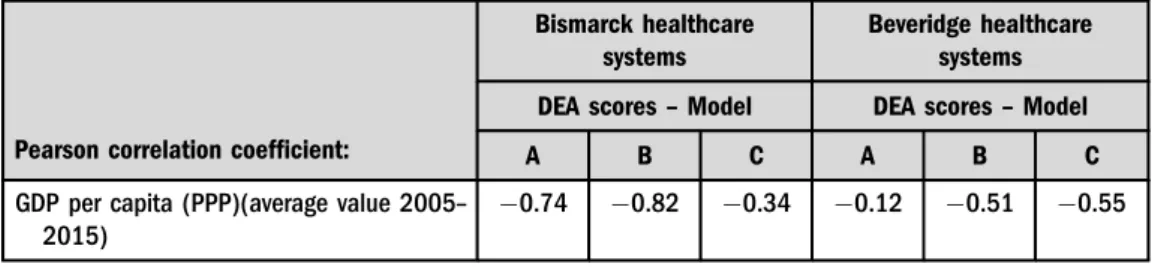
expressed by GDP per capita (PPP). Table 6 presents the Pearson correlation coefficients separately for the two groups of countries.
It is a striking fact that all correlation coefficients are negative, which generally means that the wealthier the country, the less technically efficient is its healthcare system. This negative relationship is significantly strong in the Bismarck-style healthcare systems (0.74 and0.88) for Models A and B (DEA inputs expressed by HE/GDP and HEpc, respectively). This proves the common opinion that the Bismarckian systems perform worse in controlling the costs (Elola 1996;Figueras et al.2004;Zee–Kroneman 2007). Given Model C (DEA inputs expressed by a number of medical staff and medical equipment), there is a weak relationship between the country’s GDP per capita and technical efficiency of the Bismarckian healthcare system (0.34).
In the Beveridge-style healthcare systems, there is a medium negative correlation between the country’s GDP per capita and DEA scores obtained from Models B and C (0.51 and0.55) and there is no correlation for Model A (0.12).
7. THEORETICAL INTERPRETATION OF THE RESULTS
The DEA method delivered very similar results for Models A and B, which differed only in the way of expressing healthcare spending (% of GDPvs.USD per capita). The Pearson correlation coefficient between the DEA scores obtained in Model A and B amounts to 91%. In Model A, five healthcare systems have been indicated as relatively efficient ones. Two of them represent the Bismarck-style health protection (Estonia and Czech Republic) and the other three belong to the Beveridgean systems (Korea, Iceland and Israel). Model B additionally pointed out Bis- marckian Poland and Slovenia as the efficient systems. The countries, such as France, Germany, Denmark, Austria and Canada have been placed at the lower quartile of these two rankings. The analysis for Model C identified a significantly higher number of relatively efficient healthcare systems: eight Beveridgean-style economies (Greece, Israel, Korea, UK, Canada, Iceland, Italy and Spain) and five Bismarckians (Poland, Hungary, Japan, Slovenia and the Netherlands).
Model C also showed Germany, Denmark and Austria as the most DEA inefficient healthcare systems. However, there is no significant relationship between the DEA scores for Models C and A (39%). Whereas the Pearson correlation coefficient for Models C and B shows a moderate relationship (54%).
Table 6. Pearson correlation between DEA efficiency scores and GDP per capita (PPP) in the Bismarckian and Beveridgean healthcare systems
Pearson correlation coefficient:
Bismarck healthcare systems
Beveridge healthcare systems DEA scores–Model DEA scores–Model
A B C A B C
GDP per capita (PPP)(average value 2005– 2015)
0.74 0.82 0.34 0.12 0.51 0.55
Source: Own compilation based onTables 2–4.
Taking into account such criteria as: the percentage of countries assessed as DEA efficient, the efficiency gap for the“average”healthcare system, the number of countries with the DEA scores in the highest and in the lowest quartile, I can conclude that in Model A neither the Bismarckian nor the Beveridgean system is clearly better than the other. Model B showed the slight advantage of the Beveridge-style healthcare systems over the Bismarckian ones which confirms the common opinion that the Bismarck-style systems perform worse in controlling the costs. Only in the case of Model C, the DEA recognises the countries with the Beveridge-style healthcare as being significantly more efficient than the Bismarckian ones.
The relationship between the DEA efficiency scores and the level of economic welfare is reflected in the wealth of the“average”inhabitant, expressed by GDP per capita (PPP). This part of the study detected all correlation coefficients as negative values which generally means that the wealthier the economy, the less technically efficient is its healthcare system.
Are these results surprising or shocking? Generally, the answer is “no”. Health has value above all prices. Therefore, it is not surprising that a rich society is ready to sacrifice the technical efficiency as it is just one of many criteria that determine the quality of the health system. This is confirmed by the results of different surveys on patient satisfaction. For example, the annually published Euro-Health Consumer Index (Bj€ornberg 2016) ranks many countries, which in this study have been assessed as more or less inefficient, on the top of the list, both the Bismarckian and Beveridgean (e.g. Germany, France, Denmark, United Kingdom, Austria and Finland).
The literature delivers a strong evidence for a positive correlation between healthcare expenditure and GDP. As the healthcare is labour intensive, wages form a very large part of all health spending. Hence, wage level is a major determinant of the efficiency scores especially estimated based on input indicators expressed by financial measures. Therefore, the high level of wages in the healthcare sector will be the main source of technical inefficiency, especially in those highly developed economies that show a strong effect of so-calledBaumol’s cost disease.
Baumol’s cost disease affects the sectors that are characterised by slow productivity growth and high labour intensity (stagnant sectors). If, in addition, the demand for these services is rather price inelastic or the government subsidises these services, costs of these sectors increase in an over-proportional manner to the costs of sectors with continuous productivity growth (progressive sectors).
Healthcare is among the services that have been labelled as stagnant. There are two main reasons that affect the persistent productivity growth in the healthcare. First, it is the non- standardization of the production process, and second, in this service the quality is correlated with the amount of labour expended on their production (Russo 2016). Thus, according to Baumol (1993)the secular rise in the healthcare expenditure has been unavoidable. Empirical studies provide evidence in favour of Baumol’s theory (e.g. Colombier 2017; Bates–Santerre 2013; Hartwig 2008). All countries which are leaders in productivity rates (GDP per hour worked higher than 55 USD) can show the lowest DEA efficiency scores in healthcare (such as Denmark, Germany, Austria and France).
It is worth paying attention to one more reason for the high costs in healthcare, which finally result in poor technical efficiency scores (although it does not necessarily mean a poor assessment of the healthcare system from the patients’point of view). The essence of the matter comes down to the question "is inefficiency bad for everyone?" According to Uwe Reinhardt, a health economist and afierce critic of the US healthcare system, every dollar of health spending
is someone else’s health-care income, including fraud, waste and abuse (Reinhardt 2009). The author posits that healthcare systems do not tend to secure cost-efficiency because there are the defenders of thestatus quowho skilfully mingle several distinct issues that ought to be treated separately.
1. Appropriateness.A growing body of scholarly literature suggests that a surprising fraction of the healthcare given to patients does not appear to be the clinically most appropriate response to the patient’s medical condition.
2. Cost-effectiveness. Even if it is clinically effective and appropriate, a good part of the healthcare delivered does not appear to be the lowest-cost therapeutic approach to reach a given therapeutic target.
3. The price of changes in health status.As the cost of healthcare keeps rising, sooner or later we must confront the question of whether there should be an upper limit to the price that should be paid for a given improvement in health status.
Reinhardt (2009)stated that there is no reason to consider these three issues together as only the third one is controversial because of its deeply philosophical and ethical character. It should be added here that healthcare is not exempted from the law of diminishing returns. Regarding the first two issues, the author stated that there is nothing controversial in them beyond the answer to the question“who profits from maintaining the inefficiency?”But, is everything really so obvious? If we agree with Reinhardt that every dollar spent on healthcare is someone’s in- come, obviously there is no pressure on the cost reduction among healthcare providers and from the cost-efficiency point of view all cost-reducing reforms in the healthcare systems seem to be hopeless. However, this conclusion does not exhaust the analysis.
The issue is much more complex, especially in the context of theGrossman model of healthcare demand(Grossman 1972) with further extensions (Grossman 1982,2004). In Grossman’s human capital framework, individuals invest in health (e.g. invest time and consume medical goods and services) for the consumption benefits (health provides utility) as well as production benefits (healthy individuals have higher earnings) that good health provides. The model provides a conceptual framework for the interpretation of the demand for health and medical care in relation to an individual’s resource constraints, preferences, and consumption needs over the life cycle. In this model, health is a durable capital good which is inherited and depreciates over time.
Investment in health takes the form of medical care purchases and other inputs and depreciation is interpreted as natural deterioration of health over time. In practical terms, this model predicts that an increase in wage will increase the demand for health capital (Galama et al. 2012).
This allows predicting that high income received by the broadly defined healthcare providers will return largely to the healthcare system in the form of pro-health spending.
In economic literature, the technical approach to define efficiency prevails and in line with this approach, efficiency is characterised in terms of the input–output ratio. However, it is not the only possible approach. Perceiving efficiency in the context of goal accomplishment moves the discussion towards substantive (Aristotelian) efficiency, meaning a concept of efficiency that is directly or indirectly associated with setting goals or values (Rutgers–Meer 2010).
A powerful example of the substantive approach to understand efficiency is the explanation byWaldo (1948: 202):“Efficiency operates in the interstices of a value system (. . .). Things are not simply‘efficient’or‘inefficient’. They are efficient or inefficient for given purposes, and efficient for one purpose may mean inefficient for another”.
In this context, let us clearly understand why such healthcare systems, such as the German, the French, the Austrian or the Finish are highly rated by patients, despite the fact that their technical efficiency scores being low. These systems fulfil peoples’needs to achieve satisfaction in health protection as a meta-goal, and technical efficiency is understood only as an instrumental and secondary criterion, for assessing the system’s performance (Goodin–Wilenski 1984;Stone 2012).
At the same time, many healthcare systems from Central and Eastern Europe are considerably unsatisfactory from the patients’point of view despite having been evaluated as DEA efficient.
Even if we accept that technical efficiency is not an inherent value, but a means to achieve a goal (a desirable value), technical and substantive approaches for performance evaluation do not have to exclude each other. As Stone (2012: 63) stated:“Technical efficiency does not tell you where to go, only that you should arrive there with the least possible effort”. Therefore, it is important to pay attention to those healthcare systems that show both technical efficiency and high satisfaction in the patients’opinion. In this research, this country is Iceland which has been evaluated as having a DEA-efficient healthcare system in all three models and at the same time it has been placed in the forefront of Euro-Health Consumer Index (E-HCI) 2016, after the Netherlands, Switzerland, Norway and Belgium (all of them, except the Netherlands, have been excluded from this study due to their extraordinary GDP per capita). It is also worth noting that the Netherlands’healthcare system has been constantly the undisputed Number 1 since 2005 in the E-HCI reports. According to this research, the Netherlands has been evaluated as an efficient healthcare system in Model C, while Models A and B show that it has 30% and 54% relative technical inefficiency.
Could it be that healthcare requires a certain money overindulgence? It seems that behav- ioural economics could be helpful to answer this question.
REFERENCES
Andersen, P.–Petersen, N. C. (1993): A Procedure for Ranking Efficient Units in Data Envelopment Analysis.Management Science, 39(10): 1261–1264.
Asandului, L.–Roman, M.–Fatulescu, P. (2014): The Efficiency of Healthcare Systems in Europe: A Data Envelopment Analysis Approach.Procedia Economics and Finance, 10: 261–268.
Banker, R.–Charnes, A.–Cooper, W. W. (1984): Some Models for Estimating Technical and Scale In- efficiencies in Data Envelopment Analysis.Management Science, 30(9): 1078–1092.
Banker, R.–Das, S.–Datar, S. M. (1989): Analysis of Cost Variances for Management Control in Hos- pitals.Research in Governmental and Non-Profit Account, 5: 268–291.
Bates, L.– Santerre, R. (2013): Does the U.S. Health Care Sector Suffer from Baumol’s Cost Disease?
Evidence from the 50 States.Journal of Health Economics, 32: 386–391.
Baumol, W. J. (1993): Health Care, Education and the Cost Disease: A Looming Crisis for Public Choice.
In: Rowley, C. K.–Schneider, F.–Tollison, R. D. (eds):The Next Twenty-Five Years of Public Choice.
Springer, Dordrecht, pp. 17–28.
Bj€ornberg, A. (2016):Euro-Health Consumer Index. Health Consumer Powerhouse Ltd.
Busse, R.–Saltman, R. B.–Dubois, H. F. W. (2004): Organization and Financing of Social Health In- surance Systems: Status and Recent Policy Developments. In: Saltman, R. B.–Busse, R.–Figueras, J.
(eds):Social Health Insurance Systems in Western Europe. Open University Press, pp. 62–71.
Charnes, A.–Cooper, W. W.–Rhodes, E. L. (1978): Measuring the Efficiency of Decision-Making Units.
European Journal of Operational Research, 2(6): 429–444.
Cheng, G.–Qian, Z.–Zervopoulos, P. D. (2011): Overcoming the Infeasibility of Super-Efficiency DEA Model: A Model with Generalized Orientation.MPRA Paper, No. 31991.
Colombier, C. (2017): Drivers of Health-Care Expenditure: What Role Does Baumol’s Cost Disease Play?
Social Science Quarterly, 98(5): 1603–1623.
Cooper, W. W.–Seiford, L. M.–Tone, K. (2007):Data Envelopment Analysis. A Comprehensive Text with Models.Springer.
Delnoij, D. M. (2013): Bismarck or Beveridge: Primary Care Matters.European Journal of Public Health, 23(3): 349.
Dinca, G.–Dinca, M. S.–Andronic, M. L. (2020): The Efficiency of the Healt Care Sytems in EU Countries - A DEA Analysis.Acta Oeconomica, 70(1): 19–36.
Dlouhy, M. (2016): Efficiency of National Health Systems: Data Envelopment Analysis with Unobservable Measures. In:Hradec Economic Days 2016, University Hradec Kralove, pp. 162–168.
Dutu, R.–Sicari, P. (2016): Public Spending Efficiency in the OECD: Benchmarking Health Care, Education and General Administration.OECD Economics Department Working Papers, No. 1278, Paris.
Elola, J. (1996): Health Care System Reforms in Western European Countries: The Relevance of Health Care Organization.International Journal of Health Services, 26: 239–251.
Farrell, M. J. (1957): The Measurement of Productive Efficiency.The Journal of the Royal Statistical. Series A (General), 120(3): 253–290.
Figueras, J.–Saltman, R. B.–Busse, R.–Dubois, H. F. W. (2004): Patterns and Performance in Social Health Insurance Systems. In: Saltman, R. B.–Busse, R.–Figueras, J. (eds):Social Health Insurance Systems in Western Europe. Maidenhead: Open University Press, pp. 81–140.
Freeman, R. (1998): Competition in Context: The Politics of Healthcare Reform in Europe.International Journal for Quality in Healthcare, 10(5): 395–401.
Galama, T. J.–Hullegie, P.–Meijer, E.–Outcau, S. (2012): Is There Empirical Evidence for Decreasing Returns to Scale in a Health Capital Model?Health Economics, 21(9): 1080–1100.
Goodin, R. E. –Wilenski, P. (1984): Beyond Efficiency: The Logical Underpinnings of Administrative Principles.Public Administration Review, 44: 513.
Grossman, M. (1972):The Demand for Health: A Theoretical and Empirical Investigation. NBER Books.
Grossman, M. (1982): The Demand for Health after a Decade.Journal of Health Economics, 1(1): 1–3.
Grossman, M. (2004): The Demand for Health, 30 Years Later: A Very Personal Retrospective and Prospective Reflection.Journal of Health Economics, 23(4): 629–636.
Hartwig, J. (2008): What Drives Health Care Expenditure? Baumol’s Model of ‘Unbalanced Growth’
Revisited.Journal of Health Economics, 27: 603–623.
Joumard, I.–Andre, C.–Nicq, C. (2010): Healthcare Systems: Efficiency and Institutions.OECD Economics Department Working Papers, No. 769, Paris.
Kutzin, J.–Cashin, C.–Jakab, M. (2010):Implementing Health Financing Reform. Lessons from Countries in Transition. World Health Organization Observatory Studies, Series No 21.
Kuvikova, H. (2004): Zdravotnicke systemy sveta v kontexte zvysovania realnych financnych zdrojom (Worldwide Health Care Systems in Context of Real Financial Resources Increasing). Ekonomicky casopis, 52(8): 957–972.
Lameire, N. – Joffe, P. – Wiedeman, M. (1999): Healthcare Systems – An International Review: An Overview. Nephrology Dialysis.Transplantation, 14(6): 3–9.
Medeiros, J.–Schwierz, C. (2015): Efficiency Estimates of Health Care Systems.Economic Papers, No. 549.
Publication Office of the European Union, Luxembourg.
Mihalyi, P. (2017): Recent Changes in the Hungarian Healthcare System, 2010–2017.Zdrowie Publiczne I Zarza¸dzanie, 15(3): 242–250.
Nemec, J.–Kolisnichenko, N. (2006): Market-Based Healthcare Reforms in Central and Eastern Europe:
Lessons after Ten Years of Change.International Review of Administrative Sciences, 72(1): 11–26.
Or, Z.–Cases, C.–Lisac, M.–Vrangbaek, K.–Winblad, U.–Bevan, G. (2010): Are Health Problems Systemic? Politics of Access and Choice under Beveridge and Bismarck Systems.Health Economics.
Policy and Law, 5(3): 269–293.
Pelone, F.–Giulio De Belvis, A.– Volpe, M.–Ricciardi, W. (2008): Is There a Relationship between Healthcare Models and Their Performance Assessment? The Results of an Extensive Review.Italian Journal of Public Health, 62: 102–106.
Reinhardt, U. E. (2009): The Mounting Price of Health Care’s Status Quo.The New York Times.
Russo, L. X. (2016): Cost Disease of Health Care and No Growth.Economic and Environmental Studies, 16(4): 717–728.
Rutgers, M. R.–Meer, H. (2010): The Origins and Restriction of Efficiency in Public Administration.
Regaining Efficiency as the Core Value of Public Administration.Administration and Society, 42(7):
755–799.
Saltman, R. B.–Figueras, J. (1998): Analyzing the Evidence on European Healthcare Reforms. Health Affairs, 17(2): 85–108.
Stone, D. (2012): Policy Paradox, the Art of Political Decision Making. New York: W.W. Norton &
Company Inc.
Tone, K. (2001): Slacks-Based Measure of Efficiency in Data Envelopment Analysis.European Journal of Operational Research, 130(3): 498–509.
Tone, K. (2002): A Slacks-Based Measure of Super-Efficiency in Data Envelopment Analysis.European Journal of Operational Research, 143(1): 32–41.
Wagstaff, A. (2009): Social Health Insurance vs. Tax-Financed Health Systems–Evidence from the OECD.
Policy Research Working Paper, No. 482, The World Bank.
Waldo, D. (1948):The Administrative State. New York: Holmes & Meier.
Wendt, C. (2009): Mapping European Healthcare Systems: A Comparative Analysis of Financing Service Provision and Access to Healthcare.Journal of European Social Policy, 19(5): 432–445.
Zee, J.–Kroneman, M. W. (2007): Bismarck or Beveridge: A Beauty Contest between Dinosaurs.BMC Health Services Research, 7: 94.