Introduction
The current spatial development of Poland features clearly-visible outcomes of the marked westward relocation of the national borders after World War II. At the Potsdam Conference in 1945, the leaders of the USA, the UK and the Soviet Union agreed that the Polish state would take pos- session of some territory that belonged to Germany before 1939. Poland thereafter included historical borderlines from the 19th and 20th centuries which, during the time when cap- italism was replacing the feudal system, had separated dia- metrically-opposite agricultural systems or, to make things more complicated, immeasurably dissimilar socio-economic systems (Janzen, 1998; Viehrig, 2007). The process had com- menced in the 19th century and evolved at the time when the Polish territory was partitioned by three states: Austria, Prus- sia and Russia, each of which had a different level and pace of economic development. The regional imbalances were still evident in the interwar period (Kostrowicka et al., 1984, Goldstein and Klüsener, 2010), which enhanced the sig- nificance of the Human Development Index (HDI, general level of development and state of agricultural culture) for the formation of the spatial structure of agriculture (Wyczański, 2003). Consequently, the post-1945 Polish borders contained rural areas with a highly differentiated agrarian structure and agricultural traditions, and a different history of settlement and economic development.
Owing to the nature of the Polish political and economic history and as a result of the current Polish borders being drawn as recently as 1945, within the scope of the agricultural geography of Poland, the historically-shaped diversifica- tion of spatial structures in agriculture became an important research topic. Research has been carried out particularly by Kostrowicki (1968, 1973, 1978), as well as Bański (1999, 2007), Falkowski and Kostrowicki (2001), Kulikowski (2004), Rudnicki (2016) and Stanek et al. (2017). The meth-
odology established by these researchers involved the analy- sis of agriculture in the form of a package of internal features (whereby several sub-groups are distinguished), the spatial patterns of which are analysed with regard to the external features of agriculture – natural and anthropogenic – such as agricultural production area quality; historical and eco- nomic determinants; urbanisation and industrialisation; food industry; access to communication; commercial outlets; and agriculture-related state policy (Falkowski and Kostrowicki, 2001).
Studies on the differences between agricultural systems, land use and land development in the context of present-day political borders have shown that large-scale socio-economic and political factors considerably affect the methods of spa- tial management in Europe (Kuemmerle et al., 2006; Lukas and Pöschl, 2006). Notwithstanding that, the literature (e.g.
Juchler, 2000; Pawlak, 2004; Czapiewski and Kulikowski, 2005; Dannenberg and Kulke, 2005; Rumney, 2005) is defi- cient in terms of studies devoted to the permanence of the outcomes of the politically-driven divisions in European agriculture. The three major theoretical approaches in agri- cultural geography (based on the environment, economy and behavioural patterns; cf. Ilbery, 2014) make no mention of the role of borders in the development of agriculture, even though spatial studies of agriculture draw attention to the substantial impact of state-imposed agricultural policy and of the procedures of regionalisation and classification. The attempts to explain the diversified patterns in spatial struc- tures in agriculture are currently being dominated by the integrated approach which combines various points of view and a multitude of methods, and enables a more effective explanation of the causes of spatial phenomena and pro- cesses (Lukas and Pöschl, 2005).
This paper is an attempt at the comprehensive analysis of the spatial structure of Polish agriculture with special regard to the impact of the historical factor. It enriches the body of Roman RUDNICKI*, Aleksandra JEZIERSKA-THÖLE*, Łukasz WIŚNIEWSKI*, Jörg JANZEN** and
Leszek KOZŁOWSKI*
Former political borders and their impact on the evolution of the present-day spatial structure of agriculture in Poland
The paper deals with the results of an analysis of the spatial structure of agriculture in Poland which was aimed at assessing the impact of the historical factor. The territory of present-day Poland includes the political borders of the 19th and 20th centu- ries which divided the area into two parts: western (Kingdom of Prussia and the land belonging to Poland and Germany in the interwar period) and eastern (the land of the Russian Empire and the Austro-Hungarian Empire which later belonged to Poland in the interwar period). The historical factor and its impact were examined also in the comparative analysis of two adjoining stretches of land accepted as territorial units (East Poland and West Poland). We showed that historical borders constitute an important element affecting the evolution of the spatial structure of Polish agriculture. The impact of the historical factor was shown to be the strongest for the differences in the features associated with agrarian structure, rural socio-demography, and productivity and profitability of agricultural holdings.
Keywords: agrarian structure, agricultural development, historical factor JEL classifications: Q10, N53, N54
* Uniwersytet Mikolaja Kopernika w Toruniu, Lwowska 1, 87 100 Toruń, Poland. Corresponding author: alekjez@umk.pl; https://orcid.org/0000-0002-7607-9531
** Freie Universität, Berlin, Germany.
Received 6 March 2018; revised 23 April 2018; accepted 25 April 2018.
knowledge on the changes in spatial structures in agriculture, for example, by providing an answer to the question about the permanence of the consequences arising from the co-existence of different economic systems. The research is based on the results of the National Agricultural Census of 2010 (NAC 2010) and their spatial distribution, taking into account the most important political borderlines of the 19th and 20th cen- turies which can be traced in the present-day area of Poland.
We divided the territory of the bygone Kingdom of Poland into West Poland (with particularisation of the land belonging to Poland and Germany in the interwar period) and East Poland (land of the Austro-Hungarian Empire and the Russian Empire). According to the agricultural produc- tion area quality index for Poland, which averaged 66 points as calculated from data published by the Polish Institute of Soil, Science and Plant Cultivation, Puławy in 2000, the two separated areas do not differ much in terms of natural conditions. The western part scored 69 points, whereas the eastern part recorded 65 points. Thus, it can be assumed that the registered disproportions in agricultural features result from the impact of anthropogenic conditions, particularly the historical ones. The (LAU 1) powiat was used as the basic unit of the spatial analysis – the study covered 314 adminis- trative units, according to the organisational division of the Agency for Restructuring and Modernisation of Agriculture.
The powiat of Bieruń and Lędziny in Śląskie Voivodship and the powiat of Golub Dobrzyń in Kujawsko-Pomorskie Voivodship were impossible to qualify unambiguously to one or the other type due to their doubt-arising borderline; there- fore, they were categorised upon another criterion: number of agricultural holdings (Rudnicki, 2009).
Methodology
Definition of territorial units
The analysis of the historical determinants was carried out within the timeframe marked by the important events of 1815 (Congress of Vienna, which maintained the politi- cal division of Europe); 1919 (Treaty of Versailles, which gave rise to the state of Poland); and 1945 (Potsdam Confer- ence, which marked the current political borders of Poland).
It facilitated the division of the powiats of the present-day Poland into two groups:
• Area of the Kingdom of Prussia (referred to here as ‘West Poland’ (WP), including the area which belonged to Germany and Poland in the period 1919- 1939, i.e. the following (NUTS 2-level) voivodships:
Dolnośląskie, Lubuskie, Opolskie, Pomorskie and Warmińsko-Mazurskie, and some of the powiats of Kujawsko-Pomorskie, Śląskie and Wielkopolskie voivodships. Our analysis also accounted for the bipartite division of this area, including the territories of two historical units: (a) the Kingdom of Prussia in the period of the Polish Partitions and Germany in the interwar period (KP/G); and (b) the Kingdom of Prussia in the period of the Polish Partitions and Poland in the interwar period (KP/P).
• Area of the Austrian and area of the Russian Parti- tions (referred to here as ‘East Poland’ (EP), includ- ing the area which belonged to Poland in the interwar period, i.e. the following voivodships: Lubelskie, Łódzkie, Mazowieckie, Podkarpackie, Podlaskie and Świętokrzyskie, and some of the powiats of Kujaw- sko-Pomorskie, Śląskie, and Wielkopolskie voivod- ships. Our analysis also accounted for the bipartite division of this area, including the territories of two historical units: (a) the Russian Empire in the period of the Polish Partitions and Poland in the interwar period (RE/P); and (b) the Austro-Hungarian Empire in the period of the Polish Partitions and Poland in the interwar period (AHE/P).
Owing to its more than one hundred-year-long exist- ence and its major impact on the diversification of the HDI in Poland, the border between the historical Prussian Parti- tion and the joint area of the Russian and Austro-Hungarian Partitions is of non-negligible significance. For this reason, we distinguished two belts of border-area powiats (BAP-W and BAP-E), and the difference in the level of their agricul- tural features was juxtaposed to the difference between their superior historical units (WP, EP). This provided grounds for drawing conclusions on the permanence of this borderline and its impact on the diversification of the spatial structure of the Polish agriculture (Figure 1).
Figure 1: Political division of the territory of present-day Poland in the 19th and 20th centuries.
Key: PL-ZACH → West Poland – Prussian Partition, including: KP/N → KP/G – Kingdom of Prussia and Germany in the interwar period; KP/PL → KP/P – Kingdom of Prussia and Poland in the interwar period; PL-WSCH → East Poland – Austrian and Russian Partitions, including: CR/PL → RE/P – Russian Empire and Poland in the interwar period; CAW/PL → AHE/P – Austro-Hungarian Empire and Poland in the interwar period; PP-ZACH → BAP-W – belt of border area powiats in West Poland (along border with East Poland); PP-WSCH → BAP-E – belt of border area powiats in East Poland (along border with the West Poland)
Source: own composition
Determination of internal features of agriculture An agricultural database was compiled, based on the NAC 2010, which constituted a set of different kinds of elements (percentages, points etc.). To render them comparable and to undertake a holistic approach, specific internal features of agriculture were given in the form of standardised scores. The original value was replaced by the result of multiplication of
the difference between a feature value, its mean average and the standard deviation value. Consequently, all the variables were comparable, the average of their statistical distributions equalled zero and their variances and standard deviations were expressed in full unity digits (Racine and Raymond, 1977).
Such an analysis – according to Perkal’s method – facilitated the presentation of the average standardised score of particu- lar internal features and general agricultural development in Box 1: The internal features used to describe the spatial structure of Polish agriculture.
I. Land quality and land use. These are important determinants of agricultural development, which in economic terms affect the scale of production:
1. Percentage of priority zone areas covered by agri-environment support in the total area of agricultural land (see Rudnicki, 2007 for details of areas of high environmental value);
2. Percentage of areas ranked highly for their ecological and natural values in the total area of agricultural holdings (excluding plantation areas; applies to: forest land, meadows, grazing land and fallow land).
II. Agrarian structure. Polish agriculture is characterised by a fragmented area structure:
3. Average area of farm with at least 1 ha agricultural land;
4. Percentage of farms with over 50 ha agricultural land in the total area of agricultural holdings;
5. Average area (ha) of a plot in agricultural holdings.
III. Socio-demographic features of agriculture. Agrarian overpopulation, unfavourable demographic structure and low farmer education are features of Polish agriculture:
6. Index of labour input in agriculture (features: number of workers per 100 ha agricultural land – in form of destimu- lant; agricultural area per AWU; ratio of full-time farm workforce – 2,120 hours/year or more – to the total farm workforce);
7. Age structure of farm managers (features: percentage of farms under management of one person for over 20 years – in form of destimulant; percentage of young farm managers (i.e. < 34 years of age); weighted average of farm managers’ age – in form of destimulant);
8. Index of farm managers’ education (features: percentage of farm managers with comprehensive education – high school, college and university graduates – in the total number of farm workers; number of people with agriculture- related qualifications in the total number of farm managers; average length of (relevant) vocational education).
IV. Technical infrastructure in agricultural holdings. These can determine the method of agricultural management, and can influence the increase of work efficiency and the increase of the productivity of the land:
9. Level of agricultural mechanisation (features: number of symbolic units of agricultural mechanisation per agricul- tural holding, whereby the following conversion formulae were applied: combine harvesters x 3 units; tractors x 2 units; other machines x 1 unit; number of tractor-mounted machines per tractor; number of combine, potato and beet harvesters – altogether per 100 ha of agricultural land);
10. Level of agricultural chemicalisation (features: consumption of dry component mineral and lime fertilisers (NPK and CaO) in kg per ha agricultural land; percentage of the total number of agricultural holdings using mineral fertilisers);
11. Index of water management in agriculture (features: irrigation systems in agricultural holdings – their share in the total number of agricultural holdings and in the total area of agricultural holdings, i.e. only the area of plantations which can be irrigated);
V. Agricultural production structure. This describes the level of agricultural production – crop and livestock production as well as the degree of agricultural commodity:
12. (Related to plant production): percentage of intensive farming (orchards, vegetables and industrial crops) in the total area of agricultural land;
13. (Related to animal production): percentage of animal production in the global agricultural production (see Goraj et al., 2012 for the determination of the global agricultural production.
VI. Agricultural productivity and profitability. These determine the financial income obtained from the sale of agricul- tural products and from non-agricultural activities:
14. Agricultural productivity index (basic features showing the global agricultural outputs per ha agricultural land, per agricultural holding with agricultural activity and per farm worker [AWU]);
15. Agricultural profitability index (features: percentage of agricultural holdings where the share of incomes from agri- cultural activity is greater than 50 per cent of the total income of that holding; percentage of households with non- agricultural incomes in the total number of agricultural holdings; and percentage of agricultural holdings using up to 50 per cent of residual value of agricultural outputs for self-supply in the total number of agricultural holdings).
Source: own compilation
terms of both specified agricultural segments and the compos- ite approach (average value of the segments). Fifteen internal features, gathered into six groups, were used to describe the spatial structure of Polish agriculture (Box 1).
The procedure of feature standardisation was also used in the analysis of the historical conditions and their impact on the spatial structure of agriculture. In order to carry out this analysis, the set of agricultural data and the indices used were aggregated for the specified historical units. The differ-
ences between the values of these standardised scores were the basis of the index of impact assessment of the historical factor in agriculture, which – in the form of absolute values – stood behind the creation of a five-point bonitation scale of that impact, i.e.: 1 point (< 0.25 – very weak impact); 2 points (from 0.25 to 0.50 – weak impact); 3 points (from 0.50 to 0.75 – significant impact); 4 points (from 0.75 to 1.00 – strong impact); and 5 points (> 1.00 – very strong impact on spatial diversification of agriculture). This method was applied to all the fifteen internal features presented in this paper and to all groups of the internal features of agriculture.
Results
Internal features of agriculture
The level of general agricultural development was calcu- lated as the average of the sum of the standardised values of the six groups of the internal features of agriculture listed in Box 1. It is characterised by large spatial variations at both the voivodship and powiat levels (Table 1 and Figure 2).
Spatial diversification of the historical units The spatial diversification based on the political border- lines of the 19th and 20th centuries (the period of Partitions and between the World Wars) evinced large differences across Poland in the impact of historical factors. That diver- sification was assessed by the calculation of several agricul- tural features (as of 2010), taking their average levels for powiats and aggregating them for the historical units estab- lished earlier (Tables 2 and 3).
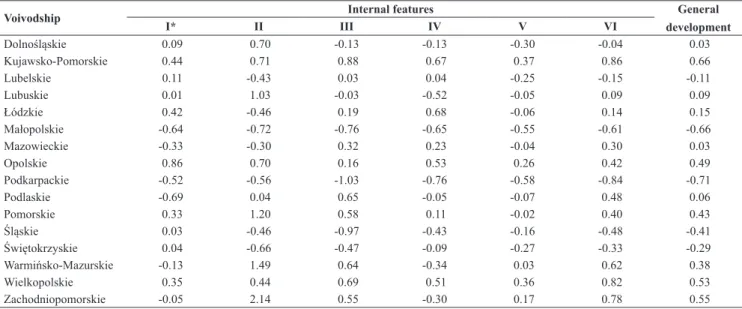
Table 1: Values of the internal features of agriculture and the level of general agricultural development in Poland by voivodship (means of standardised scores; as of 2010).
Voivodship Internal features General
development
I* II III IV V VI
Dolnośląskie 0.09 0.70 -0.13 -0.13 -0.30 -0.04 0.03
Kujawsko-Pomorskie 0.44 0.71 0.88 0.67 0.37 0.86 0.66
Lubelskie 0.11 -0.43 0.03 0.04 -0.25 -0.15 -0.11
Lubuskie 0.01 1.03 -0.03 -0.52 -0.05 0.09 0.09
Łódzkie 0.42 -0.46 0.19 0.68 -0.06 0.14 0.15
Małopolskie -0.64 -0.72 -0.76 -0.65 -0.55 -0.61 -0.66
Mazowieckie -0.33 -0.30 0.32 0.23 -0.04 0.30 0.03
Opolskie 0.86 0.70 0.16 0.53 0.26 0.42 0.49
Podkarpackie -0.52 -0.56 -1.03 -0.76 -0.58 -0.84 -0.71
Podlaskie -0.69 0.04 0.65 -0.05 -0.07 0.48 0.06
Pomorskie 0.33 1.20 0.58 0.11 -0.02 0.40 0.43
Śląskie 0.03 -0.46 -0.97 -0.43 -0.16 -0.48 -0.41
Świętokrzyskie 0.04 -0.66 -0.47 -0.09 -0.27 -0.33 -0.29
Warmińsko-Mazurskie -0.13 1.49 0.64 -0.34 0.03 0.62 0.38
Wielkopolskie 0.35 0.44 0.69 0.51 0.36 0.82 0.53
Zachodniopomorskie -0.05 2.14 0.55 -0.30 0.17 0.78 0.55
See Box 1 for descriptions of the six groups of internal features I-VI
* destimulant Source: own calculations
Figure 2: Level of general agricultural development in Poland by voivodship and powiat (means of standardised scores; as of 2010).
Key: distribution range by voivodships [RV]: from -0.71 in Podkarpackie Voivodship to 0.66 in Kujawsko-Pomorskie Voivodship; distribution range by powiats [RP]: from -1.34 in the powiat of Żywiec in Śląskie Voivodship to 1.39 in the powiat of Środa Wielkopolska in Wielkopolska Voivodship]
Source: own composition
Table 2: Values of the internal features of agriculture and the level of general agricultural development in selected historical and spatial units in Poland (as of 2010).
Internal feature West Poland East Poland
Group Feature Total Including
Total Including
Historical unit BAP-W Historical unit BAP-E
KP/G KP/P RE/P AHE/P
I 0.21 0.15 0.30 0.14 -0.17 -0.07 -0.66 -0.29
I.1 0.00 -0.02 0.03 0.19 0.00 0.01 -0.04 -0.15
I.2 0.42 0.33 0.58 0.10 -0.35 -0.16 -1.28 -0.43
II 0.98 1.19 0.64 0.53 -0.48 -0.38 -0.64 -0.35
II.3 0.92 1.06 0.71 0.51 -0.31 -0.11 -0.72 -0.13
II.4 0.93 1.25 0.35 0.40 -0.82 -0.86 -0.58 -0.83
II.5 1.09 1.25 0.86 0.68 -0.30 -0.16 -0.61 -0.10
III 0.36 0.26 0.49 0.30 -0.14 0.15 -0.92 0.04
III.6 0.69 0.72 0.65 0.52 -0.31 -0.01 -1.36 0.09
III.7 -0.21 -0.42 0.07 0.03 0.07 0.35 -0.59 0.06
III.8 0.60 0.48 0.76 0.36 -0.19 0.10 -0.82 -0.04
IV 0.09 -0.17 0.47 0.37 -0.06 0.19 -0.82 0.13
IV.9 -0.13 -0.44 0.32 0.26 0.10 0.41 -0.90 0.29
IV.10 0.31 0.04 0.69 0.42 -0.25 0.03 -1.05 0.04
IV.11 0.09 -0.12 0.41 0.45 -0.03 0.12 -0.51 0.05
V 0.20 -0.02 0.42 0.14 -0.17 -0.11 -0.52 -0.02
V.12 0.36 0.40 0.29 -0.01 -0.32 -0.26 -0.63 -0.69
V.13 0.03 -0.44 0.55 0.28 -0.03 0.03 -0.41 0.64
VI 0.52 0.31 0.84 0.55 -0.17 0.08 -0.77 0.19
VI.14 0.64 0.39 1.04 0.60 -0.21 -0.04 -0.69 0.20
VI.15 0.40 0.23 0.63 0.50 -0.13 0.20 -0.85 0.18
General development 0.39 0.29 0.53 0.34 -0.20 -0.02 -0.72 -0.05
See Box 1 for descriptions of the internal features 1-15 and their groups I-VI See Figure 1 for definitions of the spatial units
Source: own calculations
Table 3: Selected elements of historical and comparative analysis based on index of impact assessment of historical factor in agriculture (difference between absolute values of standardised scores of agricultural features in point bonitation system*) including indicator of permanence of historical borders in agriculture.**
Internal feature Nationwide perspective
By historical differences in Indicator of permanence of historical borders in
agriculture
West Poland East Poland Border areas
Group Feature IAHFA† (WP) – (EP) KP/G – KP/P RE/P – AHE/P (BAP-W) – (BAP-E) (WP – EP) – (BAP-W – BAP-E) Difference Points Difference Points Difference Points Difference Points Difference Label/
points
I 0.38 2 -0.15 1 0.59 3 0.43 2 -0.05 R/1
I.1 -0.01 1 -0.06 1 0.06 1 0.33 2 -0.34 R/2
I.2 0.77 4 -0.24 1 1.12 5 0.53 3 0.24 F/1
II 1.46 5 0.55 3 0.26 2 0.88 4 0.57 F/3
II.3 1.23 5 0.35 2 0.62 3 0.64 3 0.59 F/3
II.4 1.75 5 0.90 4 -0.28 2 1.24 5 0.51 F/3
II.5 1.39 5 0.40 2 0.45 2 0.77 4 0.62 F/3
III 0.50 3 -0.23 1 1.07 5 0.27 2 0.24 F/1
III.6 1.00 5 0.07 1 1.34 5 0.43 2 0.57 F/3
III.7 -0.28 2 -0.49 2 0.95 4 -0.03 1 -0.25 R/2
III.8 0.79 4 -0.28 2 0.93 4 0.40 2 0.39 F/2
IV 0.15 1 -0.64 3 1.01 5 0.25 1 -0.10 R/1
IV.9 -0.23 1 -0.76 4 1.31 5 -0.03 1 -0.20 R/1
IV.10 0.56 3 -0.65 3 1.08 5 0.38 2 0.18 F/1
IV.11 0.12 1 -0.52 3 0.63 3 0.40 2 -0.28 F/2
V 0.37 2 -0.43 2 0.41 2 0.16 1 0.21 F/1
V.12 0.68 3 0.12 1 0.37 2 0.68 3 0.00 R/1
V.13 0.06 1 -0.98 4 0.45 2 -0.37 2 0.42 F/2
VI 0.68 3 -0.52 3 0.85 4 0.36 2 0.32 F/2
VI.14 0.84 4 -0.64 3 0.65 3 0.40 2 0.45 F/2
VI.15 0.52 3 -0.40 2 1.05 5 0.32 2 0.20 F/1
General development 0.59 3 -0.24 1 0.70 3 0.39 2 0.20 F/1
* below 0.25: 1 point; 0.25-0.50: 2 points; 0.50-0.75: 3 points; 0.75-1.00: 4 points; above 1.00: 5 points
** R: rise in index value; F: fall in index value; below 0.25: 1; 0.25-0.50: 2; above 0.50: 3
† Impact assessment of the historical factor in agriculture
See Box 1 for descriptions of the internal features 1-15 and their groups I-VI See Figure 1 for definitions of the spatial units
Source: own calculations
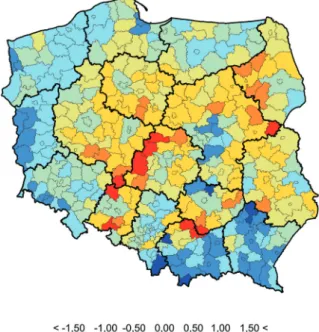
cent) to -0.82 (11.6 per cent) in EP (a difference of 1.75: 5 points) (Figure 3).
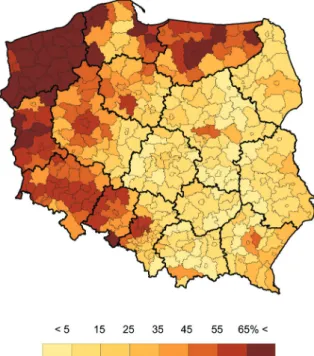
Territory belonging to the Kingdom of Prussia The analysis of the spatial differences in the agriculture of the area belonging to the Kingdom of Prussia included its division in the interwar period into: territories belonging to Germany (KP/G) and to Poland (KP/P). From the NAC 2010 it was evident that the area lying within the Polish borders in the interwar period (KP/P) had a higher level of agricultural development – 0.53 (KP/G – 0.29; difference of 0.24, i.e. 1 point). As regards the internal features of agriculture, only those representing the agrarian structure had a higher value in the area belonging to Germany in the interwar period (dif- ference of 0.55, i.e. from 1.19 KP/G to 0.64 KP/P).
The differences in the internal features of agriculture were usually at the level of 1-3 points. A wider dispropor- tion between the territories – at the level of 4 points (strong impact of the historical factor) – was registered only for fea- tures 4 and 13, whereby a stronger impact was measured for the share of the animal production in the global agricultural production: from -0.44 (41.1 per cent) in KP/G to 0.55 (56.7 per cent) in KP/P (Figure 4).
Figure 4: Share of animal production in global agricultural production in Poland by voivodship and powiat.
Key: average for Poland: 48.1 per cent; distribution range by voivodships [RV]: from 27.4 per cent in Dolnośląskie Voivodship to 63.4 per cent in Podlaskie Voivodship;
distribution range by powiats [RP]: from 4.5 per cent in the powiat of Grojec in Mazowieckie Voivodship to 86.2 per cent in the powiat of Żuromin in Mazowieckie Voivodship
Source: own composition
Differences between territories of Russian Empire and Austro-Hungarian Empire
The impact assessment of the historical factor in the agri- culture of East Poland included also the differences between the powiats lying within the borders of the Russian Parti- tion (average of -0.02) and the Austrian Partition (average of Nationwide perspective
From the nationwide perspective, the impact of the his- torical factor is determined by the differences in agricultural features between the territory of the Prussian Partition and the joint territories of the Austrian and the Russian Parti- tions. The difference in the standardised scores of these fea- tures was taken as the basis for assessing the impact of the historical factor on agriculture and for providing an answer to the following research question: is the former, more than a century-old border a determinant of the present-day spatial diversification in agriculture (cf. Kozłowski and Rudnicki, 2003)?
Figure 3: Percentage of farms with over 50 ha agricultural land in total area of agricultural holdings in Poland by voivodship and powiat, as of 2010.
Key: average for Poland: 30.3 per cent; distribution range by voivodships [RV]: from 6.5 per cent in Świętokrzyskie Voivodship to 70.7 per cent in Zachodniopomorskie Voivodship; distribution range by powiats [RP]: from 0.9 per cent in the powiat of Sucha Beskidzka in Małopolskie Voivodship to 84.2 per cent in the powiat of Słubice in Lubuskie Voivodship
Source: own composition
The studies demonstrated significant differences in the level of general agricultural development in West Poland (0.39) and East Poland (-0.20), with the index of impact assessment of the historical factor in agriculture amounting to 0.59 (3 points). The index had higher values in the terri- tory of the Prussian Partition for all six internal features of agriculture, as defined above (from 1 point for features of technical infrastructure in agricultural holding, to 5 points for features of agrarian structure). Among the fifteen inter- nal features of agriculture, only two (no. 7: age structure of farm managers; and no. 9: level of agricultural mechanisa- tion) were lower in the Prussian Partition than in the Austrian and Russian Partitions (together). For four other features the impact of the historical factor was very strong (5 points) and was the strongest for the feature of agrarian structure – per- centage of farms with over 50 ha agricultural land in total area of agricultural holdings – from 0.93 in WP (51.5 per
-0.72). The index showed the impact to be significant (0.70:
3 points). Only three of the internal features of agriculture in the Austrian Partition exceeded those in the Russian Partition (no. 7: 1 point; no. 9: 1 point; no. 13: 2 points). The widest gap between the territories (1.31: 5 points) was characteristic of feature no. 9 (level of agricultural mechanisation) from 0.41 (RE/P) to -0.90 (AHE/P). (Figure 5).
Figure 5: Level of agricultural mechanisation in Poland by voivodship and powiat (as of 2010; standardised score).
Key: distribution range by voivodships (RV): from -0.92 in Lubuskie Voivodship to 0.75 in Łódzkie Voivodship; distribution range by powiats (RV): from -2.15 in the powiat of Zakopane in Małopolskie Voivodship to 3.03 in the powiat of Kazimierza Wielka in Świętokrzyskie Voivodship
Source: own composition
Differences between belts of powiats
Within the study on the permanence of the impact of the former political borderline on agriculture, two adjoining belts of powiats were distinguished: those situated in West Poland (27 powiats; average level of general agricultural development at 0.34) and East Poland (29 powiats; average level of general agricultural development at -0.05).
The impact of the historical factor, at 0.39 (2 points: weak impact), was lower than that achieved in the nationwide anal- ysis (WP; EP: 0.59). It implies that the historically-shaped differences in the spatial structure of Polish agriculture are gradually disappearing. To quantify this phenomenon, we introduced into the analysis another index – one which showed the permanence of historical borders in agriculture.
Narrowing down of these differences (F-indicator in Table 3) was most pronounced in the groups of features describing the agrarian structure (0.57: 3 points) and agricultural pro- ductivity and profitability (0.32: 2 points). It was also note- worthy in the case of the average area of a plot in agricultural holdings (feature no. 5; result of 0.62: 3 points).
On the other hand, the phenomenon also had a completely opposite manifestation. Apart from the naturally-determined feature describing the percentage of priority zone areas cov- ered with agri-environment support in the total area of agri-
cultural land (feature no. 1; result of -0.34), the converse sit- uation to the one described above was the most conspicuous in the group of features defining the technical infrastructure in agricultural holdings (features no. 9 – level of agricultural mechanisation; and no. 11 – index of water management in agriculture). This is disappointing, particularly owing to the fact that our analysis shows the agriculture and its condi- tions in 2010, by which time it had already been supported by European Union (EU) agricultural financial support pro- grammes for almost seven years.
Discussion
The analysis of the spatial structure of Polish agricul- ture demonstrated that, in spite of Polish membership of the EU and coverage of agricultural holdings with several instruments within the Common Agricultural Policy in the context of considerable socio-economic growth, the conclu- sion of Kostrowicki (1978) is still valid, namely that Polish agriculture in its spatial structure has been highly diversi- fied, whereby – at the national level – the differences are not so much associated with the variety of natural conditions as with historical events. Polish agriculture is characterised by a strong spatial diversification, usually marked by polarisa- tion – with western Poland at one end of the scale (domina- tion of features with a high indexation) and eastern Poland at the other end (domination of features with a low indexa- tion) – and vast complexity of spatial arrangements in these areas. For example, the highest level of general agricultural development was found in the group of powiats situated within the borders of the Kingdom of Prussia and Poland in the interwar period; and the lowest level was registered in those of the Austro-Hungarian Empire.
The comparative analysis of the historical factor and its impact assessment in the agriculture of border area powiats, in juxtaposition to the indexation applying to Poland as a whole, showed that the historically-determined dispropor- tions in the spatial structure of Polish agriculture were, in general, less and less overwhelming (the tendency was reflected by the four groups of internal features of agriculture and seven internal features). However, the phenomenon took an entirely opposite turn in the case of the features describ- ing land quality and land use as well as those related to the technical infrastructure in agricultural holdings – here the historically-conditioned differences widened.
The present-day spatial patterns in agriculture (as of 2010) first and foremost result from the substantial impact of the historical factor (WP-EP: 0.59: 3 points). Even though Poland has been in existence for nearly seventy years, the principal determinant of the spatial diversification of its agri- culture is represented by the historical conditions and defined by remarkably large disproportions in agricultural features between western and eastern Poland. The historical condi- tions have the potential for an all-encompassing impact on agriculture. From the nationwide perspective and with regard to the set of specified segments, their impact on the features of technical infrastructure in agricultural holdings was very weak (1 point); in the case of the features describing land quality and land use as well as agricultural production struc-
ture it was weak (2 points); it was stronger (3 points) for the socio-demographic features of agriculture and the features associated with agricultural productivity and profitability.
Finally, for the features of agrarian structure the impact was very strong (5 points). How necessary is the narrowing of these disproportions is an issue considered by Rosner (2012) and Stanny (2013), and is an essential problem in the context of the socio-economic growth, including agriculture.
We can conclude from our results that the differences in the internal features of agriculture in territories which used to be subject to dissimilar economic systems are disappear- ing over time, most rapidly along the border between these systems; whereas the further away it is from that histori- cal border, the permanence of the differences is gaining in prevalence. The regional and rural development policy lines should aim to eliminate the disproportions associated with the level of agricultural productivity and with the living standards of rural population.
From our results, it is now possible to answer the ques- tion about the permanence and the role of the historical factor – i.e. bygone socio-economic systems and political borders – in the present-day spatial structure of Polish agriculture.
We demonstrated that the historical factor constitutes a significant determinant of diversity in the spatial structures of agriculture, especially the agrarian structure. Although the differences occurring along the former political border are vanishing, they remain potent in the territories further away from that borderline. This is a good basis for discus- sion on the role of the contemporary national borders in the agriculture of the EU. What is left for further deliberations is whether the present-day national borders in Central and Eastern Europe, including those between the EU Member States, have any significant impact on agricultural develop- ment, and if so, the extent of that impact.
References
Bański, J. (1999): Obszary problemowe w rolnictwie Polski [Prob- lem areas in Polish agriculture]. Warszawa: IGiPZ-PAN.
Bański, J. (2007): Geografia rolnictwa Polski [Geography of Polish agriculture]. Warszawa: Polskie Wydawnictwo Ekonomiczne.
Czapiewski, K. and Kulikowski, R. (eds) (2005): Dorobek nau- kowy geografii rolnictwa w Polsce [Scientific achievements of agricultural geography in Poland]. Warszawa: IPiGZ-PAN.
Dannenberg, P. and Kulke, E. (2005): The Importance of Agrarian Clusters for Rural Areas. – Results of Case Studies in Eastern Germany and The West Poland. Die Erde 136 (3), 291-312.
Falkowski, J. and Kostrowicki, J. (2001): Geografia rolnictwa świata [Geography of agriculture in the world]. Warszawa:
Wydawnictwo Naukowe PWN.
Goldstein, J.R. and Klüsener, S. (2010): Culture Revisited: Geo- graphic Analysis of Fertility Decline in Prussia. MPIDR Work- ing Paper WP-2010-012. Rostock: Max Planck Institute for Demographic Research.
Goraj, I., Bocian, M., Cholewa, J., Nachtman, G. and Tarasiuk, R. (2012): Współczynniki Standardowej Produkcji dla celów Wspólnotowej Typologii Gospodarstw Rolnych [Standard pro- duction coefficients for the purposes of the Community Typol- ogy of Agricultural Holdings]. Warzsawa: IERiGŻ-PIB.
Ilbery, B.W. (2014): Theory and Methodology in Agricultural Ge- ography, in M. Pacione (ed.), Progress in Agricultural Geogra- phy. Abingdon: Routledge.
Janzen, J. (1998): Agrarstrukturwandel in Westpolen [Agricultural structural change in western Poland]. Geographische Rund- schau 50 (1), 42-48.
Juchler, J. (2000): Zehn Jahre Transformationsprozess in Polen [Ten years of transformation process in Poland]. Osteuropa 50 (2), 189-200.
Kostrowicka, J., Landau, Z. and Tomaszewski, J. (1984): Historia gospodarcza Polski XIX-XX wieku [The economic history of Poland in the 19th and 20th centuries]. Warszawa: Książka i Wiedza.
Kostrowicki, J. (1968): Agricultural Typology, Agricultural Re- gionalization, Agricultural Development. Geographia Polonica 14, 265-274.
Kostrowicki, J. (1973): Zarys geografii rolnictwa [Outline of ag- ricultural geography]. Warszawa: Państwowe Wydawn. Nau- kowe.
Kostrowicki, J. (ed.) (1978): Przemiany struktury przestrzennej rolnictwa Polski 1950-1970 [Transformations of the spatial structure of Polish agriculture 1950-1970]. Warszawa: IGiPZ- Kozłowski, L. and Rudnicki, R. (2003): Historical-economic basis PAN.
of present regions in Poland. Proceedings of the International Conference ‘Between Schengen Space and Enlargement to the East: The Territorial Recombining of the European Union’, International Geographical Union, Commission on Political Geography. Metz and Schengen, 134-141.
Kuemmerle, T., Radeloff, V.C. Perzanowski, K. and Hostert, P.
(2006): Cross-border comparison of land cover and land- scape pattern in Eastern Europe using a hybrid classification technique. Remote Sensing of Environment 103 (4), 449-464.
https://doi.org/10.1016/j.rse.2006.04.015
Kulikowski, R. (2004): Przestrzenne zróżnicowanie i przemiany rolnictwa w Polsce po 1990 r. [Spatial differentiation and changes in agriculture in Poland after 1990], in J.J. Parysek (ed.), Rozwój regionalny i lokalny w Polsce w latach 1989- 2002. Poznań: Bogucki Wydawnictwo Naukowe, 193-209.
Lukas, Z. and Pöschl, J. (2005): Die Landwirtschaft der neuen Mitgliedsstaaten im Jahr danach [The agriculture of the New Member States the year after]. Osteuropa-Wirtschaft 50 (2), 125-150.
Lukas, Z. and Pöschl, J. (2006): Die Landwirtschaft der neuen Mitgliedsstaaten im Integrationsprozess [The agriculture of the New Member States in the integration process]. Osteuropa- Wirtschaft 51 (3-4), 193-211.
Pawlak, Z. (2004): Strukturwandel der Landwirtschaft in Westpolen [Structural change of agriculture in western Poland], in H. Stoll (ed.), Strukturwandel in Ostdeutschland und Westpolen. Hanno- ver: Akademie für Raumforschung und Landesplanung, 91-102.
Racine, J.B. and Reymond, H. (1977): Analiza ilościowa w geo- grafii [Quantitative analysis in geography]. Warszawa: PWN.
Rosner, A. (ed.) (2012): Rozwój wsi i rolnictwa w Polsce. Aspekty przestrzenne i regionalne [Rural development and agriculture in Poland. Spatial and regional aspects]. Warszawa: IRWIR-PAN.
Rudnicki, R. (2007): Przyrodnicze uwarunkowania zróżnicowania przestrzennego procesu absorpcji funduszy Unii Europejskiej w rolnictwie polskim [Natural conditions of spatial diversity of the absorption process of European Union funds in Polish ag- riculture]. In: S. Grykień, and W. Hasiński (ed.): Przyrodnicze uwarunkowania rozwoju obszarów wiejskich. Studia Obszarów Wiejskich 12, 113-128.
Rudnicki, R. (2009): Renty strukturalne jako czynnik przemian agrarnych i demograficznych w rolnictwie polskim w latach 2004-2006 [Structural pensions as a factor of agrarian and de- mographic change in Polish farming over the years 2004-2006].
Poznań: Bogucki Wydawnictwo Naukowe.
Rudnicki, R. (2016): Rolnictwo Polski. Studium statystyczno- przestrzenne (lata 2002-2010) [Polish agriculture. Statistical
and spatial study (2002-2010)]. Toruń: Wydawnictwo Nau- kowe Uniwersytetu Mikołaja Kopernika.
Rumney, T.A. (2005): The Study of Agricultural Geography:
A Scholarly Guide and Bibliography. Lanham MD: Scarecrow Press.
Stanek, P., Żółkiewski, P., Teter, W., Chabuz, W., Litwińczuk, Z.
and Bochniak, A. (2017): The role of main fodder area as a factor limiting the development of farms under conditions of sustainable agriculture. A case study from the Podkarpacie re- gion (southern Poland, Western Carpathians). Agroecology and Sustainable Food Systems 42 (5), 477-492. https://doi.org/10.1 080/21683565.2017.1359809
Stanny, M. (2013): Przestrzenne zróżnicowanie rozwoju obszarów wiejskich w Polsce [Spatial diversification of rural develop- ment in Poland]. Warszawa: IRWiR-PAN.
Viehrig, H. (2007): Polens Landwirtschaft und ländliche Siedlun- gen in der Transformation [Poland’s agriculture and rural set- tlements in the transformation]. Potsdam: Universitätsverlag Potsdam.
Wyczański, A. (2003): Wschód a Zachód Europy w początkach doby nowożytnej [East and West of Europe at the beginning of modern day]. Warszawa: Semper.