DOI: 10.33032/acr.2019.9.2.149 EXAMINING THE IMPACT OF OIL PRICE CHANGE ON
THE ECONOMY THROUGH GDP CHANGE Szira Zoltán – Hani, Alghamdi – Varga Erika
Abstract
Petroleum economics is the field that studies human utilization of petroleum resources and the consequences of that utilization. Petroleum use allows the production of energy.
Resources can be regarded as renewable or depletable; petroleum falls into the latter cate- gory, which can have an effect on pricing strategies. Crude oil is one of the main natural feedstocks used to meet energy demands and price variation has a significant influence on the society development. A large amount of research suggests that oil price fluctuations have considerable consequences on economic activity. These consequences are expected to be different in oil importing and in oil exporting countries. Whereas an oil price increase should be considered positive news in oil exporting countries and negative news in oil importing countries, the reverse should be expected when the oil price decreases. The paper investigates the co-movements and causality relationship between oil prices and GDP of selected oil exporting countries. Our assumption is decreasing oil prices has a negative impact on the GDP of such countries.
Keywords: oil price, GDP, relationship, export, impact JEL: O11
Introduction
The causality testing is based on the Granger-causality concept (Granger W. J. 1969).
Earlier studies assumed a symmetric relationship and generally found causality run- ning from oil prices to GDP. The asymmetric specification which is based on Mork’s (1989) oil price increase and decrease and also Hamilton’s (1996a, 1996b) net oil price increase specifications significantly improved model specification of the oil price-economics. Hooker (1996) identified the changes in the causality relationship between oil prices and GDP while searching for a statistically stable specification.
The works of Hooker (1996a, 1996b) and Hamilton (1996) has played a very im- portant role in establishing a stable statistical relationship between oil price changes and GDP. Generally, the interaction of the oil price-GDP relationship with the mod-
els of transmission channels has improved the understanding on how oil prices might influence a macroeconomic aggregate such as GDP. Hamilton (1983) was the .first to report the weakening statistical relationship between oil prices and GDP.
According to Rotemberg and Woodford (1996), these specifications did not en- tirely settle the question of whether a stable, long-term relationship between oil prices and other macroeconomic variables existed. Finn’s (2000) specification of a similar aggregate model reveals that an oil price shock causes sharp, simultaneous decreases in energy use and capital utilisation. Using bivariate and multivariate VAR specifications, Hooker (1999) examined the stability of the oil price GDP relationship over the period 1954-1995. Backus and Crucini (2000) found that terms of trade volatility is signifi- cantly related to increased oil price volatility, as opposed to fluctuations in exchange rates. Bercement et al. (2009) examined how oil prices affect the output growth of selected countries that are considered either net-exporters or net importers of oil using time-series technique. Aliyu (2009) analysed the effect of oil prices on real macro- economic activity employing both linear and non-linear specifications. The paper de- scribes evidence of both linear and non-linear impacts of oil price shocks on real GDP.
The purpose of the analysis is to investigate the impact of the change in the price of oil on the GDP per capita of three country-specific groups.
Material and Methods
To answer these questions, the 10 most important oil exporters (Group A), 10 most important oil importers (Group C) and 13 OPEC countries (Group B) were select- ed, whose per capita GDP values were examined through the 16-year data series (2002-2017).
Country groups (including abbreviations) in the study were as follows:
Group A (Top 10 non-OPEC oil exporting countries) 1. United States (USA)
2. Russia (RUS)
3. China, People’s Republic (CHN) 4. Canada (CAN)
5. Brazil (BRA) 6. Mexico (MEX) 7. Norway (NOR) 8. Kazakhstan (KAZ) 9. Colombia (COL)
10. India (IND) Three countries (the United States, China, India) are also ex- porters and importers.
The estimated GDP per capita (thousand USD) was abbreviated as GDP / capita during the analysis.
During the analysis, general statistical methods (descriptive statistics, regression, correlation calculations, etc.) were used and the results were illustrated by appropri- ate types of graphs.
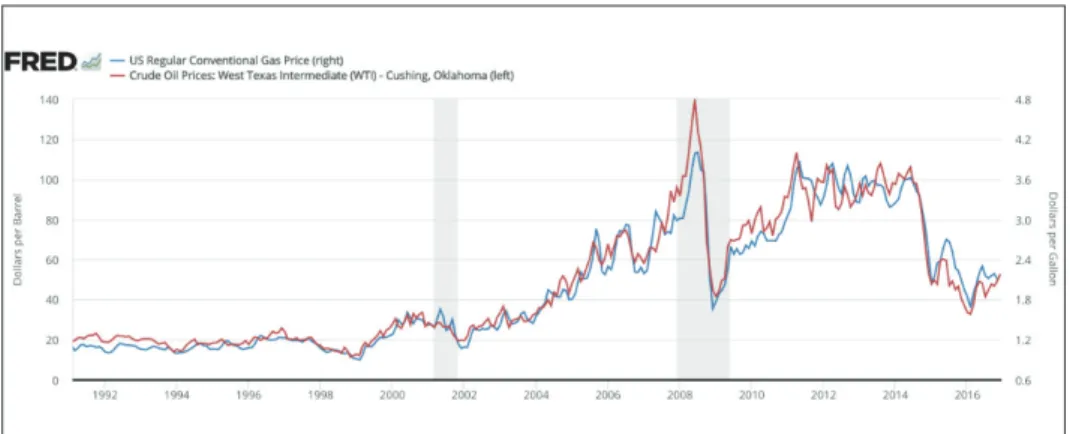
Figure 1: The price of oil prices between 2002 and 2016 Source: FRED (2019)
Figure 1 clearly shows that oil price changes can be divided into 3 phases. The first period (2002-2008) shows a relatively steady increase in oil prices. During the period under review, oil prices were almost quadrupled and annual average growth rate was 25.4% while the average annual growth rate was USD 12.04.
In 2009, the price of oil decreased by 36.6% compared to 2008, and then start- ed to rise again till 2012, exceeding the price level of 2008 by almost 15%, from which a repeated decline in prices can be observed. In the year 2016, oil prices show a nearly 75% increase compared to the base year of 2002, but a drop of near- ly 60% compared to the most favorable 2012 figure occurred. During the period under review, the oil price change showed a large fluctuation in relative variance of more than 40%.
Results
In the following part the impact of oil prices on GDP per capita is examined.
First, the changes of per capita GDP over the period under review is presented, then the relationship between oil price and GDP / principal values in the case of the examined three groups of countries. From the time series data first the values of the mean, standard deviation and relative scattering of 15 years per GDP/capita were calculated.
Group A USA RUS CHN CAN BRA
mean 49075.4 10162.6 4275.2 47967.4 10548.4
s 1807.20 1393.48 1545.05 1645.13 1023.04
s% 3.68 13.71 36.14 3.43 9.70
Group A MEX NOR KAZ COL IND
mean 9088.6 88398.0 8674.2 6187.0 1276.6
s 406.07 2181.41 1623.75 878.91 324.63
s% 4.47 2.47 18.72 14.21 25.43
Table 1: The main indicators of members of the “A” country group Source: authors’ own calculation
Based on the results of descriptive statistics about the examined 15 years (2002- 2016), it can be seen that the relative deviation (s%) of GDP per capita in high GDP/capita countries (NOR, USA, CAN) is low (below 4%) while in the case of CHN and IND with a low GDP / capita, the relatively small standard deviation results in relatively high relative scattering (36% and 25%, respectively).
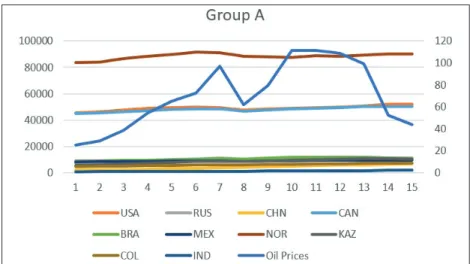
Figure 2: Changes in oil prices and GDP / capita (2002-2016) Source: authors’ own calculation
The figure shows that the decline in oil prices in 2009 resulted in a smaller decline / reduction of GDP / capita in economically developed countries (NOR, USA, CAN), which was restored within 1-2 years after the decline.
The changes of GDP / capita of the smaller GDP / capita countries is illus- trated in another figure (Figure 2/a)/ to better observe its formation and changes.
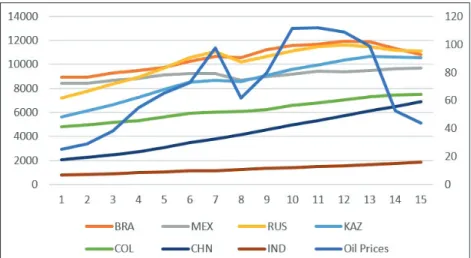
Figure 2 / a Changes of oil prices and GDP / capita in time (2002-2016) Source: authors’ own calculation
Figure 2a presents a similar trend to the previous case. The decline in oil prices has led to a decline in GDP per capita, which has started to grow again in one year.
Exceptions were found only in two countries. The poorest country in India has not responded to the decline in oil prices, continuing to increase its GDP per capita on average by USD 74. 8 per year. China has also remained resistant to the decline in oil prices with a stronger GDP per capita growth (USD 356.6 a year).
So far, we have been investigating the changes of oil price change and GDP / capita in time, and we have demonstrated a decrease in the GDP / capita of the oil price decrease in 8 oil exporting countries.
In the following part, the effect of oil price change on the GDP / capita val- ue is examined directly by regression analysis. (Figure 3).
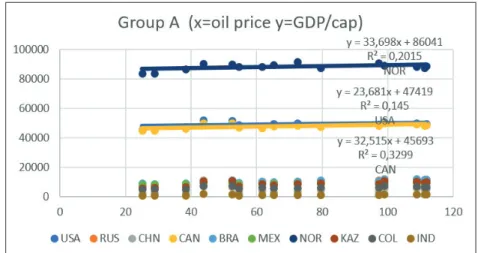
Figure 3: Illustrating the correlations between oil price and GDP/capita (Part 1) Source: authors’ own calculation
Assuming a linear relationship, the determination coefficients show a low val- ue r2 = 20.15% (NOR); r2 = 14.50% (USA); r2 = 32.99% (CAN) for the 3 most economically advanced countries. That is, oil prices cannot at all (NOR, USA) or only slightly affect GDP / capita (CAN) statistically and other components of the economy play much greater role.
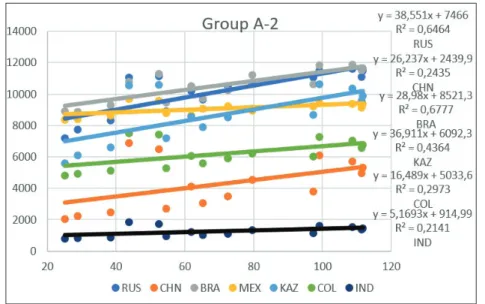
The other 7 oil exporting countries in Group A show varying degrees of de- pendence on oil price change. (Fig. 3 / a)
Based on Figure 3 / a, it can be stated that, in examining the oil price and the GDP / capita linear relationship, in certain countries oil price change has had a different impact on GDP. For example, in RUS r2 = 64.64%) and BRA (r2 = 67.77%), the dominant role of the oil price is high above 60%, while in other countries it is more moderate (KAZ r2 = 43.64%, COL r2 = 29. 73%) and in some cases it is statistically not justified (CHN r2 = 24.35% and IND r2 = 21.41%).
Figure 3/a: Illustrating the correlations between oil price and GDP/capita (Part 2) Source: authors’ own calculation
The table below (Table 2) shows the degree of dependence of GDP per capita in relation to the oil price and the yearly effect. The yearly effect in this case means the effect of the complete complex economic environment.
Countries GDP pc r2 (oil) r2 (year) b (oil) b (year)
NOR 88392,4 0,204 0,321 33,85 285,36
USA 49095,4 0,139 0,707 23,56 357,38
CAN 48002,6 0,307 0,812 32,25 352,96
BRA 10548,4 0,678 0,796 28,98 211,28
RUS 10227,5 0,634 0,813 39,70 302,57
MEX 9088,6 0,312 0,789 7,81 83,50
KAZ 8674,3 0,436 0,958 36,91 367,81
COL 6187,0 0,297 0,993 16,49 202,72
CHN 4275,2 0,244 0,995 26,24 356,64
IND 1276,6 0,214 0,992 5,17 74,83
Table 2 Regression parameters for countries in Group A Source: authors’ own calculations from basic data
Legend
r2 (oil) = determination coefficient that shows how much oil price volatility ex- plains the fluctuation of GDP / capita.
r2 (year) = determination coefficient that shows the extent to which the yearly ef- fect (general economic environment) changes the fluctuation of GDP / capita.
b (oil) = regression coefficient that shows the average change of the unit price of oil on the GDP / capita change over the period under review.
b (year) = regression coefficient that shows the average GDP / person change over the year in the examined period.
Based on the indicators in Table 2, it can be stated that the change in the oil price has no statistically verifiable effect on the GDP / capita value in four out of 10 coun- tries. Two of them are the most developed ones (NOR, USA) and the other two are the poorest countries in the group CHN, IND).
That is, the price of oil is only slightly affected by GDP / capita and the other components of the economy play a greater role.
In the case of BRA and RUS, the impact of oil price change on the GDP / capita (r2 = 67.8% and 63.4%), i.e. the economic growth, is strongest.
The yearly impact (general economic environment) is very significant for the 4 poorest countries (95-99%) and for other countries (70.7-80.3%) it is also decisive.
An exception is NOR, where the determination is only 32.1%, but this is also sta- tistically significant.
Table 3 below shows the strength of linear relationships between the characteris- tics of correlations (of Table 2).
GDP pc r2 (oil) r2 (year) b (oil) b (year)
GDP pc 1.000
r2 (oil) -0.399 1.000
r2 (year) -0.892 0.148 1.000
b (oil) 0.360 0.457 -0.322 1.000
b (year) 0.370 0.009 -0.137 0.818 1.000
Table 3: The value of the correlation coefficients between the indicators in Table 2 Source: authors’ own calculations from basic data
Based on the value of the correlation coefficients, it can be concluded that, by analogy, GDP / capita is in the strongest correlation with the yearly effect (r
= -0.892). In this case, the negative sign indicates that the GDP per capita of the more developed countries (e.g. NOR) is less dependent on the yearly effect, while the economically underdeveloped countries (KAZ, COL, CHN, IND) depend on the yearly effect. Dependence on oil price fluctuations and GDP / capita also have
a negative but lesser correlation (r = 0.399). That is, in this case, economically more advanced countries are less exposed to oil price fluctuations, while the less developed countries are more dependent on changes in oil prices.
There is no significant correlation between the degree of dependency on the year- ly effect and the degree of dependence on oil (r = 0.148). Thus, these two indices appear to be suitable for the graphical comparison of countries (Figure 4).
0,7 0,6
0,5 0,4
0,3 0,2
0,1 1,0 0,9 0,8 0,7 0,6 0,5 0,4
0,3
r2 (oil)
r2 (year)
IND CHN COL
KAZ
MEX
RUS BRA CAN
USA
NOR
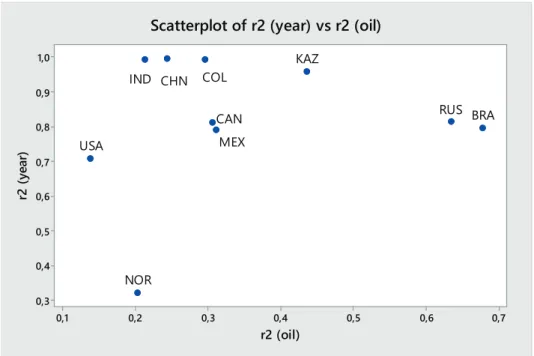
Scatterplot of r2 (year) vs r2 (oil)
Figure 4: An illustration of countries in Group A based on the yearly impact or the extent of dependence on the effect of the oil price change
Source: authors ‘own calculation
Figure 4 shows that oil exporting countries can be classified into three main groups according to their oil price change exposure. For NOR, USA, IND, and CHN, the evolution of GDP per capita does not depend statistically on the change in oil prices. It is interesting to note that this group included the richest (NOR) and the poorest (IND, CHN) countries. These countries show great differences in their response to the yearly impact. The more economically advanced a country, the less exposed it is to the impact of the economic environment (yearly effect). For MEX, CAN, COL, and KAZ in Group 2, the price of GDP per capita is statistically depen- dent on the oil price change. In Group 3 (RUS, BRA), there is a strong dependence on oil price change.
Conclusions
High GDP / capita countries (NOR, USA, CAN) were affected by the oil price fluc- tuation to a smaller extent while in the case of countries with lower GDP / capita two tendencies were observed.
The 4 countries with the lowest GDP / capita (IND, CHN, COL, MEX) show a positive linear correlation, which means that the dependence on oil prices is also slightly increasing with the GDP / capita growth.
Three countries with similar GDP / capita values show the strongest dependence on oil price change. While in the case of BRA and RUS the dependence is stronger (60-70%), for KAZ it is more moderate, as it hardly exceeds 40%.
Looking at the aggregate of the 10 countries, there is no statistically justifiable trend between the magnitude of GDP per capita and the decisive role of the oil price change. (R 2 = 15.89%)
References
[1] Aliyu, S. U. R (2009): Oil Price Shocks and the Macro economy of Nigeria:
A Non-linear Approach. MPRA Working Paper, Bayero University, Kano.
[2] Backus, D.- Crucini, M. (2000): “Oil Prices and the Terms of Trade” Journal of International Economics, 50, 185-213
[3] Bercement, C. (2009): The Impact of Oil Price Shock on the Economic Growth of MENA Countries. The Energy Journal, Vol. 31, No. 1.
[4] Finn, M. G. (2000): .Perfect Competition and the Effect of Energy Price Increase on Economic Activity. Journal of Money, Credit and Banking 32:
400 .416
[5] Granger W. J. (1969): Investigating Causal Relations by Econometric Mod- els and Cross Spectral Methods. Econometrica 36, 424-438.
[6] Federal Reserve Economic Data (2019): https://fred.stlouisfed.org/
[7] Hamilton, J. D. (1996a): This is What Happened to the Oil Price-Macro economy Relationship. Journal of Monetary Economics 38: 215 .220.
[8] Hamilton, J. D. (1996b): Analysis of the Transmission of Oil Price Shocks through the Macroeconomy. Paper presented at the DOE Conference, In- ternational Energy Security. Washington D.C.
[9] Hooker, M. A. (1996a): What Happened to the Oil Price Macroeconomics Relationship? .Journal of Monetary Economics 38: 195 .213.
[10] Hooker, M. A. (1996b): This is What Happened in the Oil Price Macroeco- nomics Relationship: Reply. Journal of Monetary Economics 38: 221 .222.
[11] Hooker, M. A. (1999): Oil and the Macroeconomy Revisited. Federal Re- serve Board, Washington, D. C.
[12] Mork, K. A. (1989): Oil and the Macroeconomy when Price Go Up and Down: An Extension of Hamilton.’s Results. Journal of Political Economy 97: 740 .744.
[13] Rotemberg, J.,Woodford (1996): Imperfect Competition and the Effect of Energy Price Increases on Economic Activity. Journal of Money, Credit and Banking 28: 549 .577
Authors:
Dr. Zoltán Szira, PhD associate professor
Institute of Economics, Law and Methodology Szent István University
szira.zoltan@gtk.szie.hu Hani Alghamdi
PhD student
Doctoral School of Business and Management Szent István University
alghamdi.hani84@gmail.com Dr. Erika Varga, PhD
associate professor
Institute of Social Sciences and Teacher Training Szent István University
varga.erika@gtk.szie.hu