23
SEPARATION OF MURINE MONONUCLEAR PHAGOCYTES BY VELOCITY SEDIMENTATION AT UNIT GRAVITY
Louis ΛΓ. Pelus Malcolm A. S. Moore
INTRODUCTION
The study of many problems in cell biology are often com- plicated by the fact that starting cell populations are com- plex, consisting of a variety of functionally different cells.
Physical separation into cell subpopulations retaining func- tional integrity would clearly provide a more specific means of pursuing cellular investigations. The fact that cell func- tion can often be associated with changes in cell size has led to the development and refinement of cell separation by veloci- ty sedimentation (1).
The principle of velocity sedimentation separation at unit gravity is based primarily upon the fact that, in a shallow gradient of low density, variations in terminal velocity result from differences in cell size. Using a continuous step gradient of 0.3 - 2.0% bovine serum albumin (BSA), in isotonic buffered saline, a gradient having an average density of 1.010 (1.0074 - 1.0113) gm/cm3 is formed (2). Since most mammalian cells have
METHODS FOR STUDYING Copyright © 1981 by Academic Press, Inc.
MONONUCLEAR PHAGOCYTES 2 0 7 All rights of reproduction in any form reserved.
ISBN 0-12-044220-5
a cell diameter of 5.0 to 20.0 ym and densities in the range of 1.05 to 1.10 gm/cm3, it becomes apparent that cell size will be the determining factor effecting terminal velocity and thus the separation. [A complete discussion of the theory involved in unit gravity velocity sedimentation can be found in (2).]
The technique of velocity sedimentation has been widely ap- plied in the field of hematology and more recently immunology.
It has been successfully used to separate and enrich for vari- ous hematopoietic stem cell populations (3-6) and to separate bone marrow monocytoid cells that stimulate myeloid colony for- mation from marrow myeloid colony-forming cells (6, 7). More recently, velocity sedimentation has been used to separate pop- ulations of elicited murine peritoneal cells differing in their cytotoxic capacity and ability to promote the in vitro antibody- forming response (8), and to separate resident mouse peritoneal mononuclear cells differing in their production of granulocyte- macrophage colony-stimulating factors (GM-CSF) (9, 10) and re- sponding to modulation by lactoferrin (10).
II. REAGENTS
Velocity sedimentation at unit gravity is performed using the Sta-Put cell separator, available from 0. H. John's Scien- tific, Toronto, Canada. The apparatus has three main parts, a sedimentation chamber [available in three sizes (11, 17, and 25 cm) to suit individual needs for small- to large-scale separation], an intermediate loading vessel, and a gradient maker. The procedure detailed herein will describe cell sepa- ration using the 25-cm sedimentation chamber having a fluid column capacity of 1200 ml and capable of separating a maximum of 300 x 10^ cells. [The major limitation to cell separation by velocity sedimentation is the phenomenon of streaming.
Beyond a critical cell concentration no separation can be ob- tained. The phenomenon of streaming and "streaming limit" is discussed elsewhere (2).]
Cell separation can be satisfactorily performed in gra- dients of fetal calf serum (FCS), BSA, Ficoll, or Percoll. We routinely use BSA as the gradient material (Cohn fraction V ) . In order not to create an appreciable tonicity gradient, lyo- philized BSA is prepared in isotonic phosphate-buffered saline
(PBS) (^320 mOsm for murine cells and ^280 mOsm for human cells). A stock solution of 10% BSA (w/v) in PBS is prepared, membrane sterilized, and stored either at 4°C or frozen until used.
Nonspecific cell sticking to glass, particularly the sedi- mentation chamber cone and intermediate vessel, can result in
IL SEPARATION FOR ENRICHMENT OR DEPLETION 209 cell loss and random contamination of cell fractions. In order to minimize cell sticking, especially when the separation in- volves mononuclear phagocytes, the sedimentation chamber and intermediate vessel are siliconized. Siliconization is per- formed by immersion in a 1% solution of Prosil-28 (PCR Research Chemicals, Inc., Gainesville, Florida), followed by thorough rinsing in distilled water. In addition, all chamber inter- connections should be made with silicone tubing (Silastic, Dow Corning).
Albumin solutions of 1% (600 m l ) , 2% (600 m l ) , 0.2% (50 m l ) , and 0.3% (50 ml) should be prepared in isotonic PBS by dilution from the 10% stock BSA solution. All solutions should be stored at 4°C until used.
Isolation of resident murine peritoneal cells are obtained by peritoneal lavage with cold McCoy's modified 5A medium con- taining antibiotics, 2% FCS, and 2 U/ml preservative-free hepa- rin. Other methods for mononuclear phagocyte cell isolation can be found elsewhere in this volume.
III. PROCEDURES
The separation procedure is presented in detail below.
(1) Locate and level the Sta-Put apparatus within a 4°C cold room (to reduce the metabolic activity of the cells) in an area free from mechanical vibration and jarring.
(2) Prior to use, the sedimentation chamber, intermediate vessel, and gradient makers should be washed, the appropriate parts siliconized as described, and completely connected. The assembled apparatus consists of the sedimentation chamber with steel baffle, connected by means of a three-way valve and tub- ing to the intermediate vessel (with spin-bar), which in turn is connected to the two large gradient chambers [left column A
(with spin-bar) and right chamber B ] . Tubing clamps are lo- cated between the three-way valve and intermediate vessel, in- termediate vessel and gradient chamber A, and on either side of chamber B. The assembled apparatus is then appropriately
wrapped, steam or gas sterilized (if necessary), and placed onto the Sta-Put cabinet. For sterilization, the sedimentation chamber is disconnected and sterilized apart from the rest of the apparatus.
(3) It is imperative, that the stainless steel flow baffle be carefully centered inside the cone of the sedimentation chamber. This baffle is used to deflect incoming fluid during loading, and is necessary to avoid gradient mixing. With prac- tice, the baffle can be easily positioned using a sterile pi- pette or glass rod.
(4) Load 50 ml of PBS into the sedimentation chamber through the intermediate vessel, making sure that all tubing on the sedimentation chamber side of the intermediate vessel is filled with PBS and free of air bubbles. Reclamp tubing before the loading vessel empties. This fluid layer functions to prevent disturbance of the cell band by air currents and the rising fluid column.
(5) Clamp the lines between the loading vessel and the gradient chambers. Load 600 m l of 1.0% BSA in the left cham- ber and 600 ml of 2.0% BSA in the right chamber. Unclamp the lines slightly in order to fill the connecting tubing, making sure no air bubbles remain in the lines, and reclamp. At this point, the velocity sedimentation chamber is ready for the in- troduction of the cell population. As stated earlier, this chamber can accommodate a maximum of 300 x 10 total cells.
However, depending upon the number of cells required for func- tional analysis, the starting cell population can often be manipulated to enrich for particular cells, before loading into the chamber, provided that those cells so removed have no ac- cessory function. When separating resident or elicited murine peritoneal cells, we have found it advantageous to remove con- taminating red blood cells. This is performed by pelleting the cells and resuspending in 5.0 ml of 0.174 M NH4CI on ice for 5 min. A layer of 5.0 ml of fetal calf serum is then introduced under the suspension, and viable nucleated cells are recovered by centrifugation through the serum cushion. For human periph- eral blood or bone marrow cell separation, neutral density cen- trifugation through BSA at 1.070 g m / c m3 or Ficoll, 1.077 gm/cm3, has proved useful for mononuclear cell enrichment provided that granulocytes are not required. Cell suspensions are adjusted to a concentration of 300 x 1 06 cells in 40 ml of isotonic P B S . An appropriate number of cells should be set aside at this point to serve as an unseparated control.
(6) Load the cells through the intermediate vessel and re- clamp the line as soon as the chamber is near empty. A flow rate of 10 ml/min is adequate. Passage of the cell suspension through a 22-gauge spinal needle under slight positive pressure during loading will break up small cell aggregates and cell doublets and will ensure a uniform single cell suspension.
(7) Rinse the intermediate vessel twice with 25 ml of 0.2%
BSA in PBS (50 ml total) using a syringe and spinal needle.
Make certain that no air bubbles are introduced. Adjust the flow rate to approximately 2 - 3 ml/min.
(8) Fill the intermediate vessel with 0.3% BSA in PBS to the height of the fluid column in the gradient chambers and start the magnetic stirrers (avoid f o a m i n g ) . The time elapsed between introducing the cells and starting the gradient should be less than 10 m i n .
(9) Remove all clamps and record the time ( t ^ ) . Once the
IL SEPARATION FOR ENRICHMENT OR DEPLETION 211 cells have been lifted off the bottom of the sedimentation cone, the flow rate can be continuously increased. Loading should be as rapid as possible (30 min) without disturbing the cell band.
(10) Record the time the fluid column reaches the top of the sedimentation cone (t2)· From this point on, the gradient can be left to load itself.
(11) After an appropriate sedimentation time (usually 3.5 to 4 hr), the chamber is unloaded through the three-way valve, at a flow rate of 35 to 40 ml/min. Record time it 3] when un- loading is started. The first 250 ml is the cone volume and is discarded.
(12) Collect the remainder of the gradient in equal 35-ml fractions. We have found that conical graduated Falcon centri- fuge tubes (No. 2070, Falcon Plastics, Division of Becton Dick- inson and Co., Oxnard, California) particularly useful for both quantitation of fraction volume and estimation of flow rate.
Record the time the collection of the first fraction is started (t4) and the last fraction is finished ^ 5 ) , as well as the number (Nf) and volume (vf) of the final fraction.
(13) All individual cell fractions should be kept on ice to prevent cell aggregation. Wash each fraction three times in cold media containing 2% FCS and finally resuspend in 5 ml of complete media containing 15% FCS.
(14) Determine the cell concentration and viability in each fraction. We routinely use vital dye exclusion and counting by hemacytometer; however, electronic cell counting can be used.
In our hands, cell recoveries of 85 - 95% and with greater than 95% viability are routinely obtained.
(15) Adjust all fractions to uniform cell concentration de- pending upon the individual assay procedure to be employed. We have found a cell density of 106/ml to be a suitable starting concentration for most procedures. However, to obtain this concentration, it is often necessary to pool fractions, particu- larly in the most rapid and slow sedimentation cell fractions.
In pooling fractions, no more than three consecutive fractions, corresponding to approximately a 1 mm/hr sedimentation rate dif- ference (see Section IV), should be combined.
IV. CALCULATION OF DATA
A. Calculation of Sedimentation Velocity
Populations of separated cells can be best characterized by their sedimentation velocity (s) in millimeters per hour, re- lated to a standard set of conditions, which for this procedure
have been adopted as 4°C and a gradient with an average density of approximately 1.010 gm/cm^. Under these conditions, absolute s values are accurate within 5% (2) .
The calculation of sedimentation velocity is performed using a mathematical equation, determined by Miller and Phillips (2), which describes the distance the cells have fallen through the gradient. The sedimentation velocity in millimeters per hour for fraction N is given by
(N-N-h)v- (Vn+hV -v.) , . _ f 0 cb f
S{ 0t[(t4-t1) - 0.4 (t4+t2-t3-t1) + N(t5-t4)/Nf] where the times (t-, through t in hours) are the times at which
loading was started (t^), the cells reached the top of the sedi- mentation chamber cone (t2), draining was started (Ù3), the
first fraction was collected (t^), and completion of the un- loading procedure (t^). The chamber constant (a) or milliliters per millimeter of length in the cylindrical portion of the cham- ber is given as a = 22.5 for the 25-cm chamber, ii is the frac- tion number you are calculating an s value for, v the volume of fraction N, and Nf and vf describe the final fraction number and volume, respectively. The volume of fluid above the cell band is given by VQ (50 ml of PBS) and the volume of the cell band by ^Cb (40 ml)·
B. Expression of Data
The biophysical properties of the given cell populations are adequately expressed as their sedimentations velocities.
However, this expression is only meaningful when used in combi- nation with a description of the functions and/or properties of a given cell population. This leads us to consider how one ex- presses the functional data concerning each cell fraction in a manner that best describes cellular enrichment, functional ac- tivity, and relation to control cells, as well as in a form that allows individual assays to be compared.
Individual cell fractions contain widely varying cell num- bers, expecially when starting with a mixed cell population (see Fig. 1). Therefore, one must express data as a function of cells. For those cell populations in which one cannot directly identify each cell possessing the measurable property, this can be quantitated in either of two ways. Data can be expressed as a function of a standard number of cells from each fraction.
Thus when plotted, all data will be expressed as activity per unit number of cells with a particular sedimentation velocity.
This method of data expression is best used for generating an enrichment profile, or detecting maximal activity in circum- stances in which even after cell separation, the active cells represent a minor component of the total fraction cell number.
II. SEPARATION FOR ENRICHMENT OR DEPLETION 213
SEDIMENTATION VELOCITY I ' I 10 11 Ί
12
(A)
3
O U J
Ceo
of
Ü w D 100
80 6 0 h 40h 20 /
' ί "Hi
>♦>.
P ' I ■ I ' I ' I ' I ' I ' I M ' I ' M Î"
(B)
100 80 60 40 20 0
_
—
\ / D / GN
\ /\ D / MONOCYTE \D MACROPHAGE / N
\ '
/'i*—LYMPHOCYTE
/ \ BASOPHIL^^ ^
' \ EOSINOPHIL
/ 0 / / o
1 ' 1 ' I ' 1 ' 1 ' 1 ' 1 ' 1 ' 1 ' 1 ' 1 ' 1
h
! »
ü
1 2 3 4 5 6 7 8 9 10 11 12 UNSEPARATED ( mm/hr)
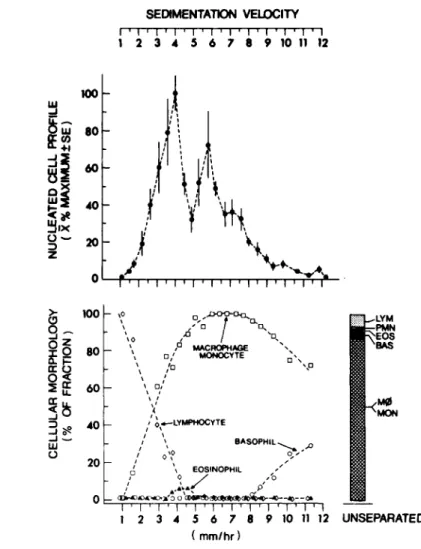
Fig. 1. (Ά) Total nucleated cell profile of velocity sedimentation separated BDFlf resident nucleated peritoneal cells. Data are normalized^ to the maximal cell containing fraction and expressed as X ± S.E.M. for four experiments.
(B) Total nucleated cell profile and morphological evaluation of separated cells in a representative experiment. Morphology was determined by oil microscopy (*960) on a minimum of 300
cells from each of duplicate Wright stained cyto centrifuge slide preparations.
The second method of data expression compares individual frac- tions of cells. In this method, functional activity again is based upon assay of a standard number of cells, however, it is corrected to represent total cells within the fraction. Criti- cal to this method, is the necessity of measuring cellular ac-
tivity on the linear portion of the dose - response curve.
After correction, the data can be normalized by assigning an activity of 100% to that cell fraction having maximal activity, and expressing each fraction as a percent of maximum. This normalization is performed by dividing the activity of each fraction by the maximum activity. When plotted, the resulting profile allows one at a glance to determine where maximal ac- tivity lies and to assess the relative contribution of all cell fractions. The major advantage of this method lies in the ability to compare directly individual assays.
In reporting data on morphology, phagocytosis, or any cell function where one can directly quantitate the number of cells which possess a particular property, the results should be ex- pressed as the percentage of cells positive for the given characteristic as a function of sedimentation velocity.
V. CRITICAL COMMENTS
Velocity sedimentation is not a preparative cell isolation procedure, but rather is analytical in nature, designed to compare and contrast populations of cells differing in size.
We have found this technique to be highly reproducible when ap- plied to the study of the mononuclear phagocytic cell lineage and to resolve effectively monocytoid cell populations with differential characteristics and functions.
In four separate experiments, two major populations of nu- cleated cells could be separated (Fig. 1A). The maximal re- coverable cell population characteristically sedimented with a modal velocity of 4.0 mm/hr and consisted primarily of small monocytes and less differentiated monocytoid cells, with some lymphocyte contamination (Fig. IB). Relatively pure popula- tions of lymphoid cells were found in the sedimentation range of 1.0 - 3.0 mm/hr with 30 - 45% of these cells sensitive to monoclonal anti-Thy 1.2 antibody plus complement treatment.
The second major population of cells sedimented with a modal velocity of 5.8 mm/hr and corresponded to relatively pure populations of monocytes and macrophages sedimenting in the range of 5.0 - 8.0 mm/hr. Cell fractions with a sedimen- tation velocity greater than 9.0 mm/hr contained less than 3%
of the total recoverable cells and were comprised of large well-differentiated macrophages with increasing numbers of basophils and mast cells.
Biophysical cell separation does not "a priori" guarantee a separation of cell function. It is up to the investigator carefully to define and compare isolated cell fractions using a variety of assays characteristic of or specific for the range of cell populations that might be present. Only in this way can subpopulations of cells or cells at different stages of differentiation be identified.
II. SEPARATION FOR ENRICHMENT OR DEPLETION 215
TABLE I. Characterization of Mononuclear Cell Populations Recovered
cells Nonspecific (range, Phagocytosis Fc receptor esterase
Sedimentation velocity 11.0 - 10.0 - 9.0 - 8.0 - 7.0 - 6.0 - 5.0 - 4.0 - 3.0 - 2.0 - 1.0 -
12.0 11.0 10.0 9.0 8.0 7.0 6.0 5.0 4.0 3.0 2.0 Unseparated
4 Expts) (%) 0.1 0.1 0.8 3 6 10 17 10 18 8 0.2
- - - - - - - - - - - -
0o5 0.6 2 7 9 19 23 24 31 10 1.5
(% positive per fraction)
67 73 74 84 93 88 68 25 6 2 0 51
(% positive per fraction)
89 87 81 72 58 59 73 82 61 32 10 71
per pos.
fr<
69 77 82 95 98 99 96 87 67 28 18 80
Adherence (% per fraction
96 96 97 94 94 87 77 54 17 0 0
Lysozyme (ng/ml/105
cells) 47 10 34 51 37 53 30
<10
<10
<10
<10
N-Acetyl-&- D-glucosa- minidase
(nM/hr/106 cells)
1522 1637 1368 328 568 673 321 200 96 72 107
Ectoenzyme 5'-nucleo-
tidase (nM/min/106
cells) 167 193 200 227 234 223 113 30 15 31 47
Neutral pro-
tease activity (% fibrinolusis/
2.5 x 1 05 cells)
1 2 2 2 2 2 3 13 20 3 0 58 12 900 127
II. SEPARATION FOR ENRICHMENT OR DEPLETION 217 TABLE II.
lationsa
Sedimentat ion velocity
11.0 - 10.0 - 9.0 - 8.0 - 7.0 - 6.0 - 5.0 - 4.0 - 3.0 - 2.0 - 1.0 -
12.0 11.0 10.0 9.0 8.0 7.0 6.0 5.0 4.0 3.0 2.0
Cytotoxic Activity of Mononuclear C
Natural cytotoxicity
(NC) - - - - - - - -
-/--f
++
++
Natural killer
(NK) - - - - - - - ++
++
+ -
ADCC ++
++
++
++
+ ++
++
- - - -
ell Popu-
Spontaneous killing
++
++
++
+ ++
+ ++
+ - - -
++, Enrichment, significantly greater than unseparated cells; +, equivalent to unseparated cells; -, 0, or signifi- cantly lower than unseparated cells0
Separated resident murine peritoneal cells have been evalu- ated using a number of functional assays characteristic for the monocytoid cell lineage (Tables I and II). Although the sedi- mentation range for maximal activity varied with the particular function assayed, expression of properties characteristic of monocytoid cells were found in cells in a broad sedimentation
range of 4.0 - 12.0 mm/hr, with elevated functional monocytoid expression observed with increasing cell size. Thus, cells in the sedimentation range of 6.0 - 12.0 mm/hr were highly ad- herent, phagocytic, Fc receptor positive cells, which stained intensely for cytoplasmic nonspecific esterase activity and negative for peroxidase (not shown). Moreover, high lysozyme, acid hydrolase, and membrane ectoenzyme activity and low neutral proteolytic capacity was observed (Table I). Antibody-dependent cellular cytotoxicity (ADCC) and nonspecific spontaneous tumor target cytotoxicity could be demonstrated throughout this range
(Table II). In all cases, significant enrichment of activity in comparison to unseparated cells was evident.
In the 4.0 - 6.0 mm/hr sedimentation range, more variability or heterogeneity in functional activity was observed. Most cells in this range possessed Fc receptors and stained positive- ly but diffusely for nonspecific esterases, however they were less adherent, and with reduced phagocytic capacity, low lyso- zyme and acid hydrolase activity, and lower overall ADCC and spontaneous cytotoxicity in comparison to the more rapidly
sedimenting fractions. Morphologically, the major proportion of these cells appeared to be early members of the monocytoid cell lineage, having a high nuclear-to-cytoplasmic ration, highly lobulated nucleus, and lacy chromatin pattern. Further- more, these cells were non-T, non-B by appropriate antibody plus complement treatment. The high neutral proteolytic and low ectoenzyme activities of these cells further support a monocytoid origin at an early stage of differentiation. More- over, both populations of cells have the capacity to produce constitutively granulocyte-macrophage colony-stimulating fac- tor (GM-CSF) required for myeloid stem cell proliferation;
however only GM-CSF production by those cells in the 5.0 - 8.0 mm/hr sedimentation range can be regulated by lactoferrin, a PMN-derived inhibitor of macrophage GM-CSF production (10).
The ability of lactoferrin to inhibit GM-CSF is dependent on specific cell surface receptors that are not expressed on the more slowly sedimenting GM-CSF producing cells and perhaps be- come expressed with differentiations. It appears that like the bone marrow myeloid stem cell (CFU-GM), which acquires the responsiveness to growth promotion by GM-CSF before becoming sensitive to growth inhibitions (11), so too, the monocytoid cell acquires the ability to produce GM-CSF before entering a stage of responsiveness to regulation.
A central and yet unresolved question concerning the mono- cytoid cell lineage is that of heterogeneous cell populations.
The Unitarian concept would argue that the cells pass through different stages of differentiation and that each function be- comes more or less prominent at each stage. An alternate view recognizes functionally distinct and specialized macrophage subsets, not necessarily related in a differentiation sequence.
Although the concept of discrete subpopulations of monocytoid cells cannot be excluded by the data presented, the observed characteristics, at least for resident murine peritoneal mono- cytoid cells separated by velocity sedimentation, indicate an apparent continuum of monocytoid differentiation associated with increasing cell size. A definitive resolution to macro- phage heterogeneity will require a combination of cell sepa- ratory procedures such as velocity sedimentation plus continu- ous or discontinuous density gradient centrifugation, as well as the comparative study of monocytoid cells inhabiting dis- crete anatomical locations, and the study of committed bone marrow stem cells.
Acknowledgments
Supported by Grants CA 28512 and CA 19052 from the National Cancer Institute, DHEW, and the Gar Reichman Foundation. The authors wish to thank Drs. J. Hamilton and P. Ralph of this de-
IL SEPARATION FOR ENRICHMENT OR DEPLETION 219 partment for analysis of neutral proteolytic activity and ly- sozyme, respectively, and Dr· Bonney of the Merck Institute for Therapeutic Research, Rahway, New Jersey for measuring acid hydrolase activity.
LMP is a Special Fellow of the Leukemia Society of America, Inc·
REFERENCES
R. G. Miller and R. A. Phillips. Separation of cells by velocity sedimentation. J. Cell Physiol. 73: 191-198, 1969.
R. G. Miller. Separation of cells by velocity sedimenta- tion. In "New Techniques in Biophysics and Cell Biology"
(R. H. Pain and B. J. Smith, eds.), pp. 87-112. Wiley, London, 1973.
D. J. A. Sutherland, J. E. Till, and E. A. McCulloch.
Short term cultures of mouse marrow cells separated by velocity sedimentation. Cell Tissue Kinet. 4: 479-490, 1971.
R. G. Worton, E. A. McCulloch, and J. E. Till. Physical separation of hematopoietic stem cells from cells forming colonies in culture. J. Cell Physiol. 74: 171-182, 1969.
N. Jacobsen, H. E. Broxmeyer, E. Crossbard, and M. A. S.
Moore. Colony-forming units in diffusion chambers
(CFU-D) and colony-forming units in agar culture (CFU-C) obtained from normal human bone marrow: A possible parent-progeny relationship. Cell Tissue Kinet0 12:
213-226, 1979.
N. Williams and R. R. Eger. Purification and characteri- zation of granulocyte-macrophage precursor cell popula- tions. In "Hematopoietic Cell Differentiation" (D. W.
Golden, M. Cline, D. Metcalf, and C. F. Fox, eds.), pp.
385-398. Academic Press, New York, 19780
N. Williams and M. A. S. Moore. Sedimentation velocity characterization of the cell cycle of granulocyte progeni- tor cells in monkey hemopoietic tissue. J. Cell Physiol.
82: 81-92, 1973.
K. C. Lee and D. Berry. Functional heterogeneity in macrophages activated by Corynebacterium parvum: Charac- terization of subpopulations with different activities in promoting immune responses and suppressing tumor cell growth. J. Immunol. 118: 1530-1540, 1977.
J. I. Kurland, L. M. Pelus, P. Ralph, R. S. Bockman, and M. A. S. Moore. Induction of prostaglandin E synthesis in normal and neoplastic macrophages : Role for colony-
stimulating factor(s) distinct from effects on myeloid progenitor cell proliferation. Proc. Nat. Acad. Sei.
USA 76: 2326-2330, 1979.
10. L. M. Pelus, H. E. Broxmeyer, M. deSousa, and M. A. S.
Moore. Heterogeneity among resident murine peritoned macrophages: Separation and functional characterization of monocytoid cells producing granulocyte-macrophage colony stimulating factor (GM-CSF), and responding to regulation by lactoferrin. J. Immunol. 126: 1016-1021, 1981.
11. L. M. Pelus, H. E. Broxmeyer, and M. A. S. Moore. Regu- lation of human myelopoiesis by prostanglandin E and lactoferrin. Cell Tissue Kinet., in press.