DOCTORAL (PhD) THESES
TAMÁS TRENYIK
KAPOSVÁRI UNIVERSITY FACULTY OF ECONOMIC SCIENCE
2019
Click to BUY NOW!
.tracker-software.c Click to BUY NOW!
.tracker-software.c
Click to BUY NOW!
.tracker-software.c Click to BUY NOW!
.tracker-software.c
KAPOSVÁR UNIVERSITY
FACULTY OF ECONOMIC SCIENCE
Doctoral School for Management and Organizational Sciences
Head of Doctoral School:
PROF. DR. IMRE FERTŐ Doctor of Sciences
Supervisor:
DR. HABIL. BÉLA CSUKÁS Candidate of Sciences
PROCESS MODEL BASED EVALUATION
OF POSSIBLE COLLECTION AND SELECTION SCHEMES OF MUNICIPAL SOLID WASTE
Written by:
TAMÁS TRENYIK
KAPOSVÁR 2019
DOI: 10.17166/KE2020.002
Click to BUY NOW!
.tracker-software.c Click to BUY NOW!
.tracker-software.c
Click to BUY NOW!
.tracker-software.c Click to BUY NOW!
.tracker-software.c
3
1. Background and objectives
Modern society uses a significant amount of material resources to maintain the standard of living, while generating large amounts of waste. In order to maintain a resource-limited global ecosystem, to conserve natural resources and to prevent their pollution, the conscious waste management is becoming increasingly important.
Issues, previously addressed at state level must now be resolved within the European Union system of uniform objectives. A 2008 directive (EC, 2008) defined the objectives to be achieved. After several years of review, legislation on the circular economy was adopted in 2018.
The current Hungarian regulations are contained in the Waste Act (Act CLXXXV of 2012 on Waste, 2012). An essential element of the current provisions is that 50% of the recoverable components of municipal waste is to be prepared for re-use or for recycle. The Circular Economy Package rules double this rate by 2025 (requiring 50% recycling of municipal waste).
Separate collection of the relevant fractions has been realizing in Hungary for years, but the results achieved so far have fallen short.
A significant change took place in 2015, as selective collection became mandatory in all settlements, and door-to-door separate collection became the primary method of collection. Door-to-door collection has produced good results in terms of quantities collected, but it is also evident that its effectiveness (e.g. vehicle utilization, specific cost, etc.) is not always adequate in every settlement structure.
Environmental awareness and economic results have competed with each other over the past few years. Since the introduction of the public waste management service coordination at national level in 2016, financing issues have been raised by NHKV Zrt centrally and cumulatively.
It is of utmost importance to satisfy the selective collection goals, but the different options for collection methods need to be examined also from the financial point of view. Accordingly, we must study the currently less used (or not applicable) alternative models beyond door-to-door collection methods to
Click to BUY NOW!
.tracker-software.c Click to BUY NOW!
.tracker-software.c
4
gain a complete overview of all the possibilities. Present work focused on the systematization and analysis of alternatives for the municipal waste collection and pre-treatment.
Based on a review of the literature, it became evident that numerous case- specific documents and studies were made about the organization of collection and pre-treatment. There is general agreement on the basic building blocks of the system and of their applicability (e.g. home collection vs. collection point).
Several articles examine specific collection systems, comparing their performance.
However, there is a lack of a systematic process model, based on an engineering approach that provides a systematic overview and evaluation of possible solutions under different conditions.
With this in mind, my goals in this work were:
Definition of the amount and composition of municipal waste generated in a typical "sample settlement";
Systematic review of rationally conceivable residential, local, micro- regional, and central separation schemes, as well as their possible transport connections, comprising disposal and recovery of material streams resulting from the process;
Implementation of a dynamic simulation model for possible collection and separation schemes to calculate the potential waste streams and compositions, using Programmable Structures (with the the research team, developing the method);
Determination the typical data and calculation formulae, needed to the simplified annual cost calculation of possible solutions;
Detailed simulation of some examples;
Generation of a complete set of solutions from the possible building blocks to calculate alternatives for the collection and treatment of a typical waste (using Programmable Structures with the research team, developing the method);
Experimental test of automatic simulation and simplified cost estimation for large number of solutions.
Click to BUY NOW!
.tracker-software.c Click to BUY NOW!
.tracker-software.c
5
2. Material and method
The field of waste management is covered by a wealth of legislation. Studying this is an important basis for the work. The ideas found in the literature are well suited for solving some sub-problems. In addition, the structured information from my own practical experiences represented a significant part of the input data.
The data about the national averages from the Central Statistical Office have not proved usable for the determination of the amount of municipal waste, generated in rural areas.
The South Transdanubian region produces 200-240 kg / person / year waste.
Knowledge of the composition of waste is essential to organize collection and to determine the amounts that can be collected selectively.
First, the waste fractions were determined. However, the starting tables, based on the waste analysis standard and based on the waste flows from the strategy papers are not compatible with each other. In addition, any them does not give complete and disjunct equivalency classifications.
Finally, I determined the regular composition of public service waste from these inconsistent lists. The fractions, which are not regularly collected, and the amount generated in waste yards were not part of the model.
The weight ratios of waste fractions, being in the focus of this research, were also not used from the data of the Central Statistical Office, rather from the results of the 2006 Faitli waste analysis.
The result is a closer approximation of the actual composition and international data due to the smaller sieve size used (mainly the biodegradable fraction is relevant in this respect).
It is also necessary to determine the density of each waste fraction, because transport capacities can be quantified from these data. Densities were determined partly from the literature and partly from the engineering experiences.
To determine the length of the collection routes of the model area, I used the data for the number of the houses and their inner distances within the
Click to BUY NOW!
.tracker-software.c Click to BUY NOW!
.tracker-software.c
6
settlement from the database of the Central Statistical Office, using several correction steps.
On the basis of the literature review and partly from my own data, I defined the property related collection schemes, the primary and secondary means of transport, as well as the local and central separation processes.
The other basic data of waste management planning are the costs of the activities. The specific costs of selection and transportation element were collected for the model. The prices and costs of the terminal (final output) elements were also estimated. No cost was applied for the storage elements.
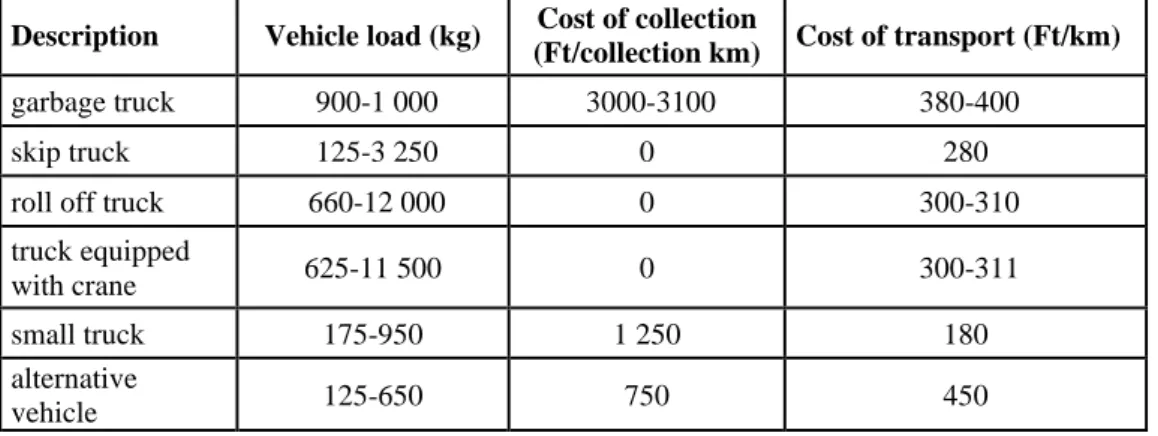
The aim of the dissertation is to find the most cost-effective ways of collection for a given amount of waste, applying various selection scenarios. Therefore, I performed a cost analysis of the waste management systems.
The estimated cost factors are shown in Tables 1-4.
Table 1 – Costs of treatment (summary)
Description cost (Ft/kg)
household 0
mechanical treatment, sorting-balling 3-30
local repacking 4-5
local sorting 8-23
composting 3
Table 2 - Costs of collection I. (summary)
Description Vehicle load (kg) Cost of collection
(Ft/collection km) Cost of transport (Ft/km)
garbage truck 900-1 000 3000-3100 380-400
skip truck 125-3 250 0 280
roll off truck 660-12 000 0 300-310
truck equipped
with crane 625-11 500 0 300-311
small truck 175-950 1 250 180
alternative
vehicle 125-650 750 450
Click to BUY NOW!
.tracker-software.c Click to BUY NOW!
.tracker-software.c
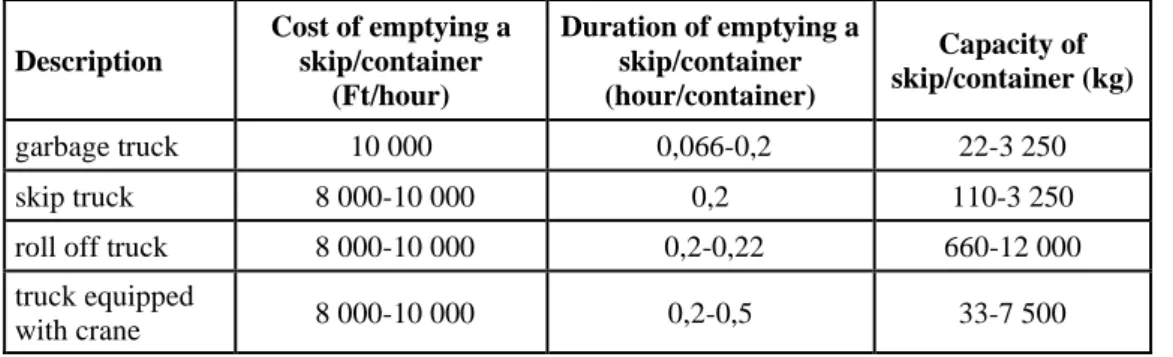
7 Table 3 - Costs of collection II. (summary)
Description
Cost of emptying a skip/container
(Ft/hour)
Duration of emptying a skip/container (hour/container)
Capacity of skip/container (kg)
garbage truck 10 000 0,066-0,2 22-3 250
skip truck 8 000-10 000 0,2 110-3 250
roll off truck 8 000-10 000 0,2-0,22 660-12 000
truck equipped
with crane 8 000-10 000 0,2-0,5 33-7 500
Table 4 - Costs of terminal elements
Description Cost (Ft/kg) ferrous metal -6
disposal 12
RDF -1
paper -20
cardboard -33
tetrapaks -6
PET -60
PE -50
other plastics -15 non-ferrous metal -300
glass -2
Click to BUY NOW!
.tracker-software.c Click to BUY NOW!
.tracker-software.c
8
In my dissertation, in collaboration with the research team, we used the method of Programmable Structures to generate the process model for possible waste collection and processing methods, as well as to evaluate the solutions, based on dynamic simulation.
This method provides a general framework for automatically generation and execution of complex process models. The model generation starts from the declaration of process network and from the GraphML definition of two generally used functional elements.
The generated model contains a systematic description of initial separations, collections, transportations, pre-treatments, end product utilizations and deposition.
Generation and implementation of the model is supported by a general kernel program written in declarative language (PROLOG).
Click to BUY NOW!
.tracker-software.c Click to BUY NOW!
.tracker-software.c
9
3. Results and discussion
3.1 Determination of municipal waste of the modelled settlement
The modelled typical settlement has 10,000 properties. According to the settlement statistics of Central Statistical Office, an average of 2.635 people lives in a property in the rural area. In the model, the annual waste production per person was estimated to be 231 kg / person / year. Table 5 summarizes this basic data.
Table 5 – Values of waste production of the sample area
number of households (pc) 10 000
person/household 2,635
waste production (kg/person/year) 231 waste production (kg/household/week) 11,715
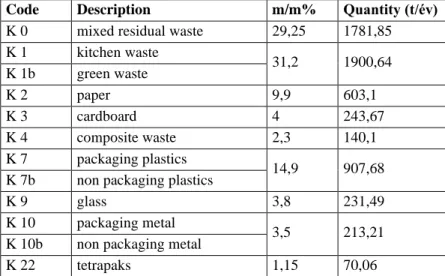
The modelled municipality's annual waste production is 6 091.8 tonnes.
The waste composition, applied in the model, is summarized in Table 6. The theoretical maximum of recyclable materials is 70.75%, including 31.2% is bio-waste.
Table 6 – Waste composition and quantity of waste fractions in the model area
Code Description m/m% Quantity (t/év)
K 0 mixed residual waste 29,25 1781,85 K 1 kitchen waste
31,2 1900,64 K 1b green waste
K 2 paper 9,9 603,1
K 3 cardboard 4 243,67
K 4 composite waste 2,3 140,1
K 7 packaging plastics
14,9 907,68 K 7b non packaging plastics
K 9 glass 3,8 231,49
K 10 packaging metal
3,5 213,21
K 10b non packaging metal
K 22 tetrapaks 1,15 70,06
The starting point for any municipal waste collection is the household or other real estate, where the waste is generated in a given amount and composition.
This is represented by an initial transition in the model. This determines, how
Click to BUY NOW!
.tracker-software.c Click to BUY NOW!
.tracker-software.c
10
does the typical household transfer the waste to the public domain, with or without selection. through the public service provider. Table 7 summarizes the basic groups of basic schemes.
Table 7 – Possibilities of waste collection for households
Scheme Description
S 101 - S 166 single bin system at household, recyclables at collection points
S 201 - S 220 variations of two bin at household system (dry-wet schemes)
S 301 - S 320 three bins at household (mixed + paper + plastics)
3.2 Transport of waste
The waste transports (transition elements) between the places (state elements) are carried out by different vehicles and in different containers.
The transition elements of the model represent those elementary processes, where the materials are transported or separated from one state element to subsequent state elements, while the waste may be transformed through some modification. Typically, transitions include collection activities, shipments by programmed vehicles, as well as selection and other handling procedures.
The main groups of transport elements are shown in Table 8.
Table 8 – Transport elements in the model
Number Description Transition group 2 47 garbage truck Transition group 3 28 skip truck Transition group 4 28 roll off truck Transition group 5 25 truck with crane Transition group 6 15 small truck Transition group 7 12 alternative vehicle
In the process model, waste moves from storage to storage through optional separations. The initial separation is the real estate where the waste is generated, next in some schemes, it is passed to one of the possible separation steps.
Click to BUY NOW!
.tracker-software.c Click to BUY NOW!
.tracker-software.c
11
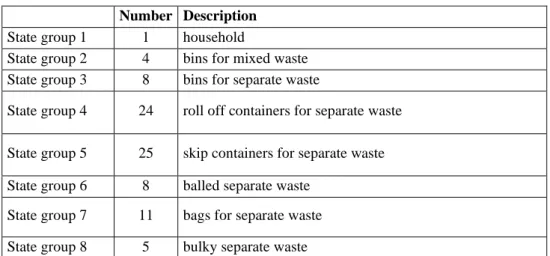
The state elements are typically containers, pre-treatment facilities, as well as waste storage in bales and in bulk. Table 9 shows the groups of modelled state elements of storage type.
Table 9 – Storage type state elements used in model
Number Description State group 1 1 household
State group 2 4 bins for mixed waste State group 3 8 bins for separate waste
State group 4 24 roll off containers for separate waste
State group 5 25 skip containers for separate waste State group 6 8 balled separate waste
State group 7 11 bags for separate waste State group 8 5 bulky separate waste
Different types of waste are transported by the same means of transport (e.g.
compacting vehicle) with different maximum weights (see Table 10).
Table 10 – Examples of load capacity of vehicles regarding to waste type
Type of waste Vehicle (20 m3) Bin Destination Capacity mixed waste garbage truck bin 60-1100 l mechanical treatment 10000 kg mixed waste garbage truck bag mechanical treatment 10000 kg mixed waste garbage truck 5 m3 skip cont. mechanical treatment 8000 kg mixed separate garbage truck bin 60-1100 l many destination 4500 kg paper garbage truck bin 60-1100 l many destination 5500 kg plastics garbage truck bin 60-1100 l many destination 1200 kg
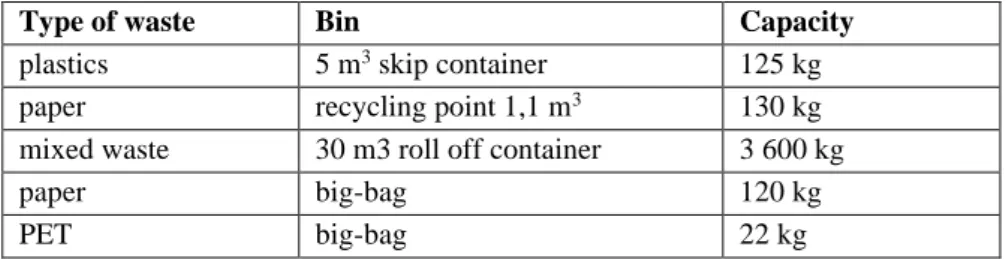
It is also important to determine the maximum amount of waste that can be placed in the possible containers. This amount is influenced by two factors: the density of the waste and the size of the container. Examples are shown in Table 11.
Click to BUY NOW!
.tracker-software.c Click to BUY NOW!
.tracker-software.c
12
Table 11 – Examples of weight capacity of bins regarding to waste type
Type of waste Bin Capacity
plastics 5 m3 skip container 125 kg
paper recycling point 1,1 m3 130 kg
mixed waste 30 m3 roll off container 3 600 kg
paper big-bag 120 kg
PET big-bag 22 kg
3.2.1 Collection frequencies
For the primary collection (regulated by law, local regulation, or public service contract), the collection frequencies are shown in Table 12.
Table 12 – Collection frequencies from primary locations
Type of waste Frequency
mixed waste weekly
biowaste 1 (kitchen waste) weekly biowaste 2 (kitchen + garden) weekly
garden waste fortnightly
other separate waste fortnightly
From the secondary sites (collection points, pre-treatment sites) the waste is transported in the knowledge of the waste amount and of the capacity of the containers.
3.2.2 The distance of the modelled settlement from the waste treatment centre
The distance from the treatment centre significantly influences the selection amongst the cost-effective collection methods in the given scenarios.
Therefore, simulations with different distance values are required. The values, applied in the first approximation were the followings:
• 10 km: it is based on the fact that complex treatment plants are usually built near to a big city;
• 50 km: the National Waste Management Public Service Plan considers collection areas with a maximum distance of 50 km, as the upper limit for one-step collection.
Click to BUY NOW!
.tracker-software.c Click to BUY NOW!
.tracker-software.c
13
3.2.3 Specification of the collection path length for door-to-door collection
It is common practice for collection routes to empty trash cans on both sides of smaller, narrower streets in a single pass. On highway lanes with more traffic, collection is done on one side to avoid accidents. Considering this, the collection route length was determined using the following principle: 80% of municipal roads and 20% of state roads are collected on both sides, while 20%
of those that maintained by municipalities and 80% of those that managed by the state, are collected with single-sided emptying.
This calculated "corrected distance" was increased by 15% because of multiple passages (within the settlement).
Table 13 shows the default values of Somogy County, calculated from the settlement database of the Hungarian Central Statistical Office.
Table 13 – Calculation of length of collection routes
Corrected distance (Somogy County <excluding Kaposvár and Siófok>): 3 500,9 km No. of households (Somogy County <excluding Kaposvár and Siófok >): 115 946 pcs
Accordingly, the calculated value is 33.1 properties / km. Based on this value, the distance, needed to collect 10,000 properties in the sample area is 302 kilometres.
3.2.4 Determination of the collection time and the route length for collection point
In order to reach all the collection points in the settlement, we calculated 20%
of the corrected distance of the settlement.
This is sufficient even in the extreme case if we collect the total amount of plastic fraction in 5 m3 containers. Accordingly, the route length for the sample area is 60.4 km.
This is a significant simplification that takes the same value into account for all material streams, of course. When we prepare data for a specific area, then this value can (and should) be worked out more precisely in the continuing work.
Click to BUY NOW!
.tracker-software.c Click to BUY NOW!
.tracker-software.c
14
For collection point collection, it is also necessary to determine the collection time. The different types of waste have different densities, so the amount and density of the given waste, and the parameters of the container used should also be considered. From the number of containers to be emptied at the same time, and multiplied this number by the standard time, required for emptying
will get the basis for the cost calculation.
3.2.5 Possibility of two-phase collection
The essence of two-phase collection is that expensive collection vehicles cannot be used for door-to-door collection in remote settlements (using current data, modelling reveals how distant settlements can be defined as remote).
For two-phase collection, door-to-door collection can be done using local, low- cost vehicles, employing local labour, delivering materials to a locally central collection point. Thus, the vehicles equipped with compacting hopper, only have to perform loading and transport operations rather than door-to-door collection. In our model, we call them small truck. There is another type of tool, which is an example of international practice in some countries, and pilot projects have been carried out also in several regions in Hungary for the possible implementation: this is the collection of separated waste by horse carriage.
3.2.6 Costs of collection
Using the results of the literature, I have developed the following cost structure:
When calculating the cost of collection, I determined an indicator of HUF / (kilometre, spent on collection), which is independent of the type of collected material. This is the cost value we used for the door-to-door collection. There is a clear distinction between the collecting and work area access phases.
The access to the work area and the trip to the treatment centre were determined in Ft / km. This value is displayed for each collection variation.
For the point collection (container, selective island, local pre-treatment, etc.) I used the vehicle's hourly cost (Ft / hour).
Click to BUY NOW!
.tracker-software.c Click to BUY NOW!
.tracker-software.c
15
For the various point collection, the time required for emptying each type of bins was determined.
The vehicle's mass capacity was determined for each collection version. This value is used by the model, for example to determine whether it is necessary to go to the treatment plant or to the landfill.
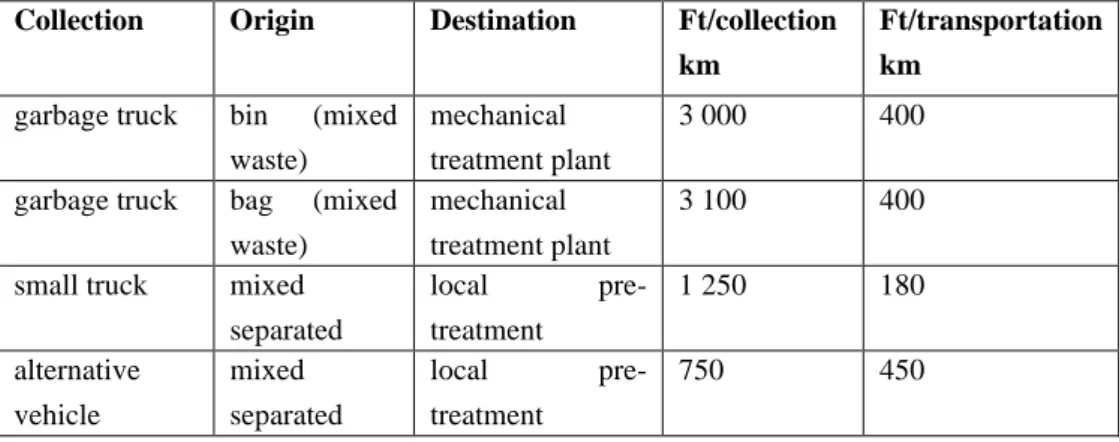
To calculate the cost of door-to-door collecting in the model, we have developed the following formula (see examples in Table 14):
Cost = KFordszam*Tav*2*Gktg + Gyktg*302
KFordszam: number of rounds needed to collect waste (pcs) Tav: distance of model area and waste treatment site (km) Gktg: cost of travel phase (Ft/km)
Gyktg: cost of collecting phase (Ft/hour)
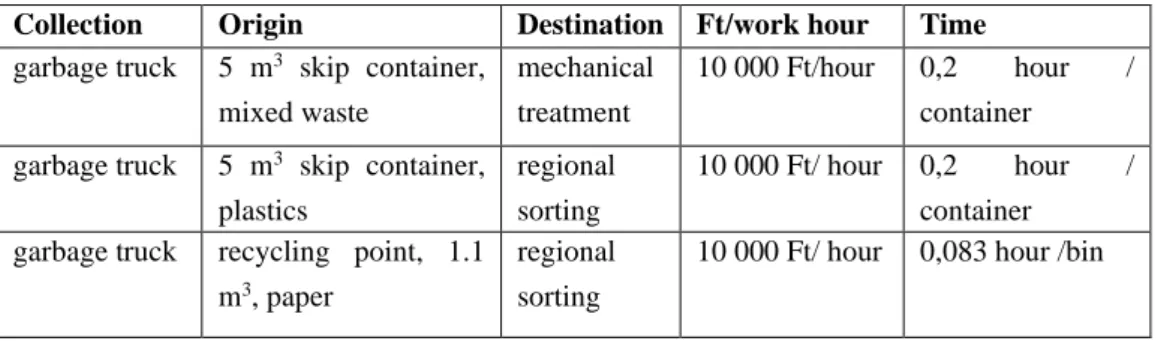
The formula used for point collection (examples in Table 15) was, as follows:
Cost = KFordszam*Tav*2*Gktg + Gktg*302*0.2 + (M/Kkapac)*Kido*Kktg
KFordszam: number of rounds needed to collect waste (pcs) Tav: distance of model area and waste treatment site (km) Gktg: cost of travel phase (Ft/km)
M: quantity (kg)
KKapac: quantity per shipment (kg)
Kido: time needed for emptying of one bin/skip etc. (hour) Kktg: costs of emptying of one bin/skip etc. (Ft/hour)
Table 14 – Examples of costs of door-to-door collection
Collection Origin Destination Ft/collection km
Ft/transportation km
garbage truck bin (mixed waste)
mechanical treatment plant
3 000 400
garbage truck bag (mixed waste)
mechanical treatment plant
3 100 400
small truck mixed separated
local pre-
treatment
1 250 180
alternative vehicle
mixed separated
local pre-
treatment
750 450
Click to BUY NOW!
.tracker-software.c Click to BUY NOW!
.tracker-software.c
16
Table 15 - Examples of costs of collection points
Collection Origin Destination Ft/work hour Time garbage truck 5 m3 skip container,
mixed waste
mechanical treatment
10 000 Ft/hour 0,2 hour / container
garbage truck 5 m3 skip container, plastics
regional sorting
10 000 Ft/ hour 0,2 hour / container garbage truck recycling point, 1.1
m3, paper
regional sorting
10 000 Ft/ hour 0,083 hour /bin
3.3. Preparation and separation options
Mixed municipal waste is treated according to the today's accepted systems in mechanical (MH) or mechanical / biological (MBH) waste treatment plants.
In addition to the separation of magnetic and non-magnetic metals, the main output stream (in terms of recovery) is the combustible fraction in the form of RDF (refuse derived fuel) or SRF (solid recovered fuel). However, the largest proportion of mixed waste is the residual fraction, which is destined for landfill.
Regional, large-scale selection plants have been created from domestic and EU funding to handle selective material flows in past years. Here the incoming materials are usually sorted after pre-screening (which is used to remove the contamination of the selective material partially and manually).
A significant number of outputs can be released during the selection process.
Our model distinguishes the following outlet streams, according to the starting fractions:
- paper, - cardboard, - tetrapaks,
- PET (no colour sorting),
- PE (contains both HDPE and LDPE), - other plastics (all remaining fractions), - non-ferrous metal,
- ferrous metal,
Click to BUY NOW!
.tracker-software.c Click to BUY NOW!
.tracker-software.c
17
- remaining waste fraction.
At the end of the sorting process, residual materials are transferred to the mechanical treatment plant or, after shredding, to the RDF fraction.
In the case of small vehicles and alternative collecting solutions, due to the small amount of waste, the carrying of the selective materials for long distances makes the system less efficient. This barrier hinders long routes, so their operation is closely linked to local handling. Therefore, a cost-effective remote two-phase collection system requires a receiving facility nearby.
Local pre-treatment can be located between the phases of the two-phase transport. In this case, waste collected by any means of transport in the municipality, will not be transported to the treatment centre, if any, but will be temporarily discharged at the local receiving facility.
The simplest operation that can be performed locally is to repackage the bulk waste received. This puts the incoming selective waste in a packaging container that does not change its original (collection) composition, however makes it easy to transport further (using a cheaper vehicle).
If this results cost reduction in system-level, then in addition to repackaging, and additional value-added tasks such as sorting, can be performed in the local unit. Regarding to this local sorting, I built several waste paths into the model, too.
Depending on the composition of the incoming waste, it is possible to separate the main types of material (paper, plastic). Under appropriate conditions, it is possible to separate also the mixed paper-paperboard-tetra fraction, PET, PE and other plastics, as well as separation of the ferrous metals from non- magnetic metals.
The major groups of transition and state elements, associated with secondary separations are shown in Tables 16 and 17.
Table 16 – Separation type transition elements in the model
Number Description
Transition group 8 2 regional mechanical treatment, sorting-balling Transition group 9 30 local repackaging
Transition group 10 25 local sorting
Transition group 11 25 micro regional sorting
Click to BUY NOW!
.tracker-software.c Click to BUY NOW!
.tracker-software.c
18
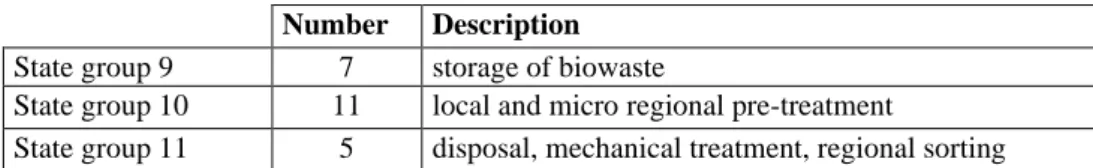
Table 17 - Storage type state elements in the model
Number Description State group 9 7 storage of biowaste
State group 10 11 local and micro regional pre-treatment
State group 11 5 disposal, mechanical treatment, regional sorting
In addition to the cost of collection, the other major cost category is the cost of treatment activities. This basically depends on the composition of the material being treated. The cost of treatment for different types of material is determined in Ft / kg.
I have taken into account the characteristics of the various facilities, the properties of the materials and the characteristics of the containers used. It is important that I did not calculate the investment (and depreciation) costs of the containers, and the different specific costs like the labour requirements of working with the bins.
The treatment costs were calculated according to Table 1.
3.4 System revenue
Calculating the ultimate cost-effectiveness of a given system, in addition to the cost of collection and pre-treatment, requires knowledge about the cost / revenue of two other factors. The first is the public service charge, paid by the household for the service. Actually, this amount is calculated by dividing the cost, remaining after summing up the system incomes and system costs.
Another important element that can significantly contribute to the revenue of the system (and reduces the cost to the user of the service) is the revenue from the sale of the collected, selected and baled materials. The selling prices of the baled materials were determined in accordance with Table 4.
3.5 The structure and the use of the model
In the model, waste goes from storage to storage through separations. The initial separation is at the property, where the waste is generated and then, through transportations, it gets to the possible further separation.
Click to BUY NOW!
.tracker-software.c Click to BUY NOW!
.tracker-software.c
19
Storage places (state elements) are typically containers for bins, treatment facilities, and baled and bulk wastes.
Transition elements are the elementary processes, by which waste is transferred from one state element to the next state elements, through optional modification. Transitions include collection, collection activities, transport, sorting and other treatment procedures.
The description of the possible state and transition elements of the processes is contained in a text input file. According to a fixed syntax, it describes, all the information that the general kernel program (considering also two general state and transition meta-prototype) can use for the generation of Programmable Structures. The kernel, accepting the process model generating input, is written in the PROLOG programming language.
The process model generator takes into account also the parameters, associated with each element, from an Excel file describing the various characteristics of states and transitions.
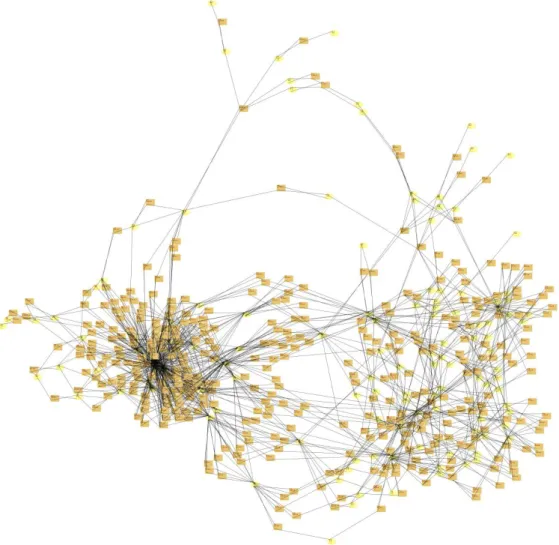
A diagram of the generated Programmable Structure, containing all possibilities of the process network is shown in Figure 1.
The GraphML file defines all possible states (storages, symbolized by ellipses) and transitions (separations, transports, final product releases, symbolized by rectangles), as well as all of the connections amongst them.
The elements of the structure contain the initial parameters, and various evaluation parameters in an editable form. This model representation supports the construction of prototype elements, containing local program codes.
Prototype elements can be derived from meta-prototypes (in accordance with initial characteristics and parameters).
The specific local program prototypes, used to calculate the process model are the followings:
• "state" = state prototype: summarizes the effect of various decreasing and increasing input changes on a given storage location and determines the actual output quantities;
• "home" = state prototype, defines the daily or weekly waste production of 10,000 households by fractions (as a possible upgrade of the model
Click to BUY NOW!
.tracker-software.c Click to BUY NOW!
.tracker-software.c
20
it can handle the seasonal changes in the amount and composition of waste). The state element that describes households is the only input element of the model (the whole model is a "disassembly" structure, describing consecutive branches, however there may be also recirculation connections);
• "selecting" = transition prototype that provides calculation of household, local, micro-regional and regional separation and the associated costs (in case of a possible upgrade, this prototype can handle also the changes in waste separation efficiency and purity);
• "transporting" = transition prototype that calculates the transportation between different locations using different vehicles, and the associated and parameterized costs. Various alternative ways of transport are possible between two storage sites;
• „outlet" = transition prototype that defines landfill costs for the process and the incomes from sales of selected waste for revenue.
Click to BUY NOW!
.tracker-software.c Click to BUY NOW!
.tracker-software.c
21
Figure 1 –Structure of the generated Programmable Structure containing all states, transitions and connections
The steps of generation of the model of the individual variants are the followings:
1. in the process network description file we set the status for "y" for those trans() type transition elements, which are needed in the given individual model (the status of other elements are set to "n");
2. model generation runs with this modified text, with the actual Excel data file, as well as with the two general meta-prototypes, automatically;
3. next the kernel generates the optionally editable GraphML model of Programmable Structure;
4. this structure is to be supplied with the actually used prototypes, containing the local programs;
Click to BUY NOW!
.tracker-software.c Click to BUY NOW!
.tracker-software.c
22
5. afterwards the kernel program generates two dynamic Prolog databases for the simulation model from the GraphML description, automatically;
6. finally, the kernel program performs dynamic simulation, which results in a .csv output file. This includes detailed amounts for waste production, separation and transport over time.
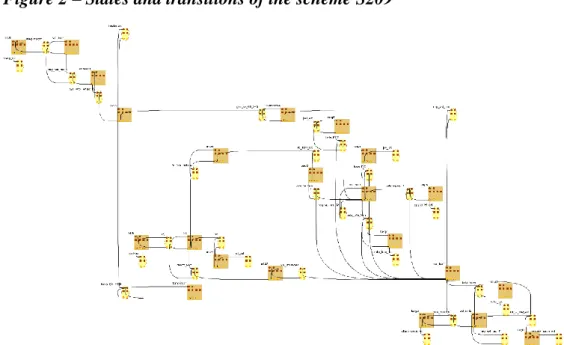
Figure 2 shows one example process network for a scheme and Figure 3 below shows the change of annual cost of the related operation.
Figure 2 – States and transitions of the scheme S209
Click to BUY NOW!
.tracker-software.c Click to BUY NOW!
.tracker-software.c
23
Figure 3 – Annual cost of one selected variant of scheme S209
Selection of the preferred (sub-optimal) collection and separation solutions requires a simplified generation and evaluation of all possible solutions.
Simplified generation means that after step 5, in the knowledge of the previously generated description of all possible state and transition elements,
a) we generate the simplified description for each possible variant (containing the building blocks belonging to the individual variants), automatically b) next using an algorithm, designed for this purpose, we generate and simulate all the possible variants, one after the other automatically, with a simplified output recording.
In this simplified output recording, due to the increase of computational speed and memory saving, we do not report about the detailed results of the dynamic simulation, but only some selected cumulative parameters (such as total cost, amount of disposal, etc.) for the whole year.
Of course, it is also possible to print out the calculation results of any of these variants, starting from the code after step a) above (while it is much simpler than to generate every model separately).
Using the above advanced generation, it is possible to generate nearly 600,000 variants for the studied design space.
- 20 000 000 40 000 000 60 000 000 80 000 000 100 000 000 120 000 000
0 10 20 30 40 50 60
Cost (Ft)
Weeks
Cost of S209
Click to BUY NOW!
.tracker-software.c Click to BUY NOW!
.tracker-software.c
24
Figure 4 illustrates the annual cost of 40,000 pre-selected variants, showing how the cost changes when we increase the distance from the central treatment site from 10 km to 50 km.
Figure 4 – Annual cost of selected variants with 10 and 50 km distance
4. Conclusions and recommendations
4.1 Conclusions and recommendations based on literature survey
• Ownership relations of waste management service providers are thoroughly studied in the literature. Although there are differences of opinion, the performance of publicly owned organizations is strongly demonstrated. In today's Hungarian context, besides public ownership, the non-profit form is required. Together, these two constraints can serve as a long-term benefit for the environment.
• EU regulations (here I mean primarily for recycling directives) are fully reflected in the domestic legal system. However, it is important that the provisions of the already known circular economy package have to transpose into national law and practice in time. From 2020, the
- 100 000 000 200 000 000 300 000 000 400 000 000 500 000 000 600 000 000 700 000 000
Ft/year
Variant
Ktg 10 km Ktg 50 km
Click to BUY NOW!
.tracker-software.c Click to BUY NOW!
.tracker-software.c
25
recovery rates are significantly higher, than the currently reached (practically it needs doubling). The achievement of this level is doubtful even if there is an active management policy. National strategy papers and annual plans should start planning right now, so that all actors will be able to begin their preparations in time.
• Based on the experience so far, it can be stated that the EU regulations allow the recently used and possible additional collection and separation procedures to achieve the targeted situation. However, the Hungarian legislation lays down more specific and stricter obligations (sometimes unnecessarily).
• The study on the operation of waste management systems and the pursuit of optimization appear in many articles. It is common, however, that the focus of available research does not cover the whole activity, but only a selected narrow area. Summarizing the available knowledge elements, it can be stated that the building blocks have been studied in sufficient depth, but a significant part of them is case-specific. There is more literature that studies on public service activities (usually collection and pre-treatment) by analysing and evaluating the building blocks. However, the development of scenarios is only rarely carried out, and also these consider only one-digit options.
• The significantly different settlement characteristics of urban and rural collection do not really appear in the studies. Sources that differentiate between these two types strongly warn of differences. However, the average values for rural areas do not show significant differences because of the distance to the central treatment site (a rural settlement could be located both 10 and 80 km far from the treatment site).
• As soon as service areas are identified, the costs of the service can be examined. There is a significant amount of cost data for specific areas, but their composition, unit costs of activity elements, mileage and vehicles used are not easily identifiable. In addition, several studies suggest methods for determining the cost of collection. While studying these, it is surprising that besides the general methods (benchmark, unit cost calculation, etc.), there are only a small number of specially
Click to BUY NOW!
.tracker-software.c Click to BUY NOW!
.tracker-software.c
26
"waste-based" methods. Nevertheless, their application is not widespread.
• Studying the literature on waste management, it appears that the authors are basically analyzing the regional dimension, and in some cases, there is a reference to the benefits of smaller scale treatment procedures. The local treatment appears only at the suggestion level and, as it is not used in practice, it does not appear in studies on the analysis of operating systems.
4.2 Conclusions and recommendations based on systematic preparation of the process model
• In my research there was a considerable difficulty that the types of waste, according to the Hungarian Standard and those listed in other documents, are not harmonized, but there are overlapping classes, without full and disjunct equivalence classification. This is not just a domestic problem, as EU has been trying to formulate an appropriate definition of municipal waste for years. The lack of non-standard nomenclature and equivalence classification is a growing problem in defining current and future collection targets. Fortunately, circular economic targets simplify the situation by setting recycling targets for a given percentage of municipal waste as a whole, rather than a fraction of the priority waste streams. However, achieving the set of impressive rates will be a huge task for us, as 91% of the waste streams (considered in the model) suitable for recycling and would have to be collected selectively. The preparation of the systematic model motivated and helped to develop a usable classification, as a by-product.
• Cost-effective fulfilment of the target value can only be achieved if the most accurate factual data can be used to determine the baseline values (number of inhabitants, amount of waste). If we are aware of the amount and composition of the waste, generated in a given area, then the specific collection targets should be determined for that. Quantities and composition should be determined taking into account that
Click to BUY NOW!
.tracker-software.c Click to BUY NOW!
.tracker-software.c
27
significant seasonal changes within a year, so the timing of sampling should be carefully selected.
• The current country-wide standard of collection (20 kg / person / year) is not applicable, as collecting that standard quantity from an average 200 kg / person / year of waste production in a rural area is a much larger task. It is worth mentioning that even considering this value, the recently expected 10% recycle ratio is only 10%, which is far from the 25% goal for 2020, and very far from 50%, prescribed for 2025. The issue of responsibility needs to be resolved in order to meet the set performance goals. Currently, the public service operator is responsible for performance, and its financing also depends on it to a large extent.
However, it is the responsibility of the municipality to organize the public service and to determine its content, so it is not rational to hold only the public service provider for responsible for its selective performance. I note that, with rare exceptions, local governments do not deal with the dissemination of good practices on local level. In a well-functioning system, the responsibility of the local government should be defined.
• In addition to door-to-door collection, the legal use of collection points should be considered (with the obligation to achieve adequate performance). This bin type system is capable of performing well, but at a lower cost
• Permission procedures for local collectors and pre-treaters need to be simplified. In order to ensure professional operation, these operators could subcontract their activities to the public service provider. This ensures that outputs and quality of the intermediate activities are appropriate for regional treatment.
• Particular attention should be paid to biodegradable waste due to its high percentage by weight and to the potential for its on-site treatment.
Circular economy targets can only be achieved if we can fully utilize green wastes. It is also important that in this case the recovery is done by nature and the resulting compost can be used locally.
Click to BUY NOW!
.tracker-software.c Click to BUY NOW!
.tracker-software.c
28
• The household owner must utilize the public waste management service. One must pay even if they have not put the bin out in front of the property. There was some justification for lowering the mandatory collection rate in winter last year, but this change is problematic from many aspects. The winter / summer collection plans complicate the work of service companies. Both its mechanical and human resources must be adapted to meet the changing needs by every six months.
Financial basis relies on the volume of contracted mixed waste. If it halves in winter, it will mean an unsolvable financial problem for provider. Otherwise, the property owner may have difficulties as well.
The amount of mixed waste in summer time is not reduced significantly in winter, if one uses composting and a selective container intelligently.
Therefore, the property owner should purchase a double-sized bin for the winter. If this does not happen (it is not likely to happen), one will have to choose "alternative" solutions to "dispose" the waste.
Undoubtedly, it will save a few thousand forints a year. Mixed waste always contains biodegradable ingredients (e.g. hygienic waste, food waste contaminated packaging, etc.), so the reduction of collection frequency can be questioned.
4.3 Conclusions and suggestions, based on tested simulation model
• The correct selling price of the secondary raw materials is important for the financial sustainability of the system.
• Waste composition studies should be conducted for various areas and for various public service providers, and the seasonality should also be taken into account.
• Operating costs should be examined separately for each service provider, because of the different cost structures and capabilities
• The length of collection routes at every settlement needs to be worked out more precisely
• Using the model also provides an opportunity to determine the waste charge.
Click to BUY NOW!
.tracker-software.c Click to BUY NOW!
.tracker-software.c
29
• It can be stated that there is no single global optimum, the territorial optimum is determined by the costs of the given service provider, by the waste production habits of the property owners and by the prices of the selected utilizable materials. However, the selling prices of selected materials vary considerably, so in planning of systems, only the average price can be taken into account. This makes the long-term planning almost impossible.
• There is huge difference between the annual cost of individual solutions. In our model, the difference between the cheapest and the most expensive variant in the 10 km version is 267% and in the 50 km calculation is 315%
• As the distance increases, the collection options, favourable over shorter distances, may become too expensive, so the multi-step collection solutions within a service area may be advisable.
• Local composting options significantly reduce the total cost of the system.
• The type of bins basically determines the cost of collection.
• We can summarize that in the knowledge of well-defined parameters for a particular area, the model helps to develop different new variants and to predict waste volumes, costs, and incomes.
Click to BUY NOW!
.tracker-software.c Click to BUY NOW!
.tracker-software.c
30
5. New research results
1. Based on factual data, I have determined the typical amount and composition of municipal waste. Based on this input data I have systematically determined the possible residential, local, micro-regional and regional separations, the associated possible transportations, as well as the amounts of the utilizable selected materials and of remaining waste to be disposed.
2. Based on this systematization, and using the methodology of Programmable Structures, with the help of my supervisor's team, I have generated the process structure that contains all of possible collection and separation schemes. I have collected the data, needed for the simulation and evaluation of the building blocks and have developed the relationships for the evaluation. The applied method enabled the generation, calculation and evaluation of a dynamic simulation model for each collection and separation system, by selecting the interconnected elements for the alternative solutions.
3. Based on the detailed simulation of the example solutions I have concluded that the modelling method can be applied for the simulation of the various collection and separation networks, as well as for the evaluation of them,
according to multiple objectives (e.g. cost, disposed quantity, etc.).
4. Applying of the methodology of Programmable Structures, with the help of my supervisor's team, we have developed an algorithm to determine the simplified generic code of all collection and separation variants, automatically.
5. Based on this faster simulation and simplified summarized evaluation of a selected subset of possible solutions, I have showed that the method can be applied for analysing the impact of various parameters and cost factors, as well as for supporting the related decisions. Further development of the model, taking into account the specific features of typical collection areas, makes possible the model-based testing of many solutions (part of them completely new but promising).
Click to BUY NOW!
.tracker-software.c Click to BUY NOW!
.tracker-software.c
31
6. Publications
1. Trenyik Tamás (2016). Estimation the vehicle demand of the door-to- door separate waste collection. Regional and Business Studies Vol. 8 No 1, 47-58
2. Trenyik Tamás (2015). Comparison of the recycling performance and the waste legislation in Hungary and Germany. Journal of Central European Green Innovation 3, 125-140
3. Trenyik Tamás (2016). Estimation of fuel consumption of vehicles for the transporting and collecting phases of solid municipal waste collection – Economics, considering climate change. Journal of Central European Green Innovation 4, 123-134.
4. Takács Vivien, Tóth Katalin, Borbély Csaba, Trenyik Tamás (2016).
Az élelmiszerpazarlás csökkentésének megítélése az éttermekben. In:
Szente Viktória, Gál Veronika Alexandra, Bareith Tibor (Szerk.).
Junior kutatók munkái: Válogatás a kaposvári egyetem gazdaságtudományi kar diákköri kutatócsoportjainak vizsgálataiból.
Kaposvár: Kaposvári Egyetem Gazdaságtudományi Kar, pp. 47-52.
5. Mezei C, Kovács S Zs, Trenyik T, Nagy I (2018). Energy Potential of Waste: Case Study of the Hungarian Waste Management System. In:
Raos P, Galeta T, Kozak D, Raos M, Stojšić J, Tonković Z (Eds.) 16. Skup o prirodnom plinu, toplini i vodi = 16th Natural gas, heat and water conference: 9. Međunarodni skup o prirodnom plinu, toplini i vodi = 9th International natural gas, heat and water conference. 189- 198.
Konferencia helye, ideje: Osijek, Horvátország, 2018.09.26- 2018.09.28. Slavonski Brod: Strojarski fakultet u Slavonskom Brodu, (Zbornik Radova)
Click to BUY NOW!
.tracker-software.c Click to BUY NOW!
.tracker-software.c