building façade in Algeria
Messaouda Rais
1p, Adel Boumerzoug
2and Balint Baranyai
31Marcel Breuer Doctoral School, Department of Building Structures and Energy Design, Institute of Architecture, Faculty of Engineering and Information Technology, University of Pecs, Boszorkany u.
2, H-7624 Pecs, Hungary
2Institute of Architecture, University Mohamed Khider Biskra, BP 145 RP, 07000, Biskra, Algeria
3Department of Building Structures and Energy Design, Institute of Architecture, Faculty of Engineering and Information Technology, Boszorkany u. 2, and Janos Szentagothai Research Center, Ifjusag u. 20, University of Pecs, H-7624 Pecs, Hungary
Received: February 10, 2020 • Revised manuscript received: May 27, 2020 • Accepted: June 4, 2020 Published online: April 27, 2021
ABSTRACT
As it is clear, worldwide buildings are the largest consumer of the final energy consumption. In Algeria, it has been reported that 33% of the overall energy consumption was attributed to buildings. This is due to the design and constructional techniques of the residential buildings, which do not address the local climatic condition. To assess this situation, the study is focused on analyzing the existing residential buildings in Algeria, in terms of energy, thermal, daylight, and indoor air quality performance, using a dynamic simulation software. Typical building design in a hot and dry climate was selected. The results revealed that the existing residential buildings do not comply with the energy-efficient design standards.
It was concluded that further strategies should be applied in this sector, in terms of building design, materials, and façade configuration.
KEYWORDS
energy efficiency, thermal comfort, daylight, hot dry climate, façade design
1. INTRODUCTION
Preserving the environment is the most important issue of today’s world in which human beings must reduce energy consumption. As it is clear, worldwide buildings are the largest consumer of thefinal energy consumption, it accounts for more than 40% [1]. In Algeria, it has been reported that 33% of the overall energy consumption was attributed to buildings;
this value has increased awfully between 2016 and 2017 by 5.3% [2]. During the last decade, housing construction issues became one of the development priorities in Algeria. Policies and strategies were set up in order to tackle the housing demand and to reorganize the sprawling slum areas, providing social houses for these low-income families who live there [3]. The design and constructional techniques of these buildings are operated with over-shorter project planning time, and it is always striving to minimize design costs, neglecting the climate conditions in the different regions of the country. However, performing buildings that maintain occupant’s comfort with less energy consumption requires an architectural design that uses appropriate technologies and design principles which respond accurately to the local climatic conditions [4–6]. According to the literature, several research studies revealed that building façade elements have the most influential impact on building energy consumption and thermal performance [7]. In addition, the building façade should behave as an energy-efficient passive or active mechanical system. For instance, the wall material, the thermal insulation type, and its thickness have a significant impact on minimizing the heats transfer, therefore, enhancing thermal comfort [8, 9]. Furthermore, the window to wall ratio
Pollack Periodica • An International Journal for Engineering and Information Sciences
16 (2021) 2, 136–142
DOI:
10.1556/606.2020.00204
© 2020 The Author(s)
ORIGINAL RESEARCH PAPER
pCorresponding author.
E-mail:messaouda.raiss@gmail.com
is an important factor to balance the heatflow and natural light by choosing the appropriate size, orientation, glazing, and shading type. The analysis should be concluded by ac- counting for the interaction between natural lighting and the Heating, Ventilation and Air Conditioning (HVAC) system [10]. The amount of incident solar radiation (insolation) admitted through the glazed surfaces in the façade may show severe thermal and visual discomfort issues, in order to avoid excessive solar gain and reduce energy consumption it is necessary to adopt suitable shading device design [11].
The building façade design also plays an important role in providing effective ventilation configuration and strategies, in order to provide efficient Indoor Air Quality (IQA), which usually expressed by the CO2 concentration in the space and the air ventilation rate [12]. This study presents the evaluation of a typical existing social house design in Algerian hot and dry climate region, which represent the major part of the country, through a Diagnostic of Energy Performance (DEP) of the building, estimating the energy demand related to the thermal comfort, day-lighting and air quality, which mainly depends on the façade component design.
2. DIAGNOSIS OF ENERGY PERFORMANCE METHODOLOGY
2.1. Case study location and climate
The study context is located in Algeria, in a hot and dry climate region, because it represents the major part of the country depending on the K€oppen-Geiger climate classifi- cation, this climate is characterized by very hot summers and mild winters [13]. The city of Biskra was selected as a representative city of this climate, it is located in north- eastern of Algeria on the northern edge of the Sahara Desert at latitude of 348480 North and a longitude of 58440 east, it rises to an altitude of 86 m. Based on the climatic data of Biskra city, which obtained from the weather file “Meteo- norm 7”; during the year, the average temperatures vary by 22.7 8C. The warmest month is July with an average tem- perature of 40.2 8C. Moreover, January has the lowest average temperature of the year at 16.78C. Furthermore, the highest relative humidity average is in December 60.7%, while July represents the lowest relative humidity average, it is 26.5%.
2.2. Typical social housing
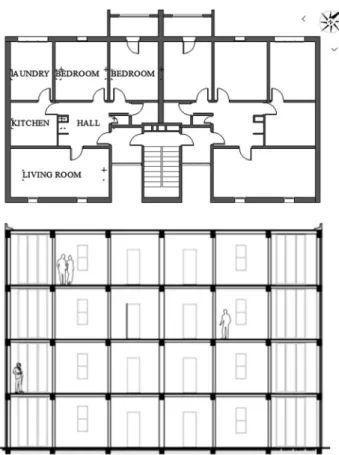
This study is focused on the collective residential building type in Algeria called Social housing. An existing building in Biskra city was selected as a referential model; it character- izes the typical design used in all over the country. The building reference is located in an urban area; the imple- mentation is oriented within the axis North-east and South- west. This building is a multiple-dwelling unit, that contains 8 apartments and all the apartments have a similar spatial distribution; living room, two rooms, kitchen, laundry room,
toilet, and bathroom. The total area of one apartment is 92.13 m2, with a ceiling height of 2.70 m, Fig. 1. The ma- terials applied for the façades are concrete blocks and plas- terboard, the plaster is used for the coating. Currently, these materials are less used in the Algerian residential building factory, therefore the concrete blocks were replaced by double hollow brick in this study because it is the most commonly used in the last years.Table 1shows the detailed thermal properties of the material used in the diagnosis.
2.3. Input data and boundary conditions for the simulation process
The current study methodology is based on a quantitative diagnosis of the DEP, it provides information on the amount of energy consumed in terms of heating and cooling together, with thermal comfort, daylight, and indoor air quality. The diagnosis is carried out by using dynamic simulation with Blender 3D software for modeling and building information has been included by the plugin VI- suite that controls the external applications radiance, energy plus [14].
The inputs of the climate data used in the simulation are based on “Biskra” climate station from the weather file
“Meteonorm 7”.
The assessment of the energy consumption is conducted by insertion of the HVAC; and it is applied to the upper apartment in the selected block. The simulation period has been carried out in the whole year (from January 1 to
Fig. 1.Plan and section of the social house reference
December 31). To analyze each space in the apartment, the building boundary is specified in sixteen, 16 zones; six, 6 zones with an HVAC system (hall, 2 bedrooms, living room, kitchen, and bathroom/WC) and eight, 8 zones without HVAC (laundry, entrance and the seven, 7 other apartments in the building). The analysis is carried out for the 6 zones that have a HVAC system. The balconies’ setting was inserted as shading elements. Additionally, the building cooling-heating service system setting was inserted based on the Algerian Regulatory technical document, the cooling system turns on if the temperature is above 258C, while the heating system turns on when the temperature is less than 208C [15].
Meanwhile, the analytical methodology adopted for thermal comfort is based upon the model of Fanger, Pre- dicted Mean Vote/Predicted Percentage of Dissatisfied (PMV/PPD), which defines the thermal sensation of the occupants [16]. In the thermal assessment phase of the analysis, 2 zones (living room, Room 1) in the upper apartment were specified in the upper apartment to be analyzed; assuming two occupants and one occupant respectively, and no mechanical system has been applied in the zones.
Furthermore, the diagnosis is concerning also the daylight comfort, which is related to the Window to Wall Ratio (WWR), it focuses on the assessment of the illumi- nance levels and the light uniformity. The analysis is applied for the living room and the Room 1 in two design days (December 21 and June 21) form the sunrise to the sunset for both days. The results are compared with the standard of Building Research Establishment Environment Assessment Method (BREEAM) that provides information about the required illuminance level (the average over interspace and the minimum at the worst point) as well as the daylight uniformity [17].
Finally, the analysis of the InDdoor air Quality (IDQ) is focused on evaluating the amount of the CO2 concentra- tion, it has been set up in two zones (the living and the Room 1), assuming 2 occupants in the living room and 1 occupant in the Room 1, and the windows opening/closing was set up based on a normal family house activities. Those are open on weekdays between 7.00 and 8.00 and from 16.00 to 17.00 at 10%, as well as the un-occupancy time are defined between 8:00 to 16:00. On the weekends, it is assumed that the occupants are staying all the time in the apartment and the windows are opened between (7:00 to 8:00, 12:00 to 13:00 and 17:00 to 17:00 at the same opening rate).
3. RESULTS AND DISCUSSION
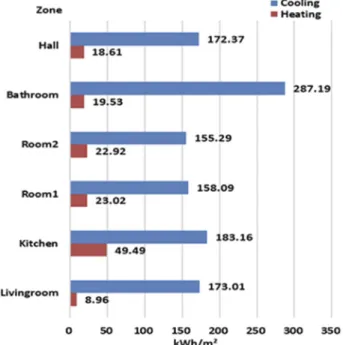
The simulation results of the energy consumption showed that 89% of the total energy consumption was used on cooling, while 11% was used on heating,Fig. 2.
The comparison of the energy consumed in heating and cooling shows a variation in each different zone, this is due to the zone’s position in the apartment, regarding its orientation and different surface areas that have direct contact with the outside.
The bathroom has the highest cooling energy con- sumption, followed by the kitchen, the living room, the hall, Room 1, Room 2, which includes the balcony has less consumed energy. The cooling consumption in the bath- room reached 287.19 kW/m2, it has direct contact with the entrance hall that has a fully glazed façade, which increased the greenhouse effect in the entrance hall and impacts directly the bathroom. In the kitchen, the assumed energy is 183.16 kWh/m2, the main façade of this zone is oriented to the south-west which has a higher solar gain. The living room has 173.01 kWh/m2, it has 2 façades one oriented to the south-east, and the other is oriented to the south-west.
The cooling consumption in the hall reached 172.37 kWh/
m2 because it is surrounded by the different spaces, during the day the heat is accumulated, which means there is no Table 1.Conventional wall thermal properties
Material (mm) Conductivity (W/m$K) Thickness (mm) Specific heat capacity (J/kg∙K) Density (kg/m3)
Cement mortar 1.4 20 1,080 2,200
Hollow brick 0.48 150 936 589
Air gap 0.026 50 1,000 1
Hollow brick 0.48 100 936 625
Plaster 0.35 20 936 875
Fig. 2.The energy consumption of the upper apartment in a whole year
effective air circulation furthermore it has direct contact with the entrance zone. The bedrooms are both oriented to the north-west façade but the energy consumption in Room 1 is higher than Room 2, 158.09 kW/m2, 155.29 kW/m2 respectively, this is revealed that the balcony as a shading element has an impact on minimizing the solar heat gain.
For the heating consumption, the kitchen has the highest heating energy consumption 49.49 kWh/m2, followed by the Room 1; 23.02 kWh/m2, and the Room 2; 22.92 kWh/m2, the bathroom 19.53 kWh/m2, the hall 18.61 kWh/m2, and the living room that has less heating consumption 8.96 kWh/m2. The heating and cooling consumption show par- tial reversed results according to orientation and solar gain;
the more exposed zone to solar gain, the less heating, and more cooling it consumes,Fig. 3.
The diagnosis of thermal comfort is also applied in the living room and the Room 1. The resulting analysis of the PMV/PPD indices for the given zones shows that; based on the PMV people are feeling very hot almost all the summer period (June, July, August), in the winter (January, February, and December) they are feeling cold to be very cold, the feelings are approached the comfort zone in some days of the mouths (March, April, May, and October). Furthermore, the comfort range is defined between -1< PMV <þ1, and the feelings above this range are uncomfortable, the comfort hours for the whole year are reached 1,437 hours and 1,219 hours for the living room and Room 1 respectively. The discomfort hours are attained 7,323 hours in the living room and 7,541 hours in Room 1, Fig. 4. Illustrate the scale of occupant’s sensation from very cold feelingsþ6 to very hot -6, while zero expresses neutral feelings.
Moreover, the PPD indicates that more than 90% of people are not satisfied almost all the summer and winter periods, while in March and April it varied between 10 and 70% for both the living room and Room 1,Fig. 5.
The daylight analysis, which carried out in the Room 1 and the living room in the winter and the summer shows that the minimum illuminance for the living room reached maximum 20 lux in the summer and 10 lux in the winter, and the Room 1 reached in the summer 10 lux, while in the winter 5 lux, both zones have less than the minimum illu- minance required by the BREEAM standard, which is 30 lux at the worst point. Meanwhile, the optimal average daylight illuminance in the BREEAM standard is 100 lux, both zones have more illuminance levels than the standard, in summer, the living room reached 160 lux and the Room 1 reached 125 lux, while in winter both zones have less than the standard illuminance, the living room 87.5 lux, and the Room 1 62.5 lux,Fig. 6. Also, the results revealed that there Fig. 3.The cooling and heating consumption of all the simulated zones
Fig. 4.PMV results for the living room and Room 1
Fig. 5.PPD results for the living room and Room 1
is a daylight uniformity problem in the zones as is illustrated in the graphs ofFig. 7, which indicates that the uniformity of both zones in summer and in winter is less than the uni- formity value 0.3, which is required by the BREEAM stan- dard.
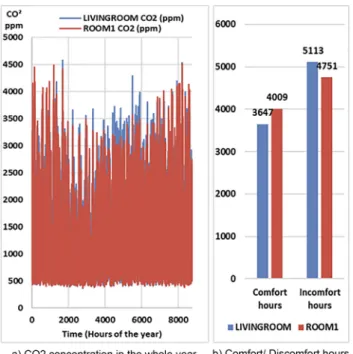
The CO2 concentration analysis is applied in Room 1 and the living room and the simulation results are compared with the American Society of Heating, Refrigerating, and Air-Conditioning Engineers (ASHRAE) standard that
determined the optimal level 1,000 ppm of CO2 concen- tration [18]. The results show that the living room has higher CO2concentration levels than the Room 1. The levels are varied between 500 and 4,000 ppm as a maximum level for the whole year.
A reduction of the CO2concentration is presented dur- ing windows were open, it reached 1,000–2,500 ppm, while when the windows were closed, the concentration exceeded the recommended value of 1,000 ppm as it is indicated by Fig. 6.Daylight illuminance comparison between bream standard and the living room and Room 1 a) illuminance in the summer (June); b)
illuminance in the winter (December)
Fig. 7.Daylight uniformity comparison between bream standard and the living room and the Room 1 results, a) uniformity in June; b) uniformity in December
the ASHRAE standard.Fig. 8aillustrates the variation of the CO2concentration in the whole year. The best hours of CO2 concentration is reached 3,647 hours and 4,009 hours in the living room and the Room 1 respectively in the whole year, while the CO2concentration that is above the standard 1,000 ppm is reached 5,113 hours and 4,751 hours in the living room and the Room 1.Figure 8shows the CO2 concentra- tion in the whole year together with the hours of comfort/
discomfort.
4. CONCLUSION
The comprehensive analysis of the residential building selected for representative case study in Algeria demon- strated that the building does not comply with the building energy design standards; there are many weaknesses in terms of building energy consumption, thermal comfort, visual comfort, and indoor air quality.
This study revealed what kind of further design strategies are needed, including materials of the external wall structure to optimize the thermal comfort and to reduce the energy consumption, the window configuration, and its orientation with an accurate design that responds to the climate to ensure the best practice in visual performance and minimize the penetration of direct solar irradiation. Furthermore, it is demonstrated that mechanical and natural ventilation should be integrated into the design strategy in order to improve indoor air quality. This study shows clearly that the energy efficiency strategy should be accounted for during the early design stage. Additionally, these design strategies should be developed for the hottest period which represents
the longer period in the year when 89% of cooling con- sumption is estimated.
ACKNOWLEDGEMENTS
The authors would like to thank Dr. Ryan Southall researcher and developer of VI-suite Add-on Blender 3D software, University of Brighton, for his help and great support.
REFERENCES
[1] X. Cao, X. Dai, and J. Liu,“Building energy-consumption status worldwide and the state-of-the-art technologies for zero-energy buildings during the past decade”,Energ. Build., vol. 128, pp. 198– 213, 2016.
[2]Bilan_Energetique_National_2016_edition. Ministry of Energy and Mining, Algeria, [Online], Available:http://www.energy.gov.
dz/francais/uploads/2017/Bilans_ et_statistiques_du_secteur/
Bilan-Energetique/Bilan_Energetique_National_2016_ edition_
2017.pdf. Accessed: Mar. 15, 2018.
[3] R. Djafri, M. M. Osman, N. S. Rabe, and S. Shuid, “Algerian housing policies”,Asian J. Environ.-Behavior Stud., vol. 4, no. 13, pp. 1–14, 2019.
[4] I. Oropeza-Perez and P. A. Østergaard, “Active and passive cooling methods for dwellings: a review”,Renew. Sustain. Energ.
Rev., vol. 82, part 1, pp. 531–544, 2018.
[5] S. Elhadad, B. Baranyai, J. Gyergyak, I. Kistelegdi, and A. Salem,
“Passive design strategies for residential buildings in a hot desert climate in upper Egypt”, in Proceeding of 20th International Multidisciplinary Scientific Geoconference, Varna, Bulgaria, June 28–July 7, 2019, 2019, pp. 495–501.
[6] S. Elhadad, M. Rais, A. Boumerzoug, and B. Baranyai,“Assessing the impact of local climate on the building energy design: Case study Algeria-Egypt in hot and dry regions”, inProceeding of 172nd In- ternational Conference on Science, Engineering and Technology, Istanbul, Turkey, Nov. 20–21, 2019, 2019, pp. 21–24.
[7] D. Aelenei, L. Aelenei, and C. P. Vieira, “Adaptive façade:
Concept, applications, research questions”,Energ. Proced., vol. 91, pp. 269–275, 2016.
[8] M. Ozel, “Thermal performance and optimum insulation thick- ness of building walls with different structure materials”, Appl.
Therm. Eng., vol. 31, no. 17-18, pp. 3854–3863, 2011.
[9] C. H. Radha and I. Kistelegdi,“Thermal performance analysis of Sabunkaran residential buildings typology”,Pollack Period., vol.
12, no. 2, pp. 151–162, 2017.
[10] H. Shen and A. Tzempelikos,“Daylighting and energy analysis of private offices with automated interior roller shades”,Solar En- ergy, vol. 86, no. 2, pp. 681–704, 2012.
[11] M. Rais, A. Boumerzoug, M. Halada, and L. Sriti,“Optimizing the cooling energy consumption by the passive traditional façade strategies in hot dry climate”,Pollack Period., vol. 14, no. 1, pp. 177–188, 2019.
[12] C. Xiaohui, G. B. M. Reza, R. R. L. Shih, and B. Baranyai,
“Comfort and energy performance analysis of a heritage resi- dential building in Shanghai”,Pollack Period., vol. 14, no. 1, pp.
189–200, 2019.
Fig. 8.The CO2concentration in the living room and Room 1 for the whole year
[13] M. Kottek, J. Grieser, C. Beck, B. Rudolf, and F. Rubel,“World map of the K€oppen-Geiger climate classification updated”,Mete- orologische Z., vol. 15, no. 3, pp. 259–263, 2006.
[14] R. Southall, F. Biljecki, “The VI-Suite: A set of environmental analysis tools with geospatial data applications”,Open Geospatial Data Softw. Stand., vol. 2, no. 23, pp. 1–13, 2017.
[15]The regulatory technical document.Residential-Rules of calcula- tion of the heat supply in the buildings (in French). DTR C3-2, 1997.
[16] K. E. Charles, Fanger’s Thermal Comfort, and Draught Models.
Institute for Research in Construction National Research Council of Canada, pp. 1–30, 2003.
[17] BREEAM UK New construction: Non-domestic buildings, Bre Global Ltd, SD5076:5.0-2014, CreateSpace Independent Publish- ing Platform, 2017.
[18]ASHRAE Standard 62.1-2010, Ventilation for acceptable indoor air quality, American Society of Heating Refrigerating, and Air Conditioning Engineers, 2016.
Open Access. This is an open-access article distributed under the terms of the Creative Commons Attribution 4.0 International License (https://creativecommons.org/
licenses/by/4.0/), which permits unrestricted use, distribution, and reproduction in any medium, provided the original author and source are credited, a link to the CC License is provided, and changes–if any–are indicated. (SID_1)