Using Multivariate Statistical Methods for Analysing Financial Literacy, as a Possible
Appearance of Social Innovation
KITTI FODOR
PHDSTUDENT
UNIVERSITY OF MISKOLC e-mail: fodor.kitti@uni-miskolc.hu
SUMMARY
Financial literacy is an interesting research area. In this paper my aim is to answer three important questions about financial literacy with help of statistical methods. Can it be predicted whether a country has an appropriate level of financial literacy? Can homogenous groups be identified among the observed countries? Does the income group influence the level of financial literacy? For the prediction of financial literacy I used membership logistic regression. The two independent variables were the Human Development Index and Government expenditure on education (GDP%). I was able to achieve a classification accuracy of 88.5%. To answer my second question I created clusters and used Ward’s method to create five homogeneous groups. I identified one group with an extremely low level of financial literacy. To answer my third question I used the Chi-square test for Independence. During the analysis I came to the conclusion that financial literacy and income group are not independent of each other.
Keywords: financial literacy, cluster, statistic, logistic regression Journal of Economic Literature (JEL) codes: G53, C12, C13, O35 DOI: http://dx.doi.org/10.18096/TMP.2020.01.02
S OCIAL I NNOVATION AND
F INANCIAL L ITERACY
There is no generally accepted definition of social innovation and there are several approaches. For example, the definition of social innovation of Hazel & Onaga is focusing on the solving social problems. (Hazel & Onaga 2003; Mulgan et al. 2007; Béres 2013; Karajz et al. 2019).
In another definition “social innovation provides new or novel answers to problems in a community with the aim of increasing community well-being” (Kocziszky et al. 2017:
p.16).
The question is whether we can talk about social innovation in finance and lending. The answer, I think, is clearly yes. Events in recent years have highlighted the need for innovation in this area, because over-indebtedness of the population and credit defaults are not beneficial to society. Legislative measures have been taken in recent years to keep loans under control, such as the introduction of the payment-to-income ratio (PTI, in Hungarian JTM) in 2015. From 2006 the trend of the outstanding defaults had been increasing, but after the introduction of the PTI
the number of defaults began to fall. The Central Credit Information System (KHR) reported in 2018 that in the 32–55 age group 20% of the people who have credit agreements are over-indebted. In addition, legal regulation may provide a solution to the problem of the development of financial literacy, financial awareness and financial intelligence of the population, which I identified as a possible manifestation of social innovation (MNB 2006;
Kovács & Kuruczleki 2017; KHR 2018).
Financial literacy, like social innovation, is a concept that has no generally accepted definition. According to the MNB (Hungarian Central Bank) definition, financial literacy is “a level of financial knowledge and skills, with the help of which individuals are able to identify the basic financial information necessary for making conscious and cautious decisions. Then after obtaining this information, they are able to interpret it and on its basis they are able to make a financial decision and assess its possible financial and other consequences for the future.” (MNB-PSZÁF, 2008: 1)
A great deal of research has been carried out in recent years about financial literacy in both the Hungarian and international literature. Kovács and Terták (2019) explained in detail some of them in their book. In the book
these studies have been explained in detail. Some of these surveys are the following:
Econventios’s surveys,
Survey of the State Audit Office of Hungary among college students,
Diákhitel’s survey,
Survey of Money Compass – Foundation for Financial Awareness among adults
Survey of financial personality types (Kovács-Terták 2019)
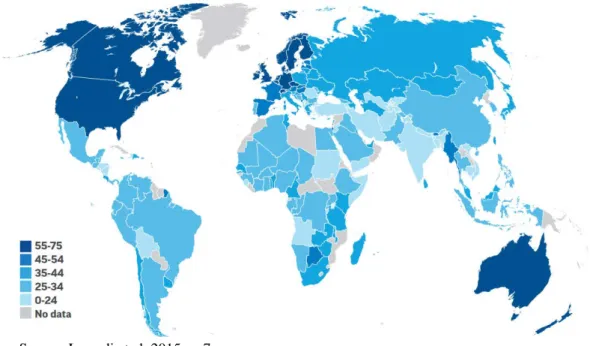
One of the most important studies for this paper is the S&P survey, which has been described as “the world’s largest, most comprehensive global measurement of financial literacy” (GFLEC). More than 150,000 adults in over 140 countries participated in the survey. The map in Figure 1 illustrates the level of financial literacy in each country. Of the survey’s results I would like to highlight only a few. Women have a lower level of financial literacy globally; while only 33% of the adult population are financially literate, this ratio is 30% for women and 35%
for men. and 46% of the Hungarian population is considered financially illiterate. (GFLEC, Lusardi et al.
2015)
A NALYSIS OF F INANCIAL L ITERACY
AT THE U NIVERSITY OF M ISKOLC
In the second half of 2019, I conducted my own survey of students' financial literacy with 5 questions in 4 areas.
The concerned areas were compound interest, risk diversification, inflation and numeracy (interest). 124 undergraduate students majoring in economics participated in the survey. For the analysis I applied descriptive statistical methods and cluster analysis. Out of the 5 questions asked, the biggest problem was with the 4th and 5th questions, which received the lowest number of correct answers. Question 4 surveyed inflation awareness and 58% of the respondents answered correctly.
Question 5 focused on numerical skills and 69% of the respondents answered correctly. Overall, the survey found that 67% of respondents were financially illiterate, meaning that they answered the questions in fewer than three areas correctly. They have to answer all of the questions in one area correctly to be considered financially literate in that area.
Source: Lusardi et al. 2015, p. 7
Figure 1. Global variations in financial literacy (percentage of adults who are financially literate)
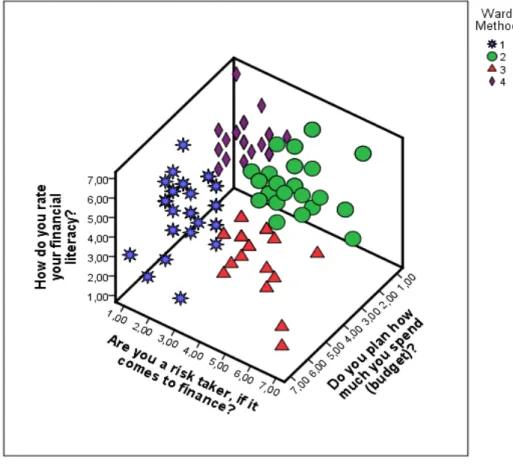
The second part of my research focused on the examination of financial attitudes, to which I applied cluster analysis. I chose 3 variables:
How do you rate your financial culture? (Likert scale, where 1 means very poor and 7 means excellent)
Are you a risk taker when it comes to finance? (Likert scale, where 1 means strongly disagree and 7 means strongly agree)
Do you plan how much you spend (budget)? (Likert scale, where 1 means never and 7 means always) From my analysis I came to the conclusion that creating 4 clusters would be ideal. The name of the first cluster, which is intended to broadly describe it, is
“common single women”. The level of the financial literacy in this group is good, and they are satisfied with their own financial situation, that means they have enough money and live comfortably, and can save up, too. Budget making and risk taking is not characteristic of this cluster.
The ratio of single respondents was the highest in this
group and the ratio of women was high, too. The second cluster is the “rich planners”. This people are dissatisfied with their own financial situation, they are financial risk takers, but they spend time planning their budget. The members of the third cluster have low financial self-esteem and are dissatisfied with their own financial situation.
These people are the highest risk-takers, and budget planning is least characteristic for this group. They were the least familiar with the concepts of lending and finance, so they deserved the title “distracted ignorant”. In the case of the last cluster, it can be stated that they are most satisfied with their financial situation, they are not risk- takers and budgeting is typical for this group. They have the lowest income. In addition to the above, they are well- informed in the field of finance and lending. The group was named “informed rural women”. As the 3-D scatter in Figure 2 shows, the groups are nicely separated.
More information on this survey can be found in Fodor (2019).
Source: SPSS output
Figure 2. 3-D scatter about clusters for identifying groups by shape and color
D ATABASE AND M ETHODOLOGY
For the purpose of this study, I created my own database and analysed the financial literacy of each country using statistical methods.
Database
For the analysis I established a new database. For my database I used the results of the World Bank, WHO and S&P financial literacy surveys. The S&P survey covered 140 countries, which limited my analysis, so the database included only the 140 countries for which the financial literacy index was available. Most of the variables are high level measuring metric variables. The variables were the following:
Name of the country
Employment to population ratio (age group: 15+)
Fixed telephone subscriptions per 100 people
Bank nonperforming loans to total gross loans
Commercial bank branches per 100,000 adults
ATMs per 100,000 adults
Renewable energy consumption of total energy consumption
Ratio of urban population to total population
GDP per capita (current USD)
Access to electricity of population
Government expenditure on education (% of GDP)
Unemployment total of total labour force
Military expenditure of general government expenditure
Population density
Current health expenditure (% of GDP)
Population
Life expectancy at birth
Alcohol consumption per capita (litres of pure alcohol)
BMI (Body Mass Index)
Income group of the country
HDI (Human Development Index)
Financial literacy (value from the S&P survey)
Methodology
Several statistical methods have been used in recent years to examine financial literacy. These methods include, for example, regression, logistic regression, cluster analysis, descriptive statistical methods, ANOVA, and the Chi-square test. I choose some of these methods for my analysis. I thought I would choose of these methods for my analysis. In this section, logistic regression and
applied binomial logistic regression. The value of the dependent variable is 1 if at least 40% of the adult population in that country is financially literate, otherwise the value is 0. The value is an arbitrarily chosen value, it is above average. In logistic regression, the analysis is based on the "odds", which determine the probability of a country having an appropriate level of financial literacy or not. The odds can be expressed by the following formula:
𝑜𝑜𝑜𝑜𝑜𝑜𝑜𝑜𝑥𝑥=1−𝑃𝑃𝑃𝑃𝑥𝑥
𝑥𝑥
.
In the logistic regression, we assume that the logarithm of the odds can be defined as a linear function of the independent variables, which can be written as follows:
ln(𝑜𝑜𝑜𝑜𝑜𝑜𝑜𝑜𝑥𝑥) =𝑙𝑙𝑜𝑜𝑙𝑙𝑙𝑙𝑙𝑙(𝑈𝑈𝑥𝑥) =𝛽𝛽0+𝛽𝛽1𝑥𝑥1+. . . +𝛽𝛽𝑝𝑝𝑥𝑥𝑝𝑝 . The other central element of the analysis is the so- called cut point value. This value can be chosen arbitrarily, but it is important to keep in mind that the losses resulting from a false classification are kept to a minimum. (Hajdu 2003; Sajtos & Mitev 2007; Malhotra 2008; Varga &
Szilágyi 2011) Cluster analysis
Cluster analysis involves the systematic organization of observation units into homogeneous groups. Basically, this is a technique for exploration. We can choose from a hierarchical and non-hierarchical method, or we can combine the two. During the analysis, I chose hierarchical cluster analysis because I needed to determine the number of clusters, which I did with the Ward method. (Hajdu 2003; Sajtos & Mitev 2007; Malhotra 2008; Sajtos &
Mitev 2007; Varga & Szilágyi 2011) Chi-square test
The Chi-square test for Independence is a type of Nonparametric Test. It can be used if we want to test the relationship between two nominal variables. The null hypothesis is that there is no relationship between the two variables, so the two variables are independent of each other. The value of the test statistic is based on the difference between the observed and the expected frequencies, so we can calculate the value of the test statistic by using the following formula:
𝜒𝜒2=∑ ∑ (𝑓𝑓𝑖𝑖𝑖𝑖−𝑓𝑓𝑓𝑓 𝑖𝑖𝑖𝑖∗)2
𝑖𝑖𝑖𝑖∗ 𝑡𝑡𝑗𝑗=1
𝑠𝑠𝑖𝑖=1 ,
E MPIRICAL R ESEARCH
During the empirical research I searched for an answer to the following questions:
Can it be predicted whether a country has an appropriate level of financial literacy?
Can homogenous groups be identified among the observed countries?
Does the income group influence the level of the financial literacy?
In answering each question, I tried to choose the most suitable statistical analysis, so I chose logistic regression, cluster analysis, and the chi-square test.
Logistic regression
Of the 140 countries included in the database, the logistic regression analysis covered only 78 countries, due to the fact that in several countries there were no values for each variable, so I discarded them from the analysis.
34.6% of the countries have an appropriate level of financial literacy, that means at least 40% of the adult population is financially literate. In the logistic regression, the dependent variable indicated whether the financial literacy of a country was good or not. Among the variables included in the database, HDI and Government expenditure on education (GDP%) were included in the
analysis as independent variables. The model is significant, and based on the Hosmer and Lemeshow Test it can be stated that the model fits well, and the Nagelkerke R2 value is 70.3%. However, it is important to look at the classification accuracy, which is 88.5%. Table 1 shows the classification table.
The variables included in the model are considered significant. In the case of HDI, if the index increases by 0.01 then the odds of being a country with good financial literacy is higher by 25.4% on average, all other things being equal. If a country increases the spending on education by 1% of GDP, then the odds of being a country with good financial literacy is higher by 138.9% on average, all other things being equal.
Cluster analysis
I performed the cluster analysis along three variables:
Employment to population ratio
Government expenditure on education (GDP%)
Urban population (% of total population).
During the analysis, I identified 2 outliers, Tunisia and Bahrain, using the Nearest Neighbour method. Then I made further analyses of the data. In this case the database includes 82 elements. As a result of the analysis, I created 5 clusters using the Ward method. As the 3-D scatter in Figure 3 shows, the groups are nicely separated.
Source: SPSS output
Figure 3. Classification table
Source: SPSS output
Figure 4. 3-D scatter about clusters In the case of the first cluster, it can be stated that in
this case the value of government expenditure on education is the lowest and the urban population is 45% of the total population, which can be considered as a medium level. In technical terms, the value of fixed telephone subscriptions is low, 2/3 of the population has access to electricity, but 50% of the energy consumption comes from renewable energy. In the field of banking services, the ratio of non-performing bank loans is medium, the number of branches per 100,000 people and the number of ATMs is low. In these countries the life expectancy at birth is 66 years, and these countries are among the middle- developed countries. Countries in this cluster have a low level of financial literacy. Members of this group are for example Afghanistan, Kazakhstan, Pakistan and Haiti. The cluster was named “countries needing innovation”.
The second cluster has the lowest employment to population ratio and a high urban population ratio. The proportion of GDP spent on military expenditure is the highest in these countries. A large part of the population
Spain, Ireland and Luxembourg. The cluster was named
“not good, not terrible”.
The third cluster is similar to the first cluster in many aspects, but in this case the fixed telephone subscriptions rate is higher and more than 90% of the population has access to electricity. The ratio of non-performing loans is low and the incidence of bank branches and ATMs is higher than in the first cluster. In financial literacy, these countries performed second best. Developed countries belong to this group, where the life expectancy at birth is 73 years. These countries spend the least on military expenditure as a percentage of GDP. Such countries are Austria, Hungary, Poland and the Slovak Republic. The cluster was named “innovation is in progress”.
In the fourth cluster, more than 80% of the population belongs to urban populations. These countries spend the most on education and the lowest on military expenditure.
The countries in the fourth cluster are the most developed, 99.87% of the population has access to electricity, but they do not favour renewable energy. The banking network is
countries are Belgium, Germany, Netherlands and the United Kingdom. The cluster was named “wise wealth”.
The last cluster contains the lowest number of countries, the group of the least developed countries. They spend moderately for education, but still have the lowest level of financial literacy, and these people have the lowest life expectancy at birth. Only 1/3 of the population has access to electricity. The ratio of non-performing loans is very high and the banking network is poorly developed.
The average GDP per capita is USD 539.84. This group includes densely populated countries such as Rwanda, Nepal and Malawi. All countries except Nepal are located in Africa. The cluster was named "lacking knowledge".
Chi-square test
With the help of the Chi-square test for Independence, I examined whether a country's payment category has an effect on a country's level of financial literacy. I had the data to analyse all 139 countries. In an independence test, I tested the assertation that the two variables are independent. During the analysis I came to the conclusion that the two variables are not independent of each other (Chi-square = 62.561, p = 0.000). C-measure (0.671) shows that there is a medium-strong dependence.
C ONCLUSION
In previous international research, 46% of Hungarians were considered financially illiterate, but other studies have concluded that the financial literacy level of the younger age group is lower; this may be reflected in the less favourable values found in my survey of university
students (Fodor, 2019). The level of financial literacy of these students is disappointing, especially considering that they are economics students. I think that in the future this area must be given special attention, as today's young people will be the decision-makers of the future. However, the financial literacy requires innovation.
And what is the situation with the countries?
Unfortunately some indicators are unavailable in some countries, therefore, I had to work with a smaller group of countries. I have come to the conclusion that logistic regression can be used to group countries using HDI and Government expenditure on education (GDP%) variables.
I think this can be true in real life. Other studies have found that people with a higher level of education have a higher level of financial literacy (Béres, 2012). This may be true of countries, too, so if a country spends more on education, it can lead to a higher level of financial literacy.
Another finding reported that wealthier people have higher levels of financial literacy. This statement holds true for countries as well. This was supported by two analyses. On the one hand, the financial culture of countries with the highest GDP per capita was the best, with over 50% of the adult population in these countries being financially literate. In contrast, in the case of countries with the lowest GDP per capita, the proportion of these people was less than 30%.
Overall, I believe that improving financial literacy can be a potential manifestation of social innovation. Financial literacy must be an important part of our daily lives. It can be important for avoiding financial and credit problems. If we will have a higher level of financial literacy, I hope that we can make better financial decisions. Developing the financial literacy of Hungary and other countries is not only an individual issue but also a social issue.
Acknowledgement
This research was supported by the project no. EFOP-3.6.2-16-2017-00007, titled Aspects on the development of intelligent, sustainable and inclusive society: social, technological, innovation networks in employment and digital economy. The project has been supported by the European Union, co-financed by the European Social Fund and the
budget of Hungary.
REFERENCES
ATKINSON, A. AND F. MESSY (2012), “Measuring Financial Literacy: Results of the OECD / International Network on Financial Education (INFE) Pilot Study”, OECD Working Papers on Finance, Insurance and Private Pensions, No.
15, OECD Publishing, Paris.
http://dx.doi.org/10.1787/5k9csfs90fr4-en.
BÁNFI, Z. (2013). Lehet-e túlzott mértékű a lakossági eladósodottság? (Can there be an excessive indebtedness of the population?) Pénzügyi Szemle Online. 24 April 2013. Retrieved: May 2019:
https://www.penzugyiszemle.hu/vitaforum/lehet-e-tulzott-merteku-a-lakossagi-eladosodottsag
BÉRES, D. (2013). Pénzügyi kultúra - mi is ez valójában? (Financial literacy – What is it really?) Pénzügyi Szemle Online. 20 June 2013. Retrieved: May 2019: https://www.penzugyiszemle.hu/vitaforum/a-penzugyi-kultura-mi-is-ez- valojaban
BÉRES, D., HUZDIK, K. (2012). A pénzügyi kultúra megjelenése makrogazdasági szinten. (Emergence of financial culture at the macroeconomic level) Pénzügyi Szemle Online/ Public Finance Quarterly LVII. : 3. pp. 322-336., 15 p.
Retrieved: May 2019: https://asz.hu/storage/files/files/penzugyiszemle/2012/322_336_beres_huzdik.pdf FODOR, K (2019): Money or life? – The financial literacy of students [under publication]
GFLEC. (n.d.) S&P Global Finlit Survey. Global Financial Literacy Excellence Center, The George Washington University. https://gflec.org///initiatives/sp-global-finlit-survey/
HAJDU, O. (2003): Többváltozós statisztikai számítások (Multivariate statistical calculations), Központi Statisztikai Hivatal (Hungarian Central Statistical Office), Budapest
HAZEL, K. & ONAGA, E. (2003): Experimental social innovation and dissemination: the promise and its delivery, American Journal of Community Psychology 32(3-4), pp. 285-294.
http://dx.doi.org/10.1023/b:ajcp.0000004748.50885.2e.
KARAJZ, S., KIS-ORLOCZKI, M.: A társadalmi innováció és a fenntartható fejlődés kapcsolatának mérése a visegrádi együttműködés országaiban (Measuring the relationship between social innovation and sustainable development in the Visegrad Countries). In: Kőszegi, I.R. (ed.) III. Gazdálkodás és Menedzsment Tudományos Konferencia:
Versenyképesség és innováció, Kecskemét, Magyarország: Neumann János Egyetem. pp. 814-820.
KHR (Central Credit Information System) Annual reports (2018). https://www.bisz.hu/dokumentumtar Retrieved: May 2019
KOCZISZKY, GY., VERESNÉ SOMOSI, M., BALATON, K. (2017): A társadalmi innováció vizsgálatának tapasztalatai és fejlesztési lehetőségei (Experience in analysis social innovation and development opportunities), Vezetéstudomány XLVIII (6-7,15-19. http://dx.doi.org/10.14267/veztud.2017.06.02.
KOVÁCS, L., TERTÁK, E. (2019): Financial literacy - Theory and Evidence, Verlag Dashöfer, Bratislava
KOVÁCS, P., KURUCZLEKI, É. (2017). A magyar lakosság pénzügyi kultúrája (Financial literacy of hungarian population). In V. D. Mariann (Ed.)., "Mérleg és Kihívások" X. Nemzetközi Tudományos Konferencia Miskolc- Lillafüred.. pp. 336-343.. http://gtk.uni-miskolc.hu/files/12432/Konferencia%20k%C3%B6tet%202017%20b.pdf LUSARDI, A., KLAPPER, L., OUDHEUSDEN, P. (2015). Financial literacy around the World (S&P).
http://gflec.org/wp-content/uploads/2015/11/Finlit_paper_16_F2_singles.pdf
MALHOTRA N. K.(2008): Marketingkutatás (Marketing Research). Akadémiai Kiadó, Budapest
MINDY, F. J. (2002): On Becoming a Consumer: Development of Consumer Behavior Patterns in Childhood. Elsevier:
New York
MNB. (2006). A lakosság pénzügyi kultúrájának felmérése (Survey of financial literacy of the population). MNB:
https://www.mnb.hu/letoltes/mnb-penzugyi-kultura-kvalitativ-1.pdf
MNB-PSZÁF. (2008). Együttműködési megállapodás a pénzügyi kultúra fejlesztése területén (Cooperation agreement for development of financial literacy)
https://www.mnb.hu/letoltes/0415mnbpszafmegallpodas-penzugyi-kultura-fejleszte.pdf
MULGAN, G., TUCKER, S., ALI, R., SANDERS B. (2007): Social Innovation – what it is, why it matters and how it can be accelerated. Skoll Centre for Social Entrepreneurship, London
SAJTOS L., MITEV A. (2007). SPSS kutatási és adatelemzési kézikönyv (SPSS Research and Data Analysis Handbook).
Alinea Kiadó, Budapest.
THE WORLD BANK https://www.worldbank.org/
VARGA, B., SZILÁGYI, R (2011): Quantitative Information Forming Methods
https://www.tankonyvtar.hu/hu/tartalom/tamop425/0049_08_quantitative_information_forming_methods/6127/inde x.html (Nemzeti Tankönyvkiadó)
WORLD HEALTH ORGANIZATION https://www.who.int/
PÁL, Z. (2017). A pénzügyi kultúra aktuális kérdései, különös tekintettel a banki szolgáltatásokra (Current Questions of Financial Literacy). Miskolc: A közgazdaságtani-módszertani képzés fejlesztéséért Alapítvány.