HUNGARIAN JOURNAL OF INDUSTRY AND CHEMISTRY Vol. 48(2) pp. 55–58 (2020) hjic.mk.uni-pannon.hu DOI: 10.33927/hjic-2020-28
NEW CHAINING CRITERIA IN DIPOLAR FLUIDS BASED ON MONTE CARLO SIMULATIONS
SÁNDORNAGY*1,2
1Berzsenyi Dániel Teacher Training Centre, Eötvös Loránd University, Károlyi Gáspár tér 4. A-building, 9700 Szombathely, HUNGARY
2Institute of Mechatronics Engineering and Research, University of Pannonia, Gasparich Márk u. 18/A, 8900 Zalaegerszeg, HUNGARY
A new energy-based chaining criterion was introduced in dipolar systems based on an earlier article by the author, in which the probability of chaining for adjacent particles in a new formula of magnetic susceptibility was used. The probability of chaining and the magnitude of the energy criterion can be calculated from the Monte Carlo (MC) simulation values of magnetic susceptibility. The energy criterion also depends on the dipole moment and the density. At high densities, the energy criterion is well below70−75%. In addition, it was confirmed by simulation results that the chain length distribution follows a geometric distribution. How the probability of chaining depends on the energy criterion was given empirically and two parameters were fitted to it.
Keywords: dipolar fluids, chain formation, energy criterion
1. Introduction
According to the literature, the criterion of chaining in dipolar systems is unclear. Usually, an energy criterion is used to decide whether two adjacent particles form part of a chain. The energy criterion defines the limit at a cer- tain level of interaction energy between them, which is usually70−75% of the minimum pair interaction en- ergy [1–4]. According to another definition, if the pair interaction energy is negative and the two particles are closer together than 1.3 in diameter unit, then chaining occurs [5,6]. The problem with this is that the minimum pair interaction energy depends on the magnitude of the dipole moment, so an identical amount of pair interaction energy between two adjacent particles indicates chaining in one case but not in the other. In another article, the author examined [7] the probability density function of pair interaction energies in a dipolar hard sphere (DHS) system and found that no unit jump-like change in the frequency of the pair interaction energy would justify the introduction of a general criterion based on the pair in- teraction energy. Furthermore, such a general definition does not take into account the effect of density, while it can be assumed that chaining occurs at different densities and different energy levels of the same dipole moments.
Therefore, this study seeks to determine the magnitude of the energy criterion from another source, that is, a real, measurable, physical parameter. The physical parameter
*Correspondence:sata123.sandor@gmail.com
in this case is magnetic susceptibility.
In a previous article [8], the author stated that the chain length distribution in dipolar fluids follows a ge- ometric distribution. If the probability that two adjacent particles form a chain is denoted byp, it can be deduced that the chain length distribution is
gk = (1−p)pk−1, (1) wherekstands for the chain length. The particle size dis- tribution, which yields the proportion of particles in ex- actlyk-long chains is
hk= (1−p)2kpk−1. (2) The average chain length is derived from the properties of the geometric distribution:1/(1−p). Assuming that a chain of lengthkbehaves as if its dipole moment iskm, its initial magnetic susceptibility can be deduced (in c.g.s.
units) as
χ0=1 +p 1−pχL
1 + 4π
3 χL
, (3)
whereχLdenotes Langevin susceptibility [9], χL = ρm2
3kBT, (4)
ρstands for the density,Trepresents the temperature, and kBrefers to the Boltzmann constant. InEq. 3, the expres- sion
χP=χL
1 + 4π
3 χL
(5)
56 NAGY
calculates the initial magnetic susceptibility from Pshenichnikov’s theory [10].Eq. 3can be used to deter- mine the value ofpat a given density and dipole moment, sinceχ0can be determined from simulations andχPcan be calculated exactly from
p=χ0−χP
χ0+χP. (6) If the occurrence of chaining is linked to an energy crite- rion, it is clear that the value ofpdepends on the magni- tude of the energy criterion. Thus, if the correct value ofp is known fromEq. 6, the magnitude of the correct energy criterion can be obtained from the relationshipp−Ulim. The structure of the results is as follows: firstly, through several examples, it is shown that for any energy crite- rion, the number of chains follows a geometric distribu- tion; secondly, thepvalues calculated from the magnetic susceptibility values are given; thirdly, from simulations, theUlim values are determined that provide the desired pvalue at a given density and dipole moment; finally, by fitting, an empirical formula is derived to describe the re- lationshipp−Ulim.
2. Simulations and results
Monte Carlo simulations of DHS fluids were performed using a canonical NVT ensemble. Boltzmann sampling [11], periodic boundary conditions and the minimum- image convention were applied. In order to take into ac- count the long-range character of the dipolar interaction, the reaction field method under periodic boundary con- ditions of conduction was used. After 100,000 equili- bration periods,1,000,000production cycles were con- ducted involvingN = 1,000particles. The reduced den- sity was calculated byρ∗ =ρσ3and the reduced dipole moment bym∗=m/√
σ3kBT, whereσdenotes the di- ameter of the particles. The pair interaction energy be- tween two particles in a DHS system is determined only by the dipolar energy:
Uijdd=−m2
rij3 [3 (mbi·brij) (mbj·brij)−(mbi·mbj)], (7) where the particles have dipole moments of strengthm of an orientation given by unit vectorm, moreover, theb distance between the centers of the particles is denoted byrij andbrij =rij/rij. The dots symbolize the scalar product. The lowest and most favorable energy value was determined byUmindd =−2m2/σ3. The magnitude of the energy criterion (u) was given in the usual way in propor- tion to this:u=Udd/Umindd .
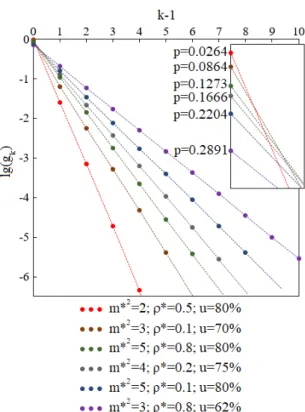
To determine the chain length distribution(gk), the number of chains of a given length was counted in each cycle. This required a predefined energy criterion. Rear- rangingEq. 1leads to the chain length distribution:
lg (gk) = lg (1−p) + (k−1) lg (p). (8)
Figure 1:The logarithm of the chain length distribution as a function of chain length at six different dipole moments, densities and energy criteria. According toEq. 8, the value ofp(probability of chaining) is also derived from the gra- dient of the fitted lines as well as the intercept of the ver- tical axis.
From this, it can be seen that if the logarithm of the chain length distribution is plotted as a function ofk−1, the gradient of the fitted straight line yields the logarithmp, while the logarithm of the vertical intercept gives1−p.
Since in each case the resulting lines are linear, it fol- lows that the chain length distribution does indeed fol- low a geometric distribution.Fig. 1shows the simulation results for the chain length distribution obtained for six different combinations of dipole moments, densities and energy criteria. It can be seen that the fitted lines are lin- ear on the logarithmic scale in all cases. It is clear from the inset graphs that the larger its gradient, the closer its intercept is to zero. Thepvalues shown inFig. 1were derived from the gradient of the fitted lines.
Further results are summarized inTable 1. In the third column ofTable 1, using the terms mentioned in the In- troduction (Section 1), the values ofpare given. The val- ues of χP can be precisely calculated fromEq. 5. The values ofχ0 are derived from the simulations. (For the simulation results of χ0, reference [12] was used. The missingχ0 data were supplemented with our own sim- ulation results.)
This was followed by the determination ofulim, also from our own simulations. According toEq. 2, the num- ber of particles that do not form a chain or, in other words, which form single-element chains is h1 = (1−p)2. Thus, in each step of the simulation, it was only nec-
Hungarian Journal of Industry and Chemistry
NEW CHAINING CRITERIA IN DIPOLAR FLUIDS BASED ON MONTE CARLO SIMULATIONS 57
Table 1:The probabilities of chaining (3rd column), the values of the energy criterion (4thcolumn) according to the simulations and the values of the fitted curves (5thand 6thcolumns) according toEq. 9
(m∗)2 ρ∗ p ulim A B 2 0.1 0.0135 0.74 0.203 2.902 2 0.2 0.0209 0.76 0.358 2.864 2 0.3 0.0316 0.75 0.492 2.863 2 0.4 0.0231 0.80 0.623 2.881 2 0.5 0.0254 0.80 0.751 2.893 2 0.6 0.0387 0.78 0.885 2.901 2 0.7 0.0523 0.77 1.022 2.895 2 0.8 0.1674 0.66 1.167 2.874 2 0.9 0.2641 0.62 1.307 2.821 3 0.1 0.0802 0.68 0.426 2.284 3 0.2 0.0951 0.71 0.607 2.291 3 0.3 0.0772 0.75 0.732 2.333 3 0.4 0.0721 0.77 0.839 2.388 3 0.5 0.0762 0.77 0.943 2.442 3 0.6 0.0840 0.76 1.048 2.498 3 0.7 0.1889 0.67 1.154 2.535 3 0.8 0.3788 0.57 1.270 2.560 3 0.9 0.6745 0.45 1.383 2.547 4 0.1 0.2183 0.67 0.761 1.801 4 0.2 0.1777 0.73 0.900 1.842 4 0.3 0.1278 0.77 0.975 1.900 4 0.4 0.1174 0.78 1.044 1.989 4 0.5 0.1169 0.78 1.107 2.069 4 0.6 0.1818 0.72 1.180 2.159 4 0.7 0.4016 0.59 1.258 2.237 4 0.8 0.6814 0.46 1.341 2.295
essary to count how many particles have the minimum pair interaction energy (counted individually for the other particles) greater than the examined energy criterion.
This greatly simplified the complexity of the simulations.
Therefore, the value ofpbelonging to the given energy criterion was determined, and for each dipole moment and density, a function was generated to create a relation- ship betweenpandulim. Of these, four are shown inFig.
2. The dashed lines indicate theulimvalues of the already definedpvalues of these functions.
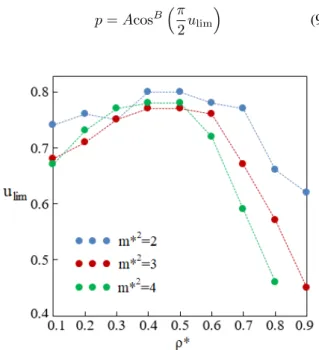
The fourth column ofTable 1shows theulimvalues for each dipole moment, density and value ofpwhich are also plotted inFig. 3. (The uncertainty of the func- tions shown inFig. 3stems from the uncertainty of the magnetic susceptibilities. For dipole moments less than (m∗)2= 2, this new energy criterion cannot be examined precisely because the uncertainty in the magnetic suscep- tibility is too great.) It can be seen that the frequently mentioned70−75%criterion is more or less valid, al- though it differs significantly from it at high densities.
Interestingly, the energy criterion is higher at medium densities than at low densities. This may be because the
Figure 2:The probability of chaining as a function of the value of the energy criterion at four different dipole mo- ments and densities. The dashed lines show the true values ofpand thusulimas well.
chains are so close to each other at medium densities that they have an effect on each other, but do not at low den- sities. It is true that at high densities this effect is even stronger, but at the same time, the strength of the forces acting on the chain also increases.
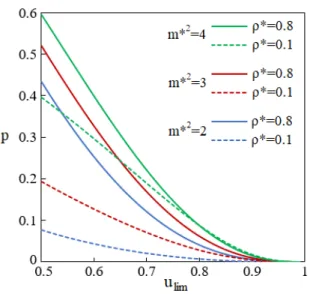
In the following, the relationships between the p− ulimfunctions are specified by fitting. Four of these are shown inFig. 2. InFig. 4, for each of the three dipole moments examined, these functions are plotted at two densities. Since the functions are close to zero around ulim= 1, the cosine function seems to be a good choice for describing the curves as follows:
p=AcosBπ 2ulim
(9)
Figure 3:The values ofulimas a function of the reduced density at three different dipole moments.
48(2) pp. 55–58 (2020)
58 NAGY
Figure 4:The probability of chaining as a function of the energy criterion at three different dipole moments. Dashed lines refer to low densities (ρ∗ = 0.1), solid lines refer to high densities (ρ∗ = 0.8). The lines of intermediate densities are between these two lines.
whereAandB are constants and their magnitudes are given in the fifth and sixth columns ofTable 1. Fits were made within the rangeulim= 0.5−1. The absolute error in the values ofpis not greater than 0.01285 in all the cases examined.
3. Conclusion
The main result of this article is shown in Fig. 3. A well-explained energy-based chaining criterion resulting from magnetic susceptibility was defined. From the sim- ulated values of magnetic susceptibility, the probability of chaining was calculated. From this, the magnitude of the chaining criterion was derived using simulations as well. Therefore, a well-explained theory was developed to define the chaining energy criterion, which produced different results for different values of density and dipole moment in DHS systems. The criterion value of70−75%
commonly given in the literature is only approximately true at low densities (ρ∗≤0.3). At medium densities (0.3< ρ∗<0.6), the values are generally higher, while at high densities(ρ∗≥0.6), they are much lower.
Acknowledgement
This research was supported by the European Union and co-financed by the European Social Fund under the project EFOP-3.6.2-16-2017-00002.
REFERENCES
[1] Ivanov, A. O.; Wang, Z.; Holm, C.: Applying the chain formation model to magnetic properties of aggregated ferrofluids, Phys. Rev. E, 2004, 69(3), 031206DOI: 10.1103/PhysRevE.69.031206
[2] Wang, Z.; Holm, C.; Müller, H. W.: Molecular dynamics study on the equilibrium magnetization properties and structure of ferrofluids,Phys. Rev. E, 2002,66(2), 021405DOI: 10.1103/PhysRevE.66.021405
[3] Valiskó, M.; Varga, T.; Baczoni, A.; Boda, D.:
The structure of strongly dipolar hard sphere flu- ids with extended dipoles by Monte Carlo sim- ulations, Mol. Phys., 2010, 108(1), 87–96 DOI:
10.1080/00268970903514553
[4] Tavares, J. M.; Weis, J. J.; Telo da Gama, M. M.:
Strongly dipolar fluids at low densities compared to living polymers,Phys. Rev. E, 1999,59(4), 4388–
4395DOI: 10.1103/PhysRevE.59.4388
[5] Kantorovich, S.; Ivanov, A. O.; Rovigatti, L.;
Tavares, J. M.; Sciortino, F.: Nonmonotonic mag- netic susceptibility of dipolar hard-spheres at low temperature and density, Phys. Rev. Lett., 2013, 110(14), 148306DOI: 10.1103/PhysRevLett.110.148306
[6] Rovigatti, L.; Russo, J.; Sciortino, F.: Structural properties of the dipolar hard-sphere fluid at low temperatures and densities,Soft Matt., 2012,8(23), 6310–6319DOI: 10.1039/C2SM25192B
[7] Nagy, S.: The frequency of the two lowest energies of interaction in dipolar hard sphere systems,Anal.
Tech. Szeged., 2020,14(2) in press
[8] Nagy, S.: The initial magnetic susceptibility of dense aggregated dipolar fluids, Hung. J. Ind.
Chem., 2018,46(2), 47–54DOI: 10.1515/hjic-2018-0018
[9] Langevin, P.: Sur la théorie du magnétisme, J.
Phys. Theor. Appl., 1905, 4(1), 678–693 DOI:
10.1051/jphystap:019050040067800
[10] Pshenichnikov, A. F.; Mekhonoshin, V. V.: Equilib- rium magnetization and microstructure of the sys- tem of superparamagnetic interacting particles: nu- merical simulation,J. Magn. Magn. Mater., 2000, 213(3), 357–369DOI: 10.1016/S0304-8853(99)00829-X
[11] Allen, M. P.; Tildesley, D. J.: Computer simulation of liquids (Clarendon Press, Oxford) 1987, ISBN:
978-0-198-55645-9
[12] Theiss, M.; Gross, J.: Dipolar hard spheres: com- prehensive data from Monte Carlo simulations, J. Chem. Eng. Data, 2019, 64(2), 827–832 DOI:
10.1021/acs.jced.8b01169
Hungarian Journal of Industry and Chemistry