A Research Review and Taxonomy Development for Decision Support and Business Analytics Using
Semantic Text Mining
Andrea Ko*,‡and Saira Gillani†,§
*Department of Information Systems Corvinus University of Budapest H-1093 Budapest, Fovam ter 13-15
Budapest, Hungary
†Department of Computer Science Bahria University, Karachi Campus
Karachi, Pakistan
‡andrea.ko@uni-corvinus.hu
§sairagilani@yahoo.com
Published 28 January 2020
By 2018, business analytics (BA), believed by global CIOs to be of strategic importance, had for years been their top priority. It is also a focus of academic research, as shown by a large number of papers, books, and research reports. On the other hand, the BA domain su®ers from several incorrect, imprecise, and incomplete notions. New areas and concepts emerge quickly; making it di±cult to ascertain their structure. BA-related taxonomies play a crucial role in analyzing, classifying, and understanding related objects. However, according to the literature on taxon- omy development in information systems (IS), in most cases the process isad hoc. BA taxo- nomies and frameworks are available in the literature; however, some are excessively general frameworks with a high-level conceptual focus, while others are application or domain-speci¯c.
Our paper aims to present a novel semi-automatic method for taxonomy development and maintenance in the ¯eld of BA using content analysis and text mining. The contribution of our research is threefold: (1) the taxonomy development method, (2) the draft taxonomy for BA, and (3) identifying the latest research areas and trends in BA.
Keywords: Taxonomy; taxonomy development; business analytics; text mining; semantic technology; ontology.
1. Introduction
Taxonomies and ontologies play a key role in decision support and business analytics (BA), as e®ective decision-making requires knowledge of the underlying data
§Corresponding author.
This is an Open Access article published by World Scienti¯c Publishing Company. It is distributed under the terms of the Creative Commons Attribution-NonCommercial 4.0 (CC BY-NC) License which permits use, distribution and reproduction in any medium, provided that the original work is properly cited and is used for non-commercial purposes.
Vol. 19, No. 1 (2020) 97–126
°c The Author(s)
DOI:10.1142/S0219622019300076
97 Int. J. Info. Tech. Dec. Mak. 2020.19:97-126. Downloaded from www.worldscientific.com by 146.110.64.33 on 11/18/20. Re-use and distribution is strictly not permitted, except for Open Access articles.
structure and semantics. Clari¯cation of terminology in these ¯elds is important to business, as well as to data management and quality. The importance of BA has recently grown in tandem with the rising interest in big data, big data analytics and machine learning. BA remains the top priority for 2018, according to Gartner CIO Survey, and is considered strategic.1 BA has kept its top position for 5–6 years;
new BA-related competencies and jobs have appeared in organizations.13–15The BA
¯eld is increasingly complex, as new areas and concepts emerge. To make reliable business decisions, decision-makers must be familiar with BA and its key terms and they need to use them in a uniform way. To have a solid knowledge repository and to maintain reliable data quality, it is necessary to use consistent de¯nitions and the same structure of concepts. This signi¯es the major importance of decision support and BA taxonomies; however, their development in information systems (IS) follows an ad hoc process in most cases.4Compared to several other domains, e.g., medical re- search, no mature BA taxonomies and ontologies are available in the literature, despite an increasing need for them in business and academia and despite the popularity of the
¯eld itself among researchers and practitioners. Our paper aims to present a novel semi- automatic method of taxonomy development and maintenance in BA using content analysis and text mining. We identify the latest research areas of the ¯eld as well.
Numerous papers on taxonomies in various areas, e.g., production, healthcare, etc., con¯rm the importance of taxonomies. We found 298 taxonomy-related papers in the Decision Support Systems and Electronic Commerce journal in December 2017, when we started to prepare the ¯rst version of BA taxonomy. However, we found only a few papers published by this journal that aimed to develop an ontology for BA, decision support and related ¯elds in prior years.2,5Thirty-seven taxonomy- related papers were published in the International Journal of Information Technol- ogy & Decision Making journal in March 2019 and two of them are partially related to BA taxonomy. Penget al.81provided a comprehensive framework for data mining and knowledge discovery (DMKD) using grounded theory. Zhang and Segall82 present an overview and evaluation of web mining research and techniques available.
The present research discusses a semi-automatic method for taxonomy develop- ment and maintenance in BA while identifying the latest research topics and trends in this domain. The novelty of our research is the following: (1) the semi-automatic characteristics of our solution is better than fully automatic approach, because we have an opportunity to involve expert opinion, which can increase the accuracy and reliability of our result; (2) the combination of di®erent technologies; visual ana- lytics, clustering and our text mining solution called Promine provide unique fea- tures, which is di®erent from existing methodologies; (3) we apply a new similarity measure in text mining. This paper is structured as follows: ¯rst, taxonomy devel- opment challenges are outlined, and related works are discussed. We detail the special features of the BA domain and present BA taxonomy development initia- tives. Next, we detail our research into a semi-automatic method of taxonomy de- velopment and maintenance, followed by the discussion of the results. Finally, the conclusion is summarized.
Int. J. Info. Tech. Dec. Mak. 2020.19:97-126. Downloaded from www.worldscientific.com by 146.110.64.33 on 11/18/20. Re-use and distribution is strictly not permitted, except for Open Access articles.
2. Related Work | Literature Review
In this section, we discuss taxonomy development methods in Sec.2.1 and provide an overview of BA taxonomies in Sec.2.2.
2.1. Taxonomy development
One of various aspects of taxonomies' importance is a reduction in complexity of a domain due to a structure being imposed on the domain's objects. The classi¯cation of objects helps researchers and practitioners understand and analyze complex domains. Taxonomies play a key role in common understanding of a domain, in knowledge codi¯cation, structuring and also support knowledge base construction.
The reduction of complexity and the identi¯cation of similarities and di®erences among objects are major advantages provided by taxonomies.6,7Taxonomy devel- opment has been researched extensively. Nickerson et al.4performed a comprehen- sive survey of literature on taxonomy development in IS, concluding that the process was ad hocin most cases. The researchers analyzed 65 papers to identify methods used for taxonomy development. Each paper was classi¯ed by its principal domain:
IS, computer science (CS), and non-IS business (Bus), and by the development approach: inductive, deductive, and intuitive. The inductive method includes observing and subsequently analyzing empirical cases to determine taxonomy's features. The analysis can apply statistical techniques, such as cluster analysis, or less rigorous techniques. The deductive approach derives a taxonomy through a logical theory- or conceptualization-based process. In the intuitive approach, the researcher uses his or her understanding of objects and this method is therefore essentiallyad hoc. According to the authors' research, most papers (25) belong to the intuitive category, 11 applied statistical analysis and were hence classi¯ed under the inductive approach, 13 relied on informal analysis and were hence deemed to follow the inductive approach, while another 13 belonged to the deductive category. The authors provide a formal de¯nition of a taxonomy and determined the characteristics of a useful taxonomy. According to their research, a proper taxonomy is concise, inclusive, comprehensive, extensible, and explanatory.
Science mapping analysis as a powerful bibliometric technique describes how disciplines, ¯elds, specialties, and individual documents or authors are related to one another as a spatial representation. Lopez-Herreraet al.78applied this method for the investigation of research themes of the ¯rst 10 years (2002–2011) of International Journal of Information Technology & Decision Making. Their bibliometric map was based on co-word analysis and provided an interesting insight into the main topics being discussed in the journal in these years. They highlighted the most productive themes (according to published papers) and the most impacting ones (according to received citations). Cobo et al.79,80 applied science mapping to analyze fuzzy set theory ¯eld and the research on intelligent transportation systems. Their science mapping analysis tool, SciMAT81 provides a work°ow with three key modules:
cleaning and preprocessing the raw bibliographical data, application of bibliometric Int. J. Info. Tech. Dec. Mak. 2020.19:97-126. Downloaded from www.worldscientific.com by 146.110.64.33 on 11/18/20. Re-use and distribution is strictly not permitted, except for Open Access articles.
measures to study the impact of each studied element, and con¯guration of the analysis. Kanget al.90applies two Bayesian models DWET and HDWET to explore the latent semantic dimensions as the context in natural language. These two models outperform all baseline methods. Their proposed method works with contextual information to get the latent semantic dimensions. Their method predicts emotion for both word and document text. However, Bayesian models cannot converge if the semantic dimensions increase to any signi¯cant degree. Lvet al.91use social network analysis methods to analyze recent advances in transportation research. They summarize the main topics in tra±c related research using social media data, and analyze the current collaboration patterns from the perspectives of researchers, institutions, and countries, which does not exhaustively discuss the representative methods adopted in detection processes.
Meijer et al.8propose a framework for automatic taxonomy construction called
\Automatic Taxonomy Construction from Text" (ATCT). This framework has four stages: ¯rst, terms are extracted from the domain corpus; the second stage involves
¯ltering for domain-relevant terms. Subsequently, a word disambiguation technique is applied to generate concepts. In the last stage, relations between concepts are determined by applying a submission technique.
Ontology development from text, and ontology learning (OL) types are discussed by Al-Arfaj and Al-Salman.9Ontology is a fundamental part of the semantic web.
Gruber10 provides the common de¯nition of ontology in ICT: \An ontology is a formal, explicit speci¯cation of a shared conceptualization." The terms \taxonomy"
and \ontology" are occasionally used synonymously; however, researchers make a point of distinguishing between them, providing clear de¯nitions of each.11 An ontology often includes a subclass-based taxonomic hierarchy; however, extra properties are added to the latter, compared to a taxonomy. OL is a process of creating an ontology automatically or semi-automatically. OL approaches can be classi¯ed using di®erent dimensions: (1) by the type of knowledge resources used for OL, i.e., the data format: structured, semi-structured, or unstructured; (2) by the level of automation, with certain approaches being semi-automated and requiring user intervention, while others potentially being fully automated, with the system managing the entirety of the construction process; (3) by the learning target, i.e., concepts and relations, or de¯nitions of concepts and axioms; and last, (4) by the purpose of the OL process, either to create an ontology from scratch or to enrich an existing ontology.9The authors also discuss and present a comparison of several well- known OL tools. The evaluation dimensions are the elements learned, the primary techniques used, the learning sources, the extent of user intervention, and the ap- proach to evaluating results. Delir Haghighi et al.5 developed a domain ontology (DO4MG) for mass gatherings. To construct an ontology, the authors ¯rst identi¯ed the scope and the objective of DO4MG, and subsequently prepared a corpus of the domain for knowledge acquisition. The corpus used for ontology construction con- sists of 27 scienti¯c papers on emergency management during mass gatherings, several major journal and conference papers on emergency and crisis management, Int. J. Info. Tech. Dec. Mak. 2020.19:97-126. Downloaded from www.worldscientific.com by 146.110.64.33 on 11/18/20. Re-use and distribution is strictly not permitted, except for Open Access articles.
and a public report manual. In this phase, the researchers, helped by domain experts, extract the domain concepts; however, whether the concept extraction process was manual or automated remains unclear. In the next stage, the authors use Protege 4.0 (https://protege.stanford.edu/) to implement the DO4MG ontology. They tested the resulting ontology on a case-based reasoning decision support system for emergency medical management during mass gatherings. Basole et al.12 provide a multidisciplinary classi¯cation and analysis of scholarly development of the litera- ture on enterprise-level IT innovation adoption by examining papers from over the past three decades (1977–2008). The authors discovered new research trends and patterns across disciplines. To create a classi¯cation of relevant literature, the researchers used the previously identi¯ed subject areas within supporting disciplines, created ¯ve broad research streams, and subsequently collected all journals related to such ¯ve streams. To perform text analysis, the authors used Northern Light's MI Analyst engine to perform analysis and classi¯cation.12 This engine is used to identify the key relationships and extract meaning from the corpus.
We analyze taxonomy development methods in the following dimensions: the main techniques used, learning sources, the way of user intervention, and the related domain. This comparison by dimensions provide the background for research gap identi¯cation. Table 1 summarizes the taxonomy development methods, their dis- tinctive factors and the research gaps by dimensions. Typical learning sources used for taxonomy development are research papers from the literature,12,24,25,78–80while some authors use Wordnet and available ontologies as well.71,72 In a case, when researchers manually select papers from di®erent journals, the number of selected papers varying depending on the source and potentially a®ecting results. Taxonomy domains are diversi¯ed, from the medical domain to transportation, but there is no taxonomy focusing on BA.
User interventions are various, from the purely manual process20,24,25 to the automatic methods. In a primarily manual process, a domain expert's intuition and knowledge of the domain will a®ect results. Experts' intervention is common in the selection of papers and in the evaluation of the results phases. Knowledge acquisition is usually not automatic, but is instead facilitated by a domain expert.5 Manual evaluation by experts is a usual approach, as in Text-To-Onto71 and OntoLearn.72 Delir Haghighi et al.5evaluated DO4MG by using a case-based reasoning decision support system for emergency medical management during mass gatherings. Se- mantic approaches appear in evaluation in few investigated cases. Semantic preci- sion, semantic recall, and the taxonomicF-measure are applied in the evaluation of ATCT.8
The main techniques applied in taxonomy development are diverse. Statistical and machine learning methods are the most popular ones, especially clustering, while the semantic techniques are rarer.5,8 Science mapping analysis as a powerful bib- liometric technique is also used for exploring the conceptual structure of a particular research ¯eld.77–80 Semantic technologies are seldom combined with the previously mentioned statistical and machine learning methods.
Int. J. Info. Tech. Dec. Mak. 2020.19:97-126. Downloaded from www.worldscientific.com by 146.110.64.33 on 11/18/20. Re-use and distribution is strictly not permitted, except for Open Access articles.
Table1.Themajorfactorsdistinguishingthetaxonomydevelopmentmethods. TaxonomydevelopmentmethodMaintechniquesusedLearningsourcesUserinterventionFocus(domain) Alter25HumanexpertiseLiteraturereviewWholeprocessDecisionsupport system Basoleetal.12Statistical&textanalysis methodsResearchpapersPapersselectionand classi¯cationITinnovationand adoption Coboetal.79CoPalRed,sciencemappingResearchpapersPaperselectionand evaluationFuzzysetstheory Coboetal.80 andCoboetal.(2012)SciMAT;sciencemappingResearchpapers anddocumentsPaperselectionand evaluationIntelligent transportation systems DelirHaghighietal.5 Protege4.0DomaincorpusKnowledgeacquisition &EvaluationMedicalemergency management Kangetal.90 BayesianinferencemethodBlogpapersWholeprocessSocialmedia Lopez-Herreraetal.78 CoPalRed;sciencemappingResearchpapersPaperselectionand evaluationThe¯rstdecade (2002–2011)of theInternational Journalof Information Technology& DecisionMaking Lvetal.91Socialnetworkanalysis methodMultipleelectronic citationdatabases,full textdatabases,and searchengines
Paperselection andevaluationTransportation Meijeretal.8Statistical&semantic approaches;ATCTTextcorpusEvaluationEconomicsand management; healthand medicine
Int. J. Info. Tech. Dec. Mak. 2020.19:97-126. Downloaded from www.worldscientific.com by 146.110.64.33 on 11/18/20. Re-use and distribution is strictly not permitted, except for Open Access articles.
Table1.(Continued) TaxonomydevelopmentmethodMaintechniquesusedLearningsourcesUserinterventionFocus(domain) Nickerson'sTaxonomy Development Method(2013)
Empiricalapproachora conceptualapproachLiteraturereviewWholeprocessInformation systems Ontogen(2007)Statisticalanalysisand clusteringFreetextEvaluationGeneral OntoLearn(2005)Linguisticanalysis,machine learningandstatisticsFreetextandWordNetEvaluationGeneral Text-To-Onto(2000)Statisticalapproach, pruningtechniquesand associationrules
Freetext,dictionariesand ontologiesEvaluationGeneral Trieu20HumanexpertiseLiteraturereviewPaperselectionand evaluationBusinessintelligence White24 HumanexpertiseLiteraturereview/vendor reportsPaper/reportselection andevaluationBusinessintelligence OurapproachStatisticalandsemantic approaches;clusteringLiterature,domaincorpus, WordNetEvaluationBusinessanalytics ResearchgapUtilizationofsemantic technologiesarelimited. Semi-automaticsolu- tionsarerare.
Typicallearningsourcesare limitedforresearch articlesofcertain domainsfromthe literature.
Userintervention, manualprocessesare common,especially inevaluationphases, whichincrease subjectivity.
Thereisno taxonomy targetingBA domain
Int. J. Info. Tech. Dec. Mak. 2020.19:97-126. Downloaded from www.worldscientific.com by 146.110.64.33 on 11/18/20. Re-use and distribution is strictly not permitted, except for Open Access articles.
2.2. BA and the related taxonomies
BA, business intelligence, and data science have become popular due to the emer- gence of big data. WOS search for the term \BA" according to topic and title resulted in 373 journal papers published between 2009 and 2018. Figure1 demon- strates that the publication frequency of academic journal papers related to BA has increased continuously, especially since 2012.
The business and IT communities started to use the term \business intelligence"
from the 1990s, while \BA" was introduced to represent the key analytical compo- nent in business intelligence in the late 2000s.16Chenet al.17distinguish three phases in the history of business intelligence and BA (BI&A), denote BI&A 1.0, 2.0, and 3.0 according to Gartner BI reports on platforms' core capabilities and the hype cycle.
As of 2018, BA, believed by global CIOs to be of strategic importance,65has for years been their top priority. It is also a focus of academic research, as shown by a large number of papers, books, and research reports.2BA-related skills are valuable in the labor market, with data analytics having become a mandatory core competency for professionals of all types beginning in 2017.26 However, the BA ¯eld su®ers from several incorrect, imprecise, and incomplete notions.2 Terms, such as \business intelligence," \BA," \data analytics," \big data," \data mining," and \data ware- housing" are often used interchangeably in the literature.20 Big data has been characterized in the literature as having one or more of ¯ve dimensions: volume, velocity, variety, veracity, and value.83,84Chenet al.17uses business intelligence and analytics (BI&A) as a uni¯ed term. Turbanet al.18de¯ne business intelligence as the set of techniques and tools for the transformation of raw data into meaningful and useful information for business analysis/decision support purposes. The terms \BA"
and \business intelligence" are occasionally used synonymously. Larson and Chang19 consider the emerging trends in business intelligence and explore the evolution of agile principles and practices with business intelligence, as well as the challenges of
Fig. 1. BA academic journal papers from 2009 to 2018.
Int. J. Info. Tech. Dec. Mak. 2020.19:97-126. Downloaded from www.worldscientific.com by 146.110.64.33 on 11/18/20. Re-use and distribution is strictly not permitted, except for Open Access articles.
business intelligence and future directions. They propose an agile BI framework to compare the traditional BI and fast analytics lifecycles. The objective was to investigate the alignment between agile principles and BI delivery, fast analytics, and data science through the proposed framework. In respect to fast analytics, the researchers emphasize the need for a structure, as the majority of data was unstructured. They discuss the current challenges and future directions for adopting business intelligence platforms, applications, and services in all types of organizations.19
Trieu20 explore business intelligence-related literature; however, the author fo- cuses on a speci¯c ¯eld, namely, the value creation aspects of business intelligence systems. The aim was to identify the parts of the BI business value process that have been studied and remain the most underexplored.20The author emphasizes, as we do as well, that the BI-related literature is fragmented and lacks an overarching framework for integrating ¯ndings and systematically guiding research. He provides a framework of BI value creation. The research framework combines the models of Soh and Markus,21Melvilleet al.,22Schryen23for IS business value. According to this framework, the author identi¯es ¯ve themes in the structure of research gaps and proposes research approaches, namely, context/environmental factors, the BI con- version process, the BI use process, the BI competitive process, and the latency e®ects. The limitations of their work include that the review process was manual, with two experts coding the literature and only the ¯rst 20 papers having been coded by both. White24 notes the importance of BI-related taxonomies. The researcher distinguishes BI applications and platforms. The former include BI types, stores, rules, granularity, and latency subdomains, described by concepts. The latter consist of data integration suites, BI development suites, planning, and prediction tools, BI application packages, and the subdomains of BI delivery and collaboration suites that are described.24BA is a relatively new term and there is no common or estab- lished academic de¯nition for it. Davenport and Harris explain BA as \the use of data, information technology, statistical analysis, quantitative methods, and mathematical or computer-based models to help managers gain an improved insight into their operations, and make better, fact-based decisions" (p. 7).87 Holsapple de¯nes BA as the \evidence-based problem recognition and solving that take place within the context of business situations."2 In the Sharda et al. approach BA are de¯ned as \the application of models directly to business data. BA involve using DSS tools, especially models, in assisting decision-makers (p. 393)."18\BA is a systematic thinking process that applies qualitative, quantitative, and statistical computational tools and methods to analyze data, gain insights, inform, and support decision- making." (p. 13) according to the Poweret al.85Nerkar states that \BA provides the insight and understanding to support informed decisions and con¯dent actions, and provides the feedback that is needed to create a learning organization" (p. 3).88 Gartner IT glossary de¯nes BA as being \comprised of solutions to build analysis models and simulations to create scenarios, understand realities, and predict future states."89 According to these de¯nitions, BA is an emerging discipline, covering Int. J. Info. Tech. Dec. Mak. 2020.19:97-126. Downloaded from www.worldscientific.com by 146.110.64.33 on 11/18/20. Re-use and distribution is strictly not permitted, except for Open Access articles.
numerous activities and tasks. Several de¯nitions emphasize that the goal of BA is to provide insights from data and support the decision-making process. The BA ¯eld is developing and changing rapidly, with the latest trends including ease-of-use and agility.65 Advanced self-service BA platforms targeting end-users, e.g., Tableau, PowerBI, and Microstrategy solutions, appeared 12–13 years ago. Their appearance is a paradigm shift in this area, because people with no IT background, e.g., call center workers and sales managers, were able to perform analytical tasks. Currently, we are in the next phase of BA evolution. The common data preparation tasks, such as data imports and data quality checking, are no longer delegated to specialists, while the latest BA solutions interfaces are available in natural languages and with them users are able to select readymade models from BA frameworks.
New areas and concepts emerge quickly in the BA ¯eld, making it di±cult to ascertain their structure. BA-related taxonomies play a crucial role in analyzing, structuring, and understanding related objects. BA taxonomies and frameworks are available in the literature; however, some are excessively general frameworks with a high-level conceptual focus, while others are application domain-speci¯c.66 Addi- tionally, maintenance is a key issue in this rapidly changing domain.
Alter25developed a taxonomy for decision support systems that has been widely adopted; however, dating back to 1977, it cannot include the latest research ¯elds.
Holsappleet al.2presented a holistic framework/taxonomy for BA that summarized dimensions that were suitable for examining BA' possibilities. Such dimensions are domain, orientation, and technique. Domains are the subject ¯elds that analytics are being applied to. Orientation refers to a direction of thought. The proposed frame- work includes six distinct classes of analytics: movement, collection of practices and technologies, transformational process, capability set, and activity type set as well as a decisional paradigm.2White24distinguishes BI applications and platforms in a BI- related taxonomy. The drawback of such taxonomy is that such subdomains are disjunctive sets. Trieu20investigates the value creation dimension of business intel- ligence systems. The researcher note the fragmentation of the literature and the absence of an integrated framework. Delir Haghighi et al.5 construct a Domain Ontology for Mass Gatherings (DO4MG) and present an application of the DO4MG to an implementation of a case-based reasoning decision support system for medical emergency management during mass gatherings. Capgemini introduces a widely used threefold taxonomy for BA in 2010.2,27,28The company distinguishes descrip- tive, predictive, and prescriptive analytics within BA. Such taxonomy is common in BA literature.3,17,18,86We apply this structure in our paper and use it in the initial version of the BA taxonomy.
3. Semi-Automatic Method for Taxonomy Development and Maintenance in BA | Research Overview
The primary objective of our paper is to provide a semi-automatic method for tax- onomy development and maintenance for the BA domain. The domain itself is Int. J. Info. Tech. Dec. Mak. 2020.19:97-126. Downloaded from www.worldscientific.com by 146.110.64.33 on 11/18/20. Re-use and distribution is strictly not permitted, except for Open Access articles.
important and has been a focus of research in the past, due to the increasing interest in big data, data analytics, and data science.14Our research approach to taxonomy development beyond the taxonomy construction and maintenance additionally provides a method for identi¯cation of the latest research topics and trends in BA;
hence, it can also be used for the literature review. We discuss the detailed research method and the corresponding system in the following Sec.3.1. This includes text analytics that apply automated methods to extract and discover knowledge in un- structured data sources. Compared to the traditional literature analyses that are often time- and resource-intensive, text analytics o®er automated or semi-automated solutions. Text analytics have not been used extensively to analyze literature, except in certain domains, e.g., biology, biomedicine, and bioinformatics, where researchers have mined various data repositories (e.g., MedLine) to identify gene functionality, molecular interactions, and disease progression.29–31
3.1. Research steps and methods
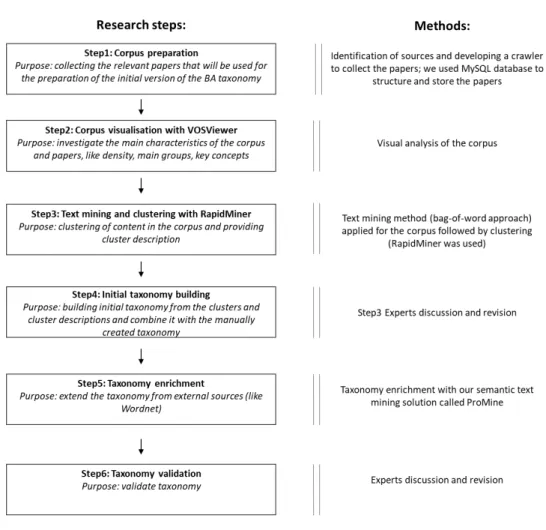
An outline of the research process is shown in Fig.2, while Fig.3details the primary research steps. Our research involves six major phases (Fig.3). Corpus preparation was performed ¯rst. We analyze this corpus with visual analytics and text mining solutions to identify the major areas, keywords and their relations, which helped the development of the ¯rst version of the BA taxonomy. Applying a visual analytics solution to the corpus, we were able to highlight the primary BA areas, and the associated metadata and characteristics. To obtain a clearer picture, we perform text mining to further investigate the corpus. This resulted in clusters and cluster descriptions (in terms of keywords) that we combined with the manually created
Fig. 2. Big picture of the research.
Int. J. Info. Tech. Dec. Mak. 2020.19:97-126. Downloaded from www.worldscientific.com by 146.110.64.33 on 11/18/20. Re-use and distribution is strictly not permitted, except for Open Access articles.
taxonomy. The outcome of this phase is the initial BA taxonomy that highlights the latest research directions and trends.
Next, we apply a semi-automatic method, using our semantic text mining solu- tion, to enrich the initial taxonomy (step 5 in Fig.3). In this phase, we use our semi- automatic text mining solution, called ProMine.32Finally, we validate the resulting taxonomy (step 6 in Fig.3).
Section3.1.1will detail the research steps.
3.1.1. Corpus preparation
Corpus building in general includes selecting the relevant research domain, publi- cation source and period. Our domain of interest is BA; we select the Decision Support Systems and Electronic Commerce journal as the source for the corpus. The choice of the corpus to comprise papers published by this journal was made because it is a leading journal in the ¯eld (as shown by being ranked in SCImago Q1 category
Fig. 3. Research steps.
Int. J. Info. Tech. Dec. Mak. 2020.19:97-126. Downloaded from www.worldscientific.com by 146.110.64.33 on 11/18/20. Re-use and distribution is strictly not permitted, except for Open Access articles.
from the beginning of 2000) that often publishes BA research, and, furthermore, one with a solid expert base and, among journals in the decision-making ¯eld, the best impact factor in 2017 and the highest number of Scopus citations. We apply a semantic text mining approach as a novel method of content analysis, relying on 42 volumes of the journal published between December 2010 (Volume 50) and November 2016 (Volume 91) that comprised 590 papers. The corpus included abstracts and keywords from the previous 5 years; we used the selected papers to build a MySQL database that supported a structured description of papers' metadata. In text mining, it is common to use a corpus based on abstracts and keywords, as such metadata help identify the primary message of each paper. Several researchers suggest this approach, e.g., O'Mara-Eves et al.33 propose a (semi)-automated text mining approach to screening in a systematic review. Thomas et al.34 propose this approach in automatic term recognition (ATR), while Guanet al.35follows a similar approach in the ¯eld of production research.
3.1.2. Visual analysis of the corpus
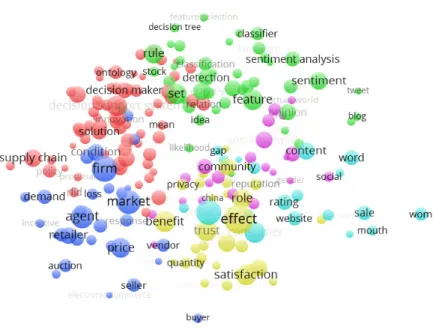
The second step of research involves a visual analysis of the corpus. Such an in- spection helped us explore the primary segments of topics and facilitated further content analysis, e.g., clustering. It helped us analyze and explore the primary areas of BA research. It allowed us to create bibliometric maps and facilitated easy-to- interpret displays of large text-based maps.36 We apply VOSviewer37 to carry out visual analysis. VOSviewer presents a network map and a density map based on the preprocessing of the corpus content. A density visualization provides us with infor- mation on the possible primary groups/classes of terms. Such information is useful in the next phase (clustering) for identifying the possible number of clusters, and for taxonomy development. Network visualization (Fig. 4) and density visualization provided six primary segments. The parameters we used were full-counting (all occurrences of a term were counted in a corpus), with the minimum number of occurrences of a term set at 10 (resulting in 13,705 terms in our study); the relevance score is created, and the most relevant 60% of terms are selected (in our case, 251 terms remained). The segment to which it belongs (Fig. 4) determines an item's color. An item's label size and circle size depend on its weight.37 Finally, selected terms are veri¯ed manually, resulting in the deletion of irrelevant terms.
3.1.3. Clustering of corpus content with text mining
A visual preliminary analysis of applying VOSviewer to the corpus resulted in six major segments. We use this information to build a text mining process in order to cluster the corpus content and obtain a corpus description. After clustering the corpus, the \bag-of-words representation" provided the clusters' descriptions. In the
\bag-of-words representation" approach, a text document is represented by the set of words it contains. Such an approach is common in text mining research.38,39 In general, document preprocessing includes such varied natural language processing Int. J. Info. Tech. Dec. Mak. 2020.19:97-126. Downloaded from www.worldscientific.com by 146.110.64.33 on 11/18/20. Re-use and distribution is strictly not permitted, except for Open Access articles.
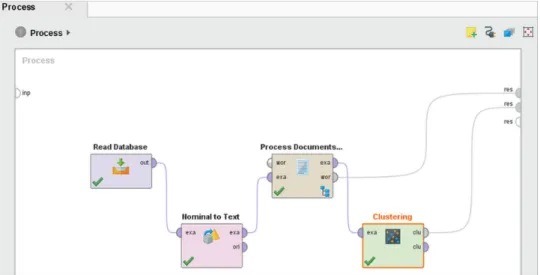
(NLP) and text mining techniques, as tokenization, removal of stop words, stemming or lemmatization, part-of-speech (POS) tagging, and frequency count.40,41The text mining process is carried out using RapidMiner, a popular data science platform with advanced text mining functionality.42,43RapidMiner provides a GUI-based platform for all data scientists. The core open-source code is available to expert data scientists who prefer to develop programs on their own. Gartner named it a leader in the 2017 Gartner Magic Quadrant for data science platforms,44 while the Forrester Wave report also recognized its leading position in predictive analytics and machine learning in 2017.45The steps in our text mining process were as follows: read data- base (i.e., read the corpus content in the form of abstracts and keywords from the MySQL database), nominal-to-text (i.e., prepare text from the database output), process documents (document preprocessing), and clustering (Fig.5).
Content preprocessing is carried out during the \process document" step. This step supported clustering and made it possible to determine the distance between content elements (in our case, the abstract, and keywords). We apply k-means clustering during the text mining process, wherek was six, according to the visual analysis of the corpus in step 2. The k-means clustering algorithm is a popular unsupervised learning algorithm, using a set ofk representatives, around which the clusters are built. One challenge arising during its application involves determining in advance the value ofk, the number of clusters. To this end, we use visualization, as described in the previous section. The step \process document" included tokeniza- tion, ¯ltering of stop words, stemming and ¯ltering tokens by length. Tokenization (i.e., sentence segmentation) involves segmenting unstructured text into tokens or words, used as the processing units during the subsequent steps.46 The process of
Fig. 4. Network visualization.
Int. J. Info. Tech. Dec. Mak. 2020.19:97-126. Downloaded from www.worldscientific.com by 146.110.64.33 on 11/18/20. Re-use and distribution is strictly not permitted, except for Open Access articles.
¯ltering stop words removes words that have no semantic content relative to a speci¯c domain. Stemming methods transform the words into their standardized forms, e.g., by removing the su±x \ing" from verbs, or other a±xes. A stem is a natural group of words with equivalent (or very similar) meanings. Several algo- rithms, e.g., the snowball algorithm we applied,47are available for stemming, with most designed for texts in English.
3.1.4. Initial taxonomy
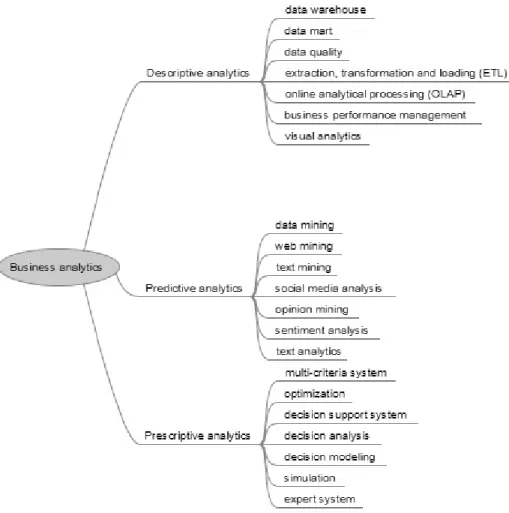
The initial taxonomy is a combination of a manually created taxonomy and the result of the text mining process. Figure6 presents the manually created taxonomy for BA, prepared by us and based on a review of literature and discussions with experts. Experts from academia, software companies working with BA, and con- sultancy companies were consulted. Our research emphasizes taxonomy development and maintenance; hence, we did not attempt to prepare a comprehensive taxonomy.
The primary ¯elds of BA are descriptive analytics, predictive analytics, and pre- scriptive analytics, as mentioned in Sec.2; hence, these are the subcategories of our BA taxonomy. Holsappleet al.2emphasizes the descriptive/explanatory, predictive, and prescriptive BA categories, while Refs.17and18apply the same grouping of BA solutions.17,18 Descriptive analytics refers to knowing what happened and what is happening in an organization. In this situation, the business problem is well-de¯ned.
It involves business reporting (OLAP reports are typical), dashboards, scorecards, business performance management, data warehousing technology, data marts, ETL (extract, transform, load), data quality solutions, and visual analytics. Recently, visual analytics have gained prominence due to rapid development and the prolif- eration of self-service business intelligence solutions, e.g., Tableau and PowerBI.
Fig. 5. Text mining process steps in RapidMiner.
Int. J. Info. Tech. Dec. Mak. 2020.19:97-126. Downloaded from www.worldscientific.com by 146.110.64.33 on 11/18/20. Re-use and distribution is strictly not permitted, except for Open Access articles.
Predictive analytics aims to determine what will happen in the future, and why. It refers to a group of methods that use historical data to predict a speci¯c target variable in the future. This category of analysis involves applying statistical tech- niques, machine learning, data, web, and text mining. Well-known predictive methods include regression and neural networks.18,19,48 Opinion mining and senti- ment analysis have become popular recently with the proliferation of Web 2.0 initiatives. In Web 2.0, the focus is on user-generated content, with social media and social networking (e.g., Facebook) being the key areas. The resulting large amounts of content are very valuable to decision makers, as they can identify the customer's needs and opinions without the use of comparatively bothersome traditional tech- niques, e.g., surveys and questionnaires. Sentiment analysis and opinion mining are sometimes used interchangeably.18,49–51 Liu and Zhang49 de¯ne them as \the computational study of people's opinions, appraisals, attitudes, and emotions toward entities, individuals, issues, events, topics, and their attributes."
Fig. 6. A manually prepared taxonomy.
Int. J. Info. Tech. Dec. Mak. 2020.19:97-126. Downloaded from www.worldscientific.com by 146.110.64.33 on 11/18/20. Re-use and distribution is strictly not permitted, except for Open Access articles.
Prescriptive analytics is de¯ned by questions \what business should I pursue, and why." It is an emerging ¯eld that has drawn more attention with the advent of big data science. This analysis attempts to examine various courses of action in order to determine the best possible business decision. Real-world decision-making problems are usually complex, semi-structured or unstructured, where decision-makers have simultaneously consider of all pertinent factors that are related to the problem.
Multiple-criteria decision making (MCDM) is the ¯eld that is devoted to the de- velopment and implementation of decision support tools and methodologies to confront complex decision problems involving multiple criteria, goals, or objectives of con°icting nature.92,93The goal here is to provide a decision or a recommendation for a speci¯c action. Typical technologies of this category are expert systems, simula- tions and decision support systems.
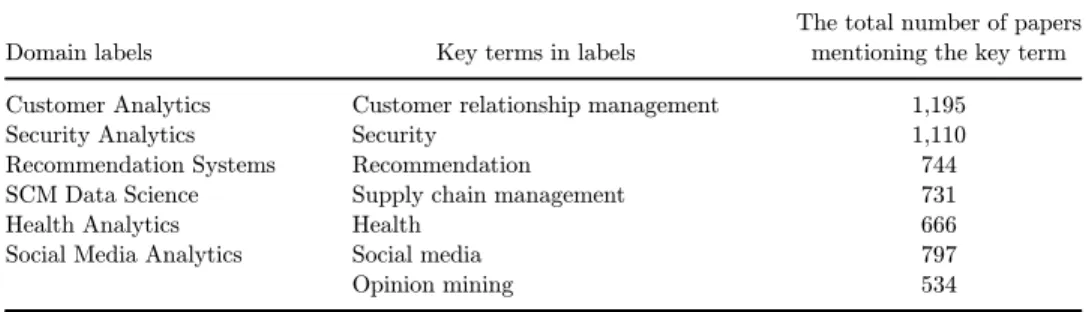
The text mining and clustering process described in step 3 (Sec.3.1.3) enriches the manually prepared taxonomy (Fig.6) with several new areas according to clusters, describing the latest research ¯elds and the most popular research domains. We put such ¯elds in the domain category (Fig. 7), with six clusters providing the sub- categories. Domain labels and their occurrences in the Decision Support Systems and Electronic Commerce journal (in January 2018) are summarized in Table 2. We name the clusters according to a set of descriptive representative words. Such rep- resentative words were prepared during the \bag-of-words representation" approach applied in text mining. The set of words was examined by experts to describe and name each cluster. The ¯rst cluster was labelled \social media analytics." Decisive words describing this category were as follows: sentiment, opinion, review, lexicon, emotion, text, social media, twitter, blog, feedback, tweet, positive, attitude, and vote, as shown in Fig. 7. This topic was decisive during the previous 5 years of BA history; hence, the result is in agreement with the literature and the latest software development initiatives in BA. Although sentiment analysis and opinion mining became a popular research topic beginning in approximately 2008, there are early related works.52–55 From the software development side, the majority of the data, web and text mining packages added opinion mining and sentiment analysis com- ponents during the preceding years. The second cluster is labelled \health analytics."
This result is somewhat surprising; however, it can be explained by a large volume of data created by this sector and the increase in applications of IoT devices in healthcare. The representative words are as follows: healthcare service, healthcare industry, healthcare information, hospital, clinic, examination, protocol, person and human. The biomedical community was very active in BA ¯elds, especially in data and text mining. This ¯eld is particularly interesting not only for academia but also for the general public. Recent biomedical advances help understand disease mechanisms, and support the development of mechanisms for, and approaches to the prevention and cure of diseases.56The third cluster is labelled \security analytics."
This is unsurprising, as security is a high-pro¯le application in BA17and is one of the top trends in business intelligence/BA.57The representative words are fraud, detect,
¯nancial fraud, and phishing, and from the BA side, data and text mining, ontology Int. J. Info. Tech. Dec. Mak. 2020.19:97-126. Downloaded from www.worldscientific.com by 146.110.64.33 on 11/18/20. Re-use and distribution is strictly not permitted, except for Open Access articles.
and semantic technology. Security issues are a major concern for most organizations due to a rapid growth in the number and types of risks and threats with increasing use of devices (mobile phones, smart devices, cars, etc.), more vulnerable than in the past.58 Companies have to protect their intellectual assets and infrastructure,
Fig. 7. Emerging research areas.
Table 2. Domain labels and their occurrences in the Decision Support Systems and Electronic Commerce journal (in January 2018).
Domain labels Key terms in labels
The total number of papers mentioning the key term Customer Analytics Customer relationship management 1,195
Security Analytics Security 1,110
Recommendation Systems Recommendation 744
SCM Data Science Supply chain management 731
Health Analytics Health 666
Social Media Analytics Social media 797
Opinion mining 534
Int. J. Info. Tech. Dec. Mak. 2020.19:97-126. Downloaded from www.worldscientific.com by 146.110.64.33 on 11/18/20. Re-use and distribution is strictly not permitted, except for Open Access articles.
requiring the prevention and detection of attacks. This \battle" occurs in cyberspace, where BA has a huge potential for the protection of information assets. Organiza- tions gather large amounts of security-related data, e.g., log ¯les, that have to be analyzed to detect security breaches. Due to the data-intensive nature of the ¯eld, BA technologies are widely applied to security in various areas. The key ¯elds include rule mining and clustering, criminal network analysis, spatial-temporal analysis, analysis of log ¯les, sentiment analysis, incident and cyberattacks analysis.17Using BA is mandatory for security organizations and agencies that collect large amounts of data on cybersecurity threats from several sources. Security analytics are chal- lenging due to multiple sources and the unstructured nature of data they provide.
Additionally, data are produced at a high rate (e.g., in the case of a log ¯le). IT audit, a related ¯eld, is also becoming data-intensive; one example is continuous assurance.
The latter is a combination of continuous monitoring by management, combined with continuous auditing of data streams and e®ectiveness of internal controls by an external auditor.59The fourth cluster is labelled \supply chain analytics" or supply chain management (SCM) data science. The representative words are supply, mar- ket, auction, negotiation, supply chain, retail, demand, product, ¯rm, supplier, risk, risk management, vendor, decision, and simulation. SCM data science is a relatively new term, de¯ned by Waller and Fawcett60as \the application of quantitative and qualitative methods from a variety of disciplines in combination with SCM theory to solve relevant SCM problems and predict outcomes, taking into account data quality and availability issues." Possible applications of BA in SCM and the related research questions have recently been discussed by several papers.60–63Trkmanet al.62ana- lyze the impact of BA use in various areas of the SC on the performance of the chain.
They prove that BA use in critical process areas could a®ect the SC performance.
Findings were con¯rmed in a large sample of companies in di®erent industries and countries. The ¯fth cluster is labelled \recommendation systems." The representa- tive words are recommend, recommendation system, ¯lter, pro¯le, collaboration, behavior, feature selection, and trust.
Recommendations, relied upon by decision-makers play crucial roles in situations requiring decisions. Recommendations help customize services and facilitate online shopping. In certain cases, e.g., that of Amazon.com,18recommendation systems are one of the major success factors.
The sixth cluster is labelled \BA in customer relationship management" or cus- tomer analytics in Holsapple's taxonomy.2The representative words are satisfaction, user satisfaction, trust, perceive, engagement, value, customization, market, cost, consumer, company, relationship, advertisement, and product. BA, e.g., data min- ing, has become an integral part of retailers' decision-making process and CRM activities. The goal of CRM is to build one-on-one relationships with customers.
Companies have large customer datasets built through interactions with customers that can be combined with demographic and socioeconomic attributes, creating a valuable opportunity to improve customer relations and to be more competitive.
Customer analytics can help companies improve understanding of customers' Int. J. Info. Tech. Dec. Mak. 2020.19:97-126. Downloaded from www.worldscientific.com by 146.110.64.33 on 11/18/20. Re-use and distribution is strictly not permitted, except for Open Access articles.
behavior, tailor direct marketing o®ers to customer preferences and design promo- tions. Data mining applications are common in this ¯eld; the typical ones are cus- tomer pro¯ling, churn analysis, association identi¯cation (cross-selling, up-selling) and identi¯cation of the most pro¯table customers.
3.1.5. Taxonomy enrichment with ProMine
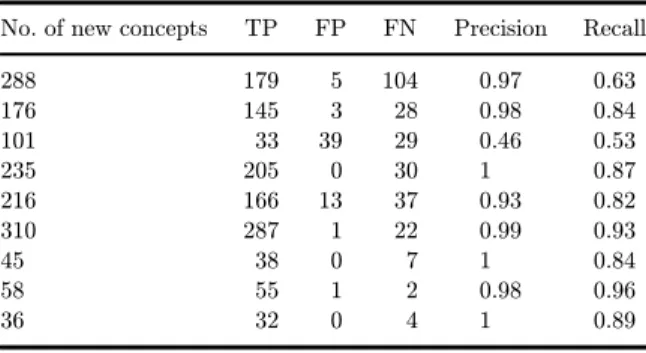
The fourth step of our research resulted in the initial taxonomy, which we enrich in step ¯ve. To this end, we use ProMine,32our OL text mining tool. ProMine performs two basic tasks, one being information extraction, i.e., extracting new concepts from the domain document corpus using several other semantic sources (WorldNet and Wiktionary), and the other being a categorization of such extracted concepts into an already de¯ned seed ontology with the help of a domain expert. In our experiments, we select a sample of keywords related to social media analytics. Included among these keyword lists was input into ProMine. To enrich the vocabulary of required knowledge elements, the selected keywords are linked to external lexical and se- mantic resources, e.g., WordNet64 and Wiktionary. We extract similar words (synonyms) from the resulting lexicons. For instance, in the ¯rst step, we took the word \sentiment" and entered it into ProMine. Using WordNet and Wiktionary, the programme provides a list of synonyms and related words (opinion, sentiment, per- suasion, view, thought, feeling, and sense) from the keyword \sentiment." To make the resulting new word list domain-speci¯c, a domain corpus is required that can include domain glossaries, domain-related journal papers, or any type of domain-related docu- ments. The concept enrichment and ¯ltration modules of ProMine automatically ¯lter out ambiguous words unrelated to the domain, and extract a set of keywords in the form of compound words by using the domain corpus. This re°ects our belief that concepts, expressed in compound or multi-word terms can be more informative than single words.
We obtained a large list of domain-speci¯c concepts. At the end of the ¯rst task, concept ranking and selection, ProMine applies a statistical measure based on the information gain to identify the concepts most relevant to the starting keyword. Using the keyword
\sentiment," we obtained 287 concepts. At the end of our experiments we obtained the respective lists of concepts (knowledge elements) for all keywords, with such words at that point ready to be used for ontology enrichment.
The second task of ProMine is semantic concept categorization for ontology enrichment. After extracting new concepts, ProMine puts them into an already developed seed ontology, in our case, into the initial taxonomy. To elucidate the conceptual relationships between such words and an existing initial ontology, Pro- Mine uses a novel semantic concept categorization method to enrich an existing ontology. This method classi¯es new domain-speci¯c concepts according to the existing taxonomy of the initial ontology. To categorize concepts, this method uses the knowledge of existing concept categories (taxonomy of classes) of the ontology together with the help of external knowledge resources, such as Wiktionary.32 We detail the validation of our taxonomy in discussion below (Sec.4).
Int. J. Info. Tech. Dec. Mak. 2020.19:97-126. Downloaded from www.worldscientific.com by 146.110.64.33 on 11/18/20. Re-use and distribution is strictly not permitted, except for Open Access articles.
4. Discussion
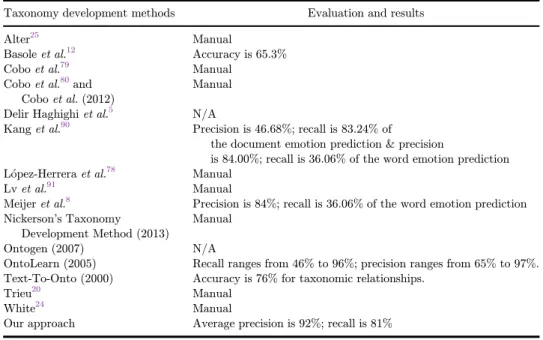
This paper provides a novel semi-automatic method of taxonomy development and maintenance in the ¯eld of BA using content analysis and text mining. First, we discuss the distinctive features of our approach in the context of the research gaps identi¯ed in Sec.2; then we compare the results provided with our solutions with the results of the investigated solutions from the literature (Fig. 4). We identify four research gaps in the literature review section, related to the typical learning sources used for taxonomy development, degree of user intervention, the targeted domain and the main techniques applied.
We found that the typical learning sources used for taxonomy development are research papers from the literature.12,24,25,78–80 A manual selection of papers from various journals showed that the number of selected papers vary depending on the source and these di®erences potentially a®ecting results. Our approach overcomes these potential biases through automatic extraction of papers. Additionally, we utilize the combination of various sources (literature, Wordnet, and domain corpus) in taxonomy development, which provides more enriched sources. User intervention, manual processes increase the subjectivity of the taxonomy development process.
There are purely manual processes20,24and automatic methods.8In a manual pro- cess, a domain expert's intuition and knowledge of the domain will a®ect results. Our proposed taxonomy development method is a semi-automatic one; it combines dif- ferent statistical, machine learning methods, and semantic technologies. We involve experts (manual process) where human judgment is needed, namely in the evaluation part, and apply automatic approaches when it is relevant and possible. We extract key concepts by using an unsupervised learning approach, performing clustering as in OntoGen,76where labels are assigned to clusters and regarded as concepts, while the terms in the cluster are considered its instances. In our work, domain concepts are extracted automatically without the involvement of a human expert. We enrich the existing ontology, while other approaches use the Protegesoftware program to ac- tually create an ontology.5The domains related research gap reveals that the BA domain is not targeted, we found only \business intelligence" as a similar domain to ours.20,24The main techniques used for taxonomy development are diverse, the most popular ones are statistical and machine learning methods. Science mapping analysis is also widely used.77–80 The main di®erence of our approach and the previously mentioned science mapping-based approach is that ProMine enriches the initial taxonomy, which we obtain in a semi-automatic way. The application of semantic technologies are also limited in the investigated solutions. Similarly, to Meijer's8 approach, we also use semantic precision, semantic recall and the taxonomicF-mea- sure in evaluation. However, our method is quite di®erent from ATCT. The di®erence stems from our method of clustering before concept extraction for taxonomy enrich- ment. Table3summarizes the evaluation of taxonomy development methods.
According to Table3manual evaluation, based on experts' evaluation is typical.
Our approach provides higher accuracy, than the other approaches where it is Int. J. Info. Tech. Dec. Mak. 2020.19:97-126. Downloaded from www.worldscientific.com by 146.110.64.33 on 11/18/20. Re-use and distribution is strictly not permitted, except for Open Access articles.
counted. Our recall is also higher than the majority of other known recall values. We identify the latest research ¯elds of BA domain (Fig.7). Holsappleet al.2mentioned supply chain analytics, crisis analytics (corresponding to security analytics in our result) and customer analytics domains in their BA taxonomy. These dimensions overlap with our results; additionally, our BA taxonomy development method pro- vides an approach to maintenance as well. The authors' ¯rst sample (descriptive analytics, predictive analytics, and prescriptive analytics) is the same as our sub- domains, yet the authors do not detail such categories. Their third dimension, technique, refers to the way of performing an analytics task. The authors mention multiple perspectives in this context, while following the approach that distinguishes speci¯c mechanisms used for analytics, which is similar to our taxonomy. To sum- marize, the authors' approach is conceptually higher-level, resulting in a meta-level synthesis of the BA ¯eld. A BI framework targeting business value that could be mapped to a taxonomy was provided.20
4.1. Taxonomy validation
There are various methods for taxonomy evaluation; additionally, we can also apply ontology evaluation techniques. Branket al.distinguish four categories of ontology assessment that are also relevant to our case.5,67 These are the \gold standard"
evaluation,8,68 the data-driven ontology evaluation,69 the application-based evalu- ation,5and evaluation by manual inspection. Another categorization of assessment methods, proposed by Yu et al.,70 suggests three primary methods: the \gold standard" evaluation, a task-based evaluation and criteria-based evaluation.
Table 3. Evaluation of the taxonomy development methods.
Taxonomy development methods Evaluation and results
Alter25 Manual
Basoleet al.12 Accuracy is 65.3%
Coboet al.79 Manual
Coboet al.80and Coboet al.(2012)
Manual Delir Haghighiet al.5 N/A
Kanget al.90 Precision is 46.68%; recall is 83.24% of
the document emotion prediction & precision
is 84.00%; recall is 36.06% of the word emotion prediction Lopez-Herreraet al.78 Manual
Lvet al.91 Manual
Meijeret al.8 Precision is 84%; recall is 36.06% of the word emotion prediction Nickerson's Taxonomy
Development Method (2013)
Manual
Ontogen (2007) N/A
OntoLearn (2005) Recall ranges from 46% to 96%; precision ranges from 65% to 97%.
Text-To-Onto (2000) Accuracy is 76% for taxonomic relationships.
Trieu20 Manual
White24 Manual
Our approach Average precision is 92%; recall is 81%
Int. J. Info. Tech. Dec. Mak. 2020.19:97-126. Downloaded from www.worldscientific.com by 146.110.64.33 on 11/18/20. Re-use and distribution is strictly not permitted, except for Open Access articles.