How do Digitalization and the Fintech
Phenomenon Affect Financial Decision-Making in the Younger Generation?
Éva Pintér
1, Péter Bagó
1, László Berényi
2, Levente Molnár
3, Nikolett Deutsch
1, Gergő Szigeti
4, Tibor Pintér
51Corvinus University of Budapest, Fővám tér 8, 1095 Budapest, Hungary, Eva.Pinter@uni-corvinus.hu, Peter.Bago@uni-corvinus.hu,
Nikolett.Deutsch@uni-corvinus.hu
2University of Miskolc, 3515 Miskolc-Egyetemváros, Hungary, szvblaci@uni- miskolc.hu
3Sony Europe B.V., Hungarian Branch Office, Váci út 144-150, 1138 Budapest, Levente.molnar@sony.com
4University of Pécs, Rákóczi út 80, 7622 Pécs, Hungary, Gergo.Szigeti@ktk.pte.hu
5Budapest Business School, Alkotmány u. 9-11, 1054 Budapest, Hungary, Pinter.Tibor@uni-bge.hu
Abstract: Generation Z, who can handle almost everything online, from the picture taken by their mobile phone to purchasing or transferring money. Therefore, using several tech solutions, they are not looking for traditional banking solutions, like the ones where physical presence is needed. Their wish is to obtain secure, fast, easy financial solutions, and services. Additionally, to ensure payments can be easily made and investments are available on hand. All of this being virtually available any time when it is needed, even from their mobile phones and also providing a high-level of personalization possibilities.
In our study, we surveyed risk attitudes governing individual investment decisions based on primary research conducted on a large sample size among university students. When surveying risk attitudes, we presented a group of university students studying in Hungary with questions of a test published in an international journal article by John Grable and Ruth H. Lytton (Grable – Lytton, 1999). Between early December 2020 and 15 January 2021, more than 2,000 students filled out our questionnaire. The results of the questionnaire show that risk attitude values among the group of Hungarian university students are in line with international experiences. Primary data collection will continue in the spring of 2021, and it will subsequently allow a comparison to be made between the attitudes to risk and investment of university students from different fields of study.
The composition of the questionnaire's respondents will make it possible to survey and compare the 'Z’ generation’s attitude with that of other generations.
Keywords: digitalization; fintech; investment; Grable-Lytton test; COVID-19 pandemic;
Finfluencer
1 Introduction
The outbreak of COVID-19 in 2020 also supported the need to understand how different technologies affected behavioral changes in terms of investment decisions and payment methods used. According to the research of Arner et al. [1], Fintech was already present a long time ago, starting from 1866 as version 1.0.
Fintech already had three stages, first one, 1.0 (1886-1967), focusing on infrastructure, globalization, as technology supported by telegraph, starting from the laying of the transatlantic cable (1866) and in time Fedwire in the USA (1918) to support the rapid transmission of financial information across borders. All these rely on old technologies like telegraph or Morse code transmissions.
The second stage of Fintech, 2.0 (1967-2008), was the period, transformation of analog to digital. The first hand-held calculator had been developed, first ATM had been installed by Barclays bank in 1967. In terms of payments, today's Banker's Automated Clearing Services (BACS) base had been established as Inter- Computer Bureau in 1968 and also Clearing House Interbank Payment System (CHIPS) within the US in 1970. To further improve domestic and also borderless communication related to payments Society of Worldwide Interbank Financial Telecommunications (SWIFT) had been established in 1973, which is still the most commonly used protocol between financial institutions for cross-border transfers. Within the same time frame with the rise of "digital calculators,”
computers, and also having the internet spread across the globe further linking sites and increasing the speed of communication, online banking and e-commerce got heavily expanded and also by the beginning of the 21st Century the banking processes, interactions, both internal and external got fully digitized. This flourishing stage of Fintech ended with the Global Financial Crisis in 2008 after the general public developed a distrust over the traditional banking system.
Due to the general opinion against traditional banking and also taking slowness and prices into consideration the next stage of Fintech needed to be delivered, called 3.0 (2008-Current), which includes an era of further innovations, born of start-ups and the build of a changed financial system, in line with corporate competitiveness [35]. This period integrates the release of Bitcoin, a blockchain technology-based decentralized cryptocurrency, which is a digital or virtual currency that is secured by cryptography. Also, within the last couple of years, the widespread of smartphones and internet accessibility for millions of people triggered several new financial and payment solutions like Google Wallet, Apple Pay but also born and extensive growth of localized payment solutions like WeChat Pay or Alipay in China. Based on EY's Global Fintech study [4], it is
visible that developing countries, like China or India, due to the low spread of banking infrastructure, were and are more open and more developed to new fintech solutions on personal but also in company levels.
As a summary, we reached a time when money in some cases already lost its physical presence and had been digitized. Meanwhile, the role and functions of banks or financial institutions had evolved to the point, where the world economy would be dysfunctional without them. This development is not only reflected in the tangible technical acquis, but also services that by now became natural, such as a simple bank account management, or payment by credit or debit card. Today, we reached the point where the physical presence of credit or debit cards is not even needed, it can easily be replaced with a mobile phone using NFC technology.
Generation Z, or even further the Alpha Generation, who can handle almost everything online, from the picture taken by their mobile phone to purchasing or transferring money. Therefore, using several tech solutions, they are not looking for traditional banking solutions, like the ones where physical presence is needed.
Their wish is to obtain secure, fast, easy financial solutions, and services.
Additionally, to ensure payments can be easily made and investments are available on hand. All of this being virtually available any time when it is needed, even from their mobile phones and also providing a high-level of personalization possibilities. Due to various regulations and increased customer expectations, the main goal of the FinTech companies is to develop services and technologies with long-term potential. For people, the primary device used to surf the Internet is no longer a personal computer or laptop today – instead, it is their smartphone.
The role of various digital wallets (WeChat Pay, Ali Pay, Apple Pay, Google Pay) had grown to such an extent that the number of transactions initiated through these systems exceeded one trillion – one thousand billion dollars, in 2019.
2 Fintech Innovations
The spread of COVID19 across the globe hardly impacted economies not only in terms of the environment but also it is expected to drive a change also related to payment habits. This transformation was already under way before the pandemic, the absence of a requirement to key in PINs and/or codes has made contactless payments more popular, especially via digital wallets.
The banks behind the card schemes are themselves under threat from a wave of neobanks, or digital-only banks such as Revolut, N26, and Monzo. Unheard of ten years ago, more than 20% of US households now use neobanks, with a further 8.8% planning to open neobank accounts this year [6]. Faced with such competition and supporting an unsustainable cost base, Europe's "bricks and
mortar" financial institutions are reducing in number, and their branch networks are slowly declining as internet banking becomes the preferred way to the bank.
Younger consumers born after 1998, who have grown up with the internet and digital technologies, overwhelmingly prefer contactless payments and remote payments to the traditional use of cash or cards – though to provide a note of calm, debit cards remain Europe’s preferred way to pay across all age groups [6].
Having mobile commerce sales expected to grow even further to $3.56 trillion by 2021, e-commerce store owners can no longer afford to neglect the importance of having a mobile-optimized online store to attract customers and grow their business [13].
Based on McKinsey’s Global Payments Report (2020) within the last ten years the cash usage had dramatically decreased. One of the areas supporting digitalization in terms of payment habit changes was mobile and smartphone device functionality growth but also their availability. As stated by BankMyCell the number of smartphone users increased to 3.5 billion also if considering smart and feature phones together in 2020 it is already at 4.78 billion which compared to the world's population is 61.04% [12].
Another area needed for changes in terms of technology was the coverage of the internet. Within the last 20 years, the spread of the internet as visible in Table 1 below had shown in some cases even a 5-digit growth. The coverage and the ratio to the overall population is showing a significant ratio unseen before.
Table 1
TOP 10 Countries with the highest number of internet users
Internet Growth
Internet users vs Population
# Country or Region 2020 Q1 2000 Q4 2020 Est. 2000 Est. 2000 - 2020 2020 Q1
1 China 854 23 1,439 1,283 3,796% 59%
2 India 560 5 1,369 1,053 11,200% 41%
3 United States 313 95 331 282 329% 95%
4 Indonesia 171 2 274 212 8,563% 63%
5 Brazil 149 5 212 175 2,981% 70%
6 Nigeria 126 0 206 123 63,039% 61%
7 Japan 119 47 127 128 252% 94%
8 Russia 116 3 146 146 3,753% 80%
9 Bangladesh 94 0 165 132 94,199% 57%
10 Mexico 88 3 132 3 3,244% 67%
2,591 183 4,401 3,537 1,415% 59%
1,983 178 3,396 2,608 1,115% 58%
4,574 361 7,797 6,145 1,267% 59%
Population (in million)
TOP 10 Countries Rest of the World Total World
Internet Users (in million)
Source: Internet World Stats, 2020 (https://www.internetworldstats.com/top20.htm)
As for mobile payments, within the last ten years, this segment increased significantly. However, across the globe the trend is moving in the direction of a cashless society, some countries were more adaptable to this change than with others. On one hand, the delivered solutions were mainly driven by availabilities, country specifics, like in the case of emerging countries where the fast spread of payment digitization was partly triggered by the under-banked country situation but also having all technologies supporting needed to be available.
2.1 Technology-driven Regulation or Regulation-driven Innovation?
Information and communication technologies (ICT) affect people's everyday lives in many ways, both at work or home, for example, when communicating or buying goods or services online or through new FinTech innovations even at the point of sale. EU policies range from regulating entire areas such as e-commerce to trying to protect an individual's privacy. The development of the information society is, therefore, regarded by many as critical for providing the necessary conditions to promote a modern and competitive economy.
The European Commission (EC), and the European Central Bank (ECB) working with the Eurosystem, created the Single Euro Payments Area (SEPA).
The Eurosystem is supported by the European Payments Council (EPC), which is charged with bringing together the European payments industry. SEPA enables citizens, companies, and other economic actors to make and receive payments in euros (EUR) between and within national boundaries in Europe with the same basic conditions, rights, and obligations, regardless of their location [9].
In 2007, the EU had set up common rules for payments with the adoption of the first payment services directive (PSD 1).
The payment services directive established the same set of rules on payments across the whole European Economic Area (European Union, Iceland, Norway, and Liechtenstein), covering all types of electronic and non-cash payments, such as
• credit transfers
• direct debits
• card payments
• mobile and online payments.
The directive laid down rules about the information that payment services providers have to give to consumers and about the rights and obligations linked to the use of payment services. Besides it also introduced a new category of payment service providers other than banks – the so-called 'payment services' and also laid the groundwork for the single euro payments area. This has increased competition and choice for consumers.
In 2015 the EU adopted a new directive on payment services (PSD 2) to improve the existing rules and take new digital payment services into account.
The directive became applicable in January 2018. It includes provisions to
• make it easier and safer to use internet payment services
• better protect consumers against fraud, abuse, and payment problems
• promote innovative mobile and internet payment services
• strengthen consumer rights
• strengthen the role of the European Banking Authority (EBA) to coordinate supervisory authorities and draft technical standards
The directive is part of a legislative package that also includes regulation on multilateral interchange fees. Together, the regulation and the second payment services directive,
• limit the fees for transactions based on consumer debit and credit cards
• ban retailers from imposing surcharges on customers for the use of these types of cards
Regulatory initiatives such as open banking and the EU’s second Payment Services Directive (PSD2) are helping open doors to further payment innovation.
These initiatives allow third parties to facilitate payments from customers’
accounts. The EU’s second Payment Services Directive (PSD2) goes farther by making consumer banking data available to third parties with proper authorization from consumers where financial institutions have historically controlled direct payments between consumer and business bank accounts. PSD2 and similar initiatives open the door for FinTech competitors to also offer these services [10].
Regulatory efforts have an overall aim of facilitating safer payments, like the provisions of PSD2 that require Strong Customer Authentication (otherwise known as SCA) for all electronic transactions in the European Economic Area.
Tokenized credentials, multifactor authentication, and Dynamic Linking technology offer additional protection to consumers. PSD2's authentication mandates may also help to replace screen-scraping methods by FinTech companies with direct API access to authorized customer data. This API access would open up new possibilities within the checkout experience. Merchants will have the ability to present shoppers with a view of their available bank accounts including their account balances, to select their most desirable payment source.
Funds can then be transferred through ACH for near-instant access between business and consumer [5].
Besides regulations, the need for standardization also arose. Before the arrival of ISO 20022, there were many different standards used by all parties involved in the payment communication chain which was not as efficient as it should have been.
European Payments Council (EPC) providing SEPA data formats had been developed into a global open standard, named ISO 20022 by International
Organization for Standardization (ISO). It aims to specify the formats of the data of a transaction (credit transfer or direct debit) appearing within IT systems enabling proper processing done by all the different parties. ISO 20022 is not just a set of message standards but also a recipe proposed by the ISO to develop message standards for all domains of the financial industry [11].
Although standardization of communication and also implementation of regulations are in place within Europe several other initiatives had also been started recently. In 2019 six mobile wallet service providers, Austria's Blue code, Helsinki-based ePassi, Spanish payments app Momo Pocket, Pagaqui of Portugal, Finland's Pivo, and Oslo-based Vipps, all together resulted in a five million user base and 190.000 merchant network, teamed up with Alipay to further develop their systems adopting unified QR code payments providing to both continental and Chinese travelers. Being interoperable and utilizing QR codes, the system could bypass the networks of global schemes like Visa and Mastercard, as well as banks, which will result in quick and most importantly cost-effective implementation [3].
3 Hungarian Scope in Digital Attitude
Even though the high differentiation regulators are putting hard efforts onto some sort of harmonization through directives, like PSD2, related to fees but also related openness of the payment network, further enabling FinTech innovations.
Besides the infrastructure related to connectivity, there had been enormous changes within the payment sector as well. Based on the statistical data from Hungarian Bank Association (HBA), as seen in Figure 1, the number of physical stores accepting card payments had doubled within the last 10 years, showing an unstoppable upward trend, but also beside the high number of stores, obviously, POS terminal numbers also increased heavily.
In terms of regulations Central Bank of Hungary (CBH) is working hard on easing and further developing the country's payment system.
The new era within banking, PSD-2 in Hungary had come into effect from 14th Sept. 2019 having for some of its elements, an extended 12-month grace period given to rolling out. This initiative aims to further strengthen security, enable 3rd parties to attend to finance services, also provide guidelines, standards about electronic communication between parties further enabling end-user authentication via even email addresses and triggering cost reduction due to the above and transparent methodologies.
Figure 1
Number of physical stores accepting card payments via normal and contactless POS terminals Note: negyedév = Quarter
Source: Central Bank of Hungary, 2020 Unifying the EU banking market, increasing competition among new players, and accelerating, promoting technological developments PSD-2 provides the opportunity to introduce new, modern and secure services for new financial market participants under a simplified procedure. These services may include current account-based electronic payment solutions (PIS), card-based payment instruments (CIS). In addition, new entrants may also develop new credit rating procedures, agency and sales models, lending processes, or other future-proof financial services even using technological advancements, like artificial intelligence (AI).
In 2020, the Immediate Payment System (IPS) had been launched supporting money transfers happening 24/7 in a max of 5 seconds.
The trend of card payment habits of Hungarian people was showing a significant increase both in value and number of transactions, The purchases done on the internet were reaching even higher peaks [25].
Research conducted by EFISZ, having 1.000 respondents, had shown that due to pandemic 35% of the participants had changed their payment habits onto digital.
Besides, 75% had answered they heard about the IPS launched in March 2020.
Still in terms of payment preferences cash is the one leading but also the card payment segment had grown both contactless (62% in 2019 changed to 79% in 2020) and regular payment types (57% in 2019 changed to 66% in 2020). Besides, online payment by card had grown a lot (36% in 2019 vs. 58% in 2020) also
mobile payment had shown the same increase in time (19% in 2019 vs. 40% in 2020). Another interesting increase was shown on prepaid cards like Revolut is providing, which grew from 14% to 25% this year. This growth is also visible in the increase of Revolut’s user number which in 2019 had reached 250.000.
Besides all previous market research done it is obvious that the outbreak of the COVID-19 pandemic within 2020 will further change consumer habits. In addition to several government actions at both public (physical distancing measures, limits on business activity) and private (anticipatory and causal shifts in consumer and commercial behavior) levels, there were several others also impacting customer behavior.
4 Research Method and Results on Financial Habits
The database we created is the summary result of a questionnaire querying more than 3500 students learning in Hungarian higher education. We aim to profile the complex financial, risk, and digital attitudes of this population. To build up a complex profile of the study population, 11 research dimensions were identified and a questionnaire survey was chosen to explore them. To design the questionnaire, a five-step iteration process was created, which after two iteration rounds eventually resulted in 51 questions. Our questionnaire is closed questions, but in some cases, we used multiple-choice questions and a 5-point Likert scale.
The questionnaire was administered using Qualtrics Online Questionnaire Software. The questionnaire was launched on 29. November 2020 and is still being implemented.
We applied Grable and Lytton's test measuring the level of financial risk tolerance assesses the financial risk attitude of respondents by assigning scores.
The questions of our test do not deviate from the questions included in the study referenced above which the co-authors published in 1999. The revised version of the test published in 1999 assessing risk attitude has of course been used subsequently as a foundation for several scientific studies. Professional literature has widely discussed the assessment of risk attitudes and the examination of the drivers behind it. Kuzniak et al. [20] performed a new test of the corrected, revised model based on their primary research, conducting a year-long retrospective review.
Outreville’s study published in 2014 [22] examined individual components of risk aversion, risk behavior, and attitudes to insurance segment and services, in a broad system of correlations. Schildberg-Hörisch's study published in 2018 [26] attempts to find an answer to the overarching question, i.e. how stable in time may risk attitudes and preferences be considered. According to the essence of her study, the general understanding in economics that individuals' risk preferences are stable
needs to be revised, as it is more typical, based on her findings, that individuals, by specific life situations, are sometimes more open and sometimes less open to making high-risk decisions. Meanwhile, when assessing financial risk tolerance, considerations must also be made for the role that the so-called biopsychosocial factors and environmental factors play in creating risk attitudes [27]. These factors, according to the authors, may include age, gender, race, birth order, self- esteem, personality type, sensation seeking, financial satisfaction on the biopsychosocial side; and income, networth, financial literacy, home ownership, educational attainment, family status on the environment side. Only after these factors have fully been surveyed can we establish a stable assessment of financial risk tolerance.
In their work, Magendans et al [21] examined psychological factors which financial market regulators should pay attention to when assessing risk tolerance.
They found that the so-called buffer savings created to cover losses may serve as a starting point for future studies as this was what they associated the highest significance with during their primary research. Kannadhasan’s study [19] looked at retail investors exclusively to determine which factors from the gender, age, marital status, income, occupation, and qualification of the investors may have significance concerning risk tolerance, these factors are very similar to the biopsychosocial and environmental factors presented earlier.
The reviewed literature items we introduced above, therefore, introduce in general the motivations and drivers behind financial risk attitude, and they draw up a general picture by applying statistical analytical methods, descriptive literature review methodology, and behavioral economics paradigm to the question.
An expanding literature base indeed means that authors of individual studies only elaborated on some of the sub-questions. Such factors may include national affiliation and gender, social, demographic status, too.
Jianakoplos and Bernasek [18] examined risk-taking levels on an international sample based on age cohorts, distinguished by year of birth. Lawrenson and Dickason-Koekemoer’s study published in 2020 [28], for example, worked out a theoretical model for assessing the specific financial risk tolerance of South- African female investors. The main finding of the study is that male investors are significantly more risk-tolerant than female investors, furthermore, educational attainment level is also an insignificant factor that does not depend on biological sex.
National affiliation is another important factor that creates identity in people's lives, this may, of course, impact risk attitude, too. A study carried out on an Egyptian sample called to our attention the significant role played by financial literacy [24]. A study analyzing a Chinese sample looked at how the willingness of individuals to take risks changes in that national medium under the influence of pressure, performance pressure [29], in that study university students were asked to fill out two tests, titled: Emotion Regulation Questionnaire and the Grable and
Lytton Risk Tolerance Scale Test. Another co-authored study [17] undertook to measure an interesting intercultural risk attitude. It examined the financial management behavior of people of Korean nationality living in the United States of America. Koreans reached higher, more reliable scores in terms of responsible financial management behavior than Americans. All in all, according to the study, financial knowledge showed a positive correlation with responsible financial behavior, Koreans were better in this respect. The location of the survey and the size of household income did not show a significant correlation with responsible financial behavior. A study by Rodrigues et al. [34] applied the Grable-Lytton test to a Brazilian sample, distinguishing between respondents of a Portuguese or English language background. According to the study, risk attitude is mostly linked to savings- and consumption-related expenses. A study examined Romanian financial risk-taking attitudes during the periods directly preceding and directly following the global financial crisis [14]. The conclusions drawn based on the Romanian sample were the followings: the crisis encouraged every social layer and age group to avoid risks, people with more in-depth financial knowledge responded more quickly to the crisis, women investors responded to the crisis more swiftly and with greater sensitivity, willingness to take risks decreased with the age.
Several authors assessed risk tolerance explicitly among university students [15, 23, 30, 31, 32, 33]. Bayar et al. in their study, published in 2020, surveyed the drivers behind individual investment decisions also in a university setting. In that work, demographic, income-related, qualification-related, and socio-cultural factors behind risk attitudes were surveyed in the entire personnel of USAK university.
Our database, which stands out from the literature because of the high number of its respondents, follows this line of literature research.
4.1 Perspective on Digital Transformation and Habits
All of the respondents had fixed or mobile internet subscriptions and also smartphones, out of which 96% owned laptops or PC and only half of them were using a tablet. In terms of preference, 88% of the respondents were chosen a smartphone as primarily used to surf the internet, and only 11% who better used a laptop or PC. When taking a closer look at the habits, what is the purpose, why people are using the internet it turned out the majority, more than half of those who responded were using the internet for social media and emailing, communication, and besides, other interesting proportion was given by that 36%
who are working from home, globally present changes within the environment caused by COVID19. Also, only 17% of the total participants were conducting regular online purchases and online banking is even worth it, having only 8%
proportion out of the total. The respondent's knowledge level of different types of payment methods seemed to be sufficient as the majority already heard about the
different ones. When looking at the preferred payment method, the picture was showing fragmented results, the majority, 41% were chosen contactless bank card payment method, the other significant portion had been given to online payments via bank card. If considering these two and adding up swiping bank card, like means of bank card payment methods it is visible that majority, 72% is putting his/her vote to bank card payment.
4.2 Financial Knowledge and Decision Making
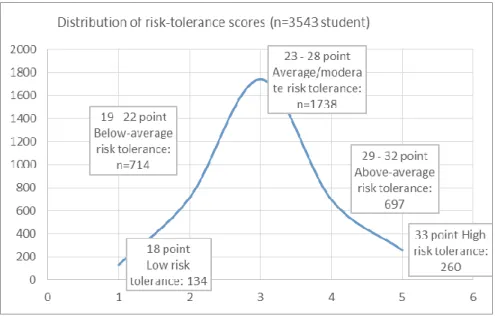
A total of 3543 people ‒ from the 18-23 age group ‒ completed the questionnaire, which allows reliable, unbiased conclusions to be drawn. Regarding the gender distribution of the respondents, 1630 men (55%) and 1913 women (45%) completed it. As for the distribution by place of residence: most (38%) completed the questionnaire from the capital. In second place are cities (32%), followed by county seats (17%) and the smallest group are those living in villages (12%).
Summarizing the responses of Generation Z, the most populous group became those with moderate risk tolerance. Within this, most of those who score 26 points, which is in the second half of the medium-level risk tolerance, are thus closer to the group of those who take a high level of risk than to the group of those with a low and moderate level of risk. (Figure 2)
There are 848 people in the group of low and moderate risk-takers, and 1738 people in the middle level, i.e., the most populous group, 697 people have a higher risk tolerance, and the remaining 260 people are highlighted as high risk-takers.
Based on a percentage distribution, this is as follows: low-rated and measured risk-takers 22 percent, medium-risk takers 52 percent, and those with above- average risk tolerances 26 percent.
Of those who completed the questionnaire, women proved to be much more cautious than men in most cases. This is confirmed by the question of what you mean when you hear the word risk. Here, almost as many men chose the
"opportunity" answer (42%) as they had "uncertainty" (47%). In contrast, women were the most likely to receive uncertainty (66%).
Overall, Generation Z in the questionnaire has the highest number of mid-level risk-takers. If the members of the group wants to keep their savings in investment forms with the same risk level as the risk tolerance attitude achieved on the G&L scale, stable financial knowledge is important, as this category no longer includes Hungarian government securities and low-risk investment units with stable returns, but also a variety of corporate bonds, stocks, medium and high-risk funds.
The other very populous group is the group of those who take higher risks than moderate risk tolerance. In their case, investment opportunities of a similar level are as follows: high-risk takers: leveraged ETFs, turbo warrants, call options, etc., exceptionally high-risk takers: option call, futures, investment credit, CFD,
leveraged currency, etc. These options already require extremely broad and secure financial knowledge.
Based on all this, we could expect that young people have stable financial knowledge, otherwise most of their money and savings will be at risk.
Figure 2 Risk tolerance levels
Source: Own survey on “Financial Literacy-Financial knowledge-Digital attitude” by Pintér, É.;
Bagó, P. (2020) Surprisingly, 45 percent of young people gave themselves a grade 3 on their financial knowledge and knowledge-based on self-reports, and only 6 percent rated their knowledge as outstanding. Considering gender, it can be said that men are much more confident in their knowledge than women. On the positive side, financial knowledge and experience increase with age.
Another question related to financial knowledge was "Who does/would you give financial advice to?". Of concern is the fact that 65 percent of young people who gave grades one and two to their financial knowledge, give financial advice to others. Of those who rated themselves as mediocre, 78 percent "help" others. And 89 percent of those with higher levels of financial literacy provide financial guidance to others.
It is also surprising that 25 percent of those with the least financial knowledge (grade 1, 2) make their financial decisions independently. Most of them decide on their finances with their families and few with a bank clerk or financial advisor.
Those with higher financial literacy are more likely to make their own decisions
and rely less on their families but are more likely to turn to professionals for advice.
We consider it important to examine the values given to the respondents on their financial knowledge and their score on the Grable-Lytton scale, as many things can be deduced from these. In terms of the results, remarkable and unsettling correlations emerge.
Twenty-five percent of those with low-risk tolerance gave themselves four and 4 percent gave themselves five.
For mid-level risk-takers, respondents are distributed as follows: 2 percent gave grade one (inadequate), 17 percent two, 48 percent three, 28 percent four, and 5 percent five.
However, in the case of those who took high and special risks, 2 percent gave grade one, 11 percent gave grade two to their knowledge, and 40 percent rated it as grade three. However, investment opportunities with a similar level of risk would require the consumer to have an even higher level of financial knowledge than a three, otherwise, they are exposed to very high financial risk.
While the young generation has an excellent digital attitude and average financial literacy, which could be said to require improvement, they are nevertheless confident in giving financial advice to those close to them. More remarkable is the discovery in the analysis of the data about who they take financial advice from beside their family. One might think it would be from banking professionals, but this is not the case. They look to the internet for guidance, to trusted financial experts, who are respected, and whose advice is valued. This is a new category of financial advice.
Figure 3 Financial advisory question
Source: Own survey on “Financial Literacy-Financial knowledge-Digital attitude” by Pintér, É.;
Bagó, P. (2020)
Chatbots are distrusted because they are impersonal, business analysts and bankers are not necessarily neutral enough. So the new financial influencers are personalities who can motivate young people while still providing them with reliable information. This category can be made up of successful professionals and professionally experienced educators around them. In all of this, social media plays a big role in generating communication.
Summary
Digital innovations both at a global level but also in Hungary are impacting cash usage definitely, both payment methods are driving general cash consumption into a negative trend. On the other hand, card usage and other, QR based technologies are not linked to each other. Most probably within Europe or Hungary, there will be minor cannibalization QR code versus card payment as the QR service probably would be relevant within the area where not even card payment is available. The technology is there, internet availability had spread across the country, in terms of wired but also mobile subscriptions. COVID-19 pandemic is and will change a lot globally, in terms of consumer payment habits.
Research findings indicate that most young people today assume a trade-off between financial literacy and digital attitudes, and very few perceive the need for continuous development in both areas. Not only the transfer of experience to the family and parents, but education and the development of financial culture have and will play a big role shortly. Without it, financial services innovation will not achieve its goal for both banks and consumers.
Overall, Generation Z is willing to take risks, but moderately, they have criteria they adhere to. They are open to novelty, their digital attitude is appropriate or even outstanding, they rely on traditional forms of financial services and they welcome banking innovation. What they cannot solve there, they will find another solution. The critical challenge is how to reach this age group. Who should be the new "influencers" of the financial sector? Banks, education and the community have a role to play in providing credible, experienced professionals to develop the financial culture, knowledge and engagement of young people.
Acknowledgement
This work was supported by GINOP-2.2.1-18-2018-0010 References
[1] Arner, D.; Barberis, J.; Buckley, R.: The evolution of FinTech: A new post- crisis paradigm? Sydney: University of Hong Kong - Faculty of Law, 2015 [2] Baker, K.: The Hustle. Retrieved from The Story of How Venmo Was
Started, 2016, https://thehustle.co/how-venmo-started
[3] Brennan, T.: Six European mobile wallets to use Alipay's, 2019 https://www.alizila.com/six-european-mobile-wallets-use-alipay-qr-format/
[4] EY: Global FinTech adoption index. 2020
[5] FinTechzone: Bevezetés a PSD2 világába, 2020, https://fintechzone.hu/mi- a-psd2/
[6] Han, J.: eMarketer. Seven Charts: The State of Digital Banking in 2020, 2020, https://www.emarketer.com/content/seven-charts-the-state-of-digital- banking-in-2020
[7] Magyar Nemzeti Bank.: A pénzügyi tudatosság fejlesztése segíti a családok anyagi biztonságát is, 2020, https://www.mnb.hu/sajtoszoba/
sajtokozlemenyek/2020-evi-sajtokozlemenyek/a-penzugyi-tudatossag- fejlesztese-segiti-a-csaladok-anyagi-biztonsagat-is
[8] McKinsey: The 2020 McKinsey Global Payments Report, 2020 https://www.mckinsey.com/~/media/mckinsey/industries/financial%20servi ces/our%20insights/accelerating%20winds%20of%20change%20in%20glo bal%20payments/2020-mckinsey-global-payments-report-vf.pdf
[9] Pénzügyi Navigátor: Egységes Euró Fizetési Övezet (SEPA), 2017, https://www.mnb.hu/fogyasztovedelem/bankszamlak/szolgaltatasok/mi-az- egyseges-euro-fizetesi-ovezet-sepaPwc
[10] Pwc CZ: Market environment and implementation timeline, 2020, https://www.pwc.com/cz/en/odvetvove-specializace/bankovnictvi-a- financni-sluzby/ps2-v-kostce.html
[11] SWIFT:ISO 20022. Chichester, West Sussex: John Wiley & Sons, Ltd., 2020
[12] Turner, A.: How many smartphones are in the world?: Bankmycell, 2020, https://www.bankmycell.com/blog/how-many-phones-are-in-the-world [13] Vu, L.: Insights from Trending mCommerce Statistics, Simi Cart Blog.
2020, https://www.simicart.com/blog/m-commerce-statistics/
[14] Cristian, P.: Risk tolerance analysis: Romanian case before and during financial turmoil. Economics & Sociology, 2012, Vol. 5, No. 2a, pp. 11-23 [15] Gilliam, J., S.; Chatterjee, J. E.; Grable J.: Measuring the perception of
financial risk tolerance: A tale of two measures. Journal of Financial Counseling and Planning, 2017, Vol. 21 (2), pp. 30-43
[16] Grable, J.; Lytton, R. H.: Financial risk tolerance revisited: The development of a risk assessment instrument. Financial Sendees Review, 1999, Nr. 8, pp. 163-181
[17] Grable, J.; Hoo, S.: An Exploratory Framework of the Determinants of Financial Satisfaction. Journal of Family and Economic Issues, 2004, Vol.
25(1), pp. 25-50
[18] Jianakoplos, N. A.; Bernasek, A.: Financial risk taking by age and birth cohort. Southern Economic Journal, 2006, pp. 981-1001
[19] Kannadhasan, M.: Retail investor’ financial risk tolerance and their risk- taking behaviour: the role of demographics as differentiating and classifying Factors. IIMB Management Review, 2015, 27: pp. 175-184 [20] Kuzniak, S.; Rabbani, A.; Heo, W.; Ruiz-Menjivar, J.; Grable, J.: The
Grable and Lytton risk-tolerance scale: A 15-year retrospective. Financial Services Review, 2015, 24 (2015) pp. 177-192
[21] Magendans, J.: The Cost of Self-Protective Measures: Psychological Predictors of Saving Money for a Financial Buffer. 2016, University of Twente
[22] Outreville, J. E.: Risk Aversion, Risk Behavior, and Demand for Insurance:
A Survey. Journal of Insurance Issues, 2014, Vol. 37, Issue 2, pp. 158-186 [23] Ramudzuli, P. M.; Muzindutsi, P.-F.: Determinants of Financial and Non-
Financial Risk Tolerance among Students at Selected South African Universities. Foundations of Management, Vol. 10, No. 1, 2018, pp. 293- 302, https://doi.org/10.2478/fman-2018-0023
[24] Shusha, A.: The Mediating Role of Rational Buying in the Relationship between Financial Literacy and Financial Well-being. Research Journal of Finance and Accounting, 2017, www.iiste.org ISSN 2222-1697 (Paper) ISSN 2222-2847 (Online) Vol. 7, No. 4
[25] Central Bank of Hungary: Payment data.
https://www.mnb.hu/statisztika/statisztikai-adatok-informaciok/adatok- idosorok/xiv-penzforgalmi-adatok/penzforgalmi-tablakeszlet (06.06.2020) [26] Schildberg-Hörisch, H.: Are risk preferences stable? Journal of Economic
Perspectives, 2018, Vol. 32 (2), pp. 135-54
[27] Joo, S.; Grable, J. E.: An Exploratory Framework of the Determinants of Financial Satisfaction. Journal of Family and Economic Issues, 2004, 25(1), pp. 25-50, https://doi.org/10.1023/B:JEEI.0000016722.37994.9f
[28] Lawrenson, J.; Dickason Z.: A model for female South African investors’
financial risk tolerance, Economics & Finance 8(1), 2020, DOI:
10.1080/23322039.2020.1794493
[29] Li D.; Gao Q.; Liu J.; Feng Y.; Ning W.; Dong Y.; Tao L.; Li J.; Tian X.;
Gu J.; Xin D.: Knowledge, attitude, and practices (KAP) and risk factors analysis related to cystic echinococcosis among residents in Tibetan communities, Xiahe County, Gansu Province, China. Acta Trop. 2015, Jul;
147, pp. 17-22
[30] Hayoe, C.; Leach, L. J.: Differences in Spending Habits and Credit Use of College Students, Journal of Consumer Affairs, 2010, 34(1), pp. 113-133 [31] Martinez C.; Suissa S.; Rietbrock S.; Katholing A.; Freedman B.; Cohen
AT.; Handelsman DJ.: Testosterone treatment and risk of venous
thromboembolism: population based case-control study. BMJ. 2016 Nov 30; pp. 355-398
[32] Nonis, Sarath A.: Thinking Patterns: An Exploratory Investigation of Student Perceptions of Costs and Benefits of College Loan Debt. Journal of Financial Education, Vol. 41, No. 2, Financial Education Association, 2015, pp. 24-48, http://www.jstor.org/stable/24573677
[33] Kolnhofer-Derecskei, A.; Reicher, R. Zs.; Szeghegyi, A.: Transport habits and preferences by generations - does it matter regarding the state of the art? Acta Polytechnica Hungarica, 2019, 16 : 1, pp. 29-44
[34] Rodrigues, A. R.; Assef, J. C.; Lima, C.: Assessment of risk factors associated with falls among the elderly in a municipality in the state of Paraíba, Brazil. A cross-sectional study. Sao Paulo Medical Journal [online] 2019, Vol. 137, No. 05, pp. 430-437, https://doi.org/10.1590/1516- 3180.2018.0198120619
[35] Szerb, L.; Ulbert, J.: The examination of the competitiveness in the Hungarian SME sector: A firm level analysis. Acta Polytechnica Hungarica, 2009, 6 (3), pp. 105-123