MŰHELYTANULMÁNYOK DISCUSSION PAPERS
INSTITUTE OF ECONOMICS, CENTRE FOR ECONOMIC AND REGIONAL STUDIES, HUNGARIAN ACADEMY OF SCIENCES - BUDAPEST, 2019
MT-DP – 2019/2
Labor shares in the EU - sectoral effects and the role of relative prices
ISTVÁN KÓNYA – JUDIT KREKÓ – GÁBOR OBLATH
Discussion papers MT-DP – 2019/2
Institute of Economics, Centre for Economic and Regional Studies, Hungarian Academy of Sciences
KTI/IE Discussion Papers are circulated to promote discussion and provoque comments.
Any references to discussion papers should clearly state that the paper is preliminary.
Materials published in this series may subject to further publication.
Labor shares in the EU - sectoral effects and the role of relative prices
Authors:
István Kónya senior research fellow
Institute of Economics, Centre for Economic and Regional Studies,
Hungarian Academy of Sciences, University of Pécs and Central European University email: konya.istvan@krtk.mta.hu
Judit Krekó
research associateCentral European University and Institute of Economics, Centre for Economic and Regional Studies, Hungarian Academy of Sciences
email: kreko.judit@krtk.mta.hu
Gábor Oblath senior research fellow
Institute of Economics, Centre for Economic and Regional Studies, Hungarian Academy of Sciences
email: oblath.gabor@krtk.mta.hu
January 2019
Labor shares in the EU - sectoral effects and the role of relative prices
István Kónya – Judit Krekó – Gábor Oblath
Abstract
The paper studies the labor share among countries of the European Union, with a particular attention to newer member states of Central and Eastern Europe (CEEU). After discussing methodological issues in the computation of the labor share, we present various stylized facts at the country level, and also for broad sectors within the aggregate economy. We find that CEEU countries typically have lower labor shares, both in the aggregate and at the sectoral level. Structural change, while quite pronounced among the CEEU economies, plays only a minor role in the evolution of the labor share. The exception is agriculture, which for some countries have a sizable impact on the level and dynamics of the labor share - partly because of important measurement problems. We also document links between productivity, the relative prices of consumption and investment, and the labor share. In particular, we find that a significant part of the difference in conventionally measured labor shares between the more developed EU countries and less developed CEEU countries can be attributed to differences in relative prices. We discuss possible explanations, and show that given reasonable assumptions, a simple two-sector model is able to account for the main findings.
Acknowledgement:
This research was supported by the Hungarian National Research, Development and Innovation Office, project No. K-124808.
Keywords: labor share, development, labor productivity, relative prices, European Union
JEL classification: E24, J30, O11
Bérhányadok az EU-ban – az iparági hatások és a relatív árak szerepe
Kónya István – Krekó Judit – Oblath Gábor
Összefoglaló
A tanulmány a bérhányad alakulását vizsgálja az Európai Unió országaiban, különös tekintettel a közelmúltban bekerült közép- és kelet-európai tagállamokra (CEEU). Miután megvizsgáltuk a bérhányad számításának módszertani kérdéseit, különféle stilizált tényeket mutatunk be, amelyek országokra, valamint az aggregált gazdaságon belüli fő termelési szektorokra vonatkoznak. Ezek alapján azt találjuk, hogy a CEEU-országokban mind az aggregált, mind a szektorális bérhányadok alacsonyabbak. Bár a strukturális átrendeződés jelentős volt a CEEU-gazdaságokban, ennek csekély szerepe volt a bérhányad alakulásában.
A kivétel ez alól a mezőgazdaság, amely egyes országokban jelentősen befolyásolta a bérhányad szintjét és dinamikáját – részben a jelentős mérési problémák miatt. Megmutatjuk azt is, hogy empirikus kapcsolat áll fenn a termelékenység, a fogyasztás és beruházás relatív árai, valamint a bérhányad között. Azt találjuk, hogy a fejlett EU-országok és a kevésbé fejlett CEEU-országok szokott módon számolt bérhányada közötti különbség jelentős része a relatív árak közötti eltéréseknek tulajdonítható. Több magyarázatot is számba veszünk, és megmutatjuk, hogy realisztikus feltevések mellett egy egyszerű, kétszektoros modell reprodukálni képes a fő empirikus megfigyeléseket.
Tárgyszavak: bérhányad, fejlettség, munkatermelékenység, relatív árak, Európai Unió
JEL kódok: E24, J30, O11
Labor shares in the EU - sectoral effects and the role of relative prices
∗Istv´an K´onya† Judit Krek´o‡ G´abor Oblath§ December 2018
Abstract
The paper studies the labor share among countries of the European Union, with a particular attention to newer member states of Central and Eastern Europe (CEEU).
After discussing methodological issues in the computation of the labor share, we present various stylized facts at the country level, and also for broad sectors within the aggregate economy. We find that CEEU countries typically have lower labor shares, both in the aggregate and at the sectoral level. Structural change, while quite pro- nounced among the CEEU economies, plays only a minor role in the evolution of the labor share. The exception is agriculture, which for some countries have a sizable impact on the level and dynamics of the labor share - partly because of important measurement problems. We also document links between productivity, the relative prices of consumption and investment, and the labor share. In particular, we find that a significant part of the difference in conventionally measured labor shares between the more developed EU countries and less developed CEEU countries can be attributed to differences in relative prices. We discuss possible explanations, and show that given reasonable assumptions, a simple two-sector model is able to account for the main findings.
∗This research was supported by the Hungarian National Research, Development and Innovation Office, project No. K-124808.
†Centre for Economic and Regional Studies (Hungarian Academy of Sciences), University of P´ecs and Central European University
‡Central European University and Centre for Economic and Regional Studies (Hungarian Academy of Sciences)
§Centre for Economic and Regional Studies (Hungarian Academy of Sciences)
JEL codes: E24, J30, O11
Keywords: labor share, development, labor productivity, relative prices, Euro- pean Union
1 Introduction
There has been a great deal of interest in academic and policy circles in the evolution of the wage share of aggregate income, or the labor share in short. Many countries have experi- enced a sustained fall in the labor share, which gave rise to many alternative explanations (Karabarbounis and Neiman, 2014, Elsby et al., 2013, IMF, 2007, Alvarez-Cuadrado et al., 2018, Decreuse and Maarek, 2015a).
Our paper analyses the main developments in aggregate and sectoral labor shares in Central-European EU countries (CEEU), compared to developed EU countries in the 1995-2017 period. First, we discuss different concepts of the labor share, and highlight some methodological issues and compare different labor share indicators. We show that the unadjusted labor share indicator (which ignores mixed income) hinders cross-country comparison and the evaluation of labor share trends, since mixed income exhibits signif- icant trends and differs across countries. We also show that the labor share is especially hard to calculate for agriculture because the labor and capital income of farmers, who represent a major share of total employment in agriculture, is not reported separately. As the agricultural labor share - calculated with usual assumptions - is volatile and might have extreme values, we report results that exclude agriculture from the analysis when necessary.
Both the level and the dynamics of the labor share vary significantly across the CEEU countries. Nevertheless, some common characteristics can be observed. The labor share is lower on average in CEEU countries than in developed EU countries, both excluding and including agriculture. In addition, all sectoral labor shares are lower in CEEU countries.
The differences between the two country groups had increased up to 2011, but some convergence can be observed in the last few years.
Next, we analyze factors behind the observed differences in the level and dynamics of the labor share between CEEU and developed EU countries. As our sample period
can be characterized by significant sectoral transformation, first we look at the effect of sectoral changes on the dynamics of the aggregate labor share. The decline in the share of agriculture and the decrease in the agricultural labor share contributed to the decline in the aggregate labor share in many CEEU countries. However, when excluding agriculture from the analysis, we find that sectoral transformation does not add much to the aggregate dynamics in the non-agricultural labor share. Cross-country differences in aggregate labor shares are mainly attributable to differences in sectoral labor shares, while differences in sectoral composition play only a minor role.
It is well-known that the relative price of consumption (either in terms of GDP or investment) is generally lower in poorer countries. Given our result that within the EU the labor share increases with development, it is not surprising that we also find a positive correlation between the aggregate labor share and the relative price of consumption. In fact, if we control for this relative price, the labor share is no longer systematically related to development.
Based on these findings, we argue that relative price differentials need to be taken into account when comparing labor shares across countries. We construct a “corrected”
labor share indicator, which accounts for differences in the relative price of consumption.
The idea behind this measure is that when we think about the labor share as workers’
compensation, it is the price of consumption - as opposed to GDP - that matters. We find that in fact a significant part of the difference in conventionally measured labor shares between the more developed EU countries and less developed CEEU countries can be attributed to differences in relative prices. Finally, we document that within countries sectors with higher labor productivity tend to have lower labor shares.
Building on the recent literature (Hsieh and Klenow, 2007, Alvarez-Cuadrado et al., 2018), we show that a simple two-sector model with CES production functions and separate consumption and investment sectors can explain these stylized facts. The conditions that are required are the following: (i) underdevelopment is associated with lower productivities in both sectors, (ii) poorer countries are particularly unproductive in the investment good sector, and (iii) the elasticity of substitution between capital and labor is lower in the investment good sector.
An alternative, and possibly complementary, explanation for some of these findings is
the different exposure to foreign direct investment (FDI) at the country and sector level.
While we do not have the necessary data to analyze the effects of FDI at the sectoral level, we provide some preliminary evidence that countries that attracted more FDI have a lower labor share. Foreign investors usually have a large productivity advantage. The gains from higher productivity are shared between capital and labor, consequently sectors with a higher foreign penetration will be both more productive and have higher wages, but also a lower labor share.
The paper is organized as follows. In Section 2 we provide a brief overview of the differ- ent labor share measures used in the literature. We discuss some measurement issues, with a particular attention to agriculture. In Section 3 we present stylized facts on aggregate labor share indicators. In Section 4 we look at the role of structural change and sectoral composition in differences in labor shares across countries and over time. In Section 5 we document and study the relationship between the labor share, productivity, and the rela- tive price of consumption. In Section 6 we present a simple two-sector framework, which under some reasonable assumption can rationalize the main empirical findings. Section 7 presents preliminary findings about the role of foreign direct investment. Finally, Section 8 concludes.
2 Measurement issues
The labor share is defined as the part of national or sectoral income allocated to wages (labor), and it is calculated as the compensation of labor over value added. However, both compensation of labor and value added can be calculated in various ways. In the following, we summarize the main options and considerations behind the choice of a specific calcu- lation method. In addition to theoretical considerations, choosing a particular method is also influenced by data availability.
2.1 The treatment of mixed income
In separating total income into compensations of labor and capital, a problem arises with mixed income, i.e. the income of self-employed. Mixed income contains both labor and capital compensation and as the contribution of labor is not recorded separately, calcula-
tion of the labor share requires making an assumption about the composition. The options are the following.
Assumption 1. (Adjusted labor share) Hourly or yearly labor income of the self-employed equals the hourly or yearly labor income of employees (Jaeger, 2018; Gollin, 2002).
In this case
LS= COM P V A
EM P EM P E
where LS stands for the labor share, EM P is total persons employed, and EM P E is persons in dependent employment. The difference between the EM P and EM P E is the number of the self-employed. COM P denotes the compensation of employees, which contains employers’ contributions on top of gross wages and salaries. V Astands for value added.
The problem with this approach is that if the share of self-employed is very high and the assumption of equal earnings does not hold, this assumption may distort the results and can produce unrealistic labor share values, even above 100 % (as we show below for agriculture in some countries).
Assumption 2. (Labor share w/o mixed income) The labor share within mixed income equals the labor share within the rest of the economy.
LS = COM P COM P +GOS
As the equation shows, this amounts to calculating the labor share without mixed income, i.e. dividing compensation of employees with the sum ofCOM P and gross oper- ating surplus (GOS). This assumption is used for example in Valentinyi and Herrendorf (2008). However, this method requires separate data on mixed income, which is often not available, especially at the sectoral level.
Assumption 3. (Corporate labor share) The aggregate labor share can be well approxi- mated by the labor share in the corporate sector.
Some studies ((Elsby et al., 2013)) restrict attention to the corporate sector, where mixed income is not present. The obvious advantage of this specification is that splitting mixed income is not an issue. Disadvantages are that: (i) the corporate sector may not be completely representative of the full economy, either because self-employment is large or because the government sector is important, and (ii) the corporate labor share cannot be calculated at the industry level.
Assumption 4. (Unadjusted labor share) The labor share in mixed income is zero.
LS= COM P V A
Using the unadjusted labor share is usually motivated by limited data availability on mixed income and/or the number of self-employed. This measure was used in, for example, IMF (2007) and Orszag and Orszag (2015). However, if the share of the self- employed in total employment changes considerably in the sample period, trends in the unadjusted labor share (as mixed income is excluded only from the numerator, but not the denominator) can be misleading. Cross-country comparisons that are based on the unadjusted labor share are also not appropriate if the role of the self employed in the economy differs significantly across countries.
The corporate labor share and the labor share w/o mixed income (Assumption 2) partly overcome this bias as they do not require assumptions on mixed income. On the other hand, they only give a partial picture on the labor share in the total economy.
2.2 Value added
Value added in the denominator of the labor share can be calculated at basic prices (EUK- LEMS), market prices or factor cost (AMECO). Value added at factor cost can be written as follows:
V Af act=COM P +GOS+M I.
Value added at basic prices as given as
V Abasic=V Af act+ (OT AXproduction−OSU BSproduction),
whereOT AXproduction−OSU BSproduction denotes other taxes less other subsidies onpro- duction. Finally, value added at market prices is written as
V Amarket=V Abasic+ (T AXproduct−SU BSproduct)
=V Af act+ (OT AXproduction−OSU BSproduction) + (T AXproduct−SU BSproduct),
where T AXproduct −SU BSproduct denotes the balance of indirect (product) taxes and subsidies.
For a producer, value added at factor cost represents what a producer gets from the industrial activity. Value added at basic prices, in addition to the value added at factor costs, contains the balance of other taxes less other subsidies on production. Gross do- mestic product, evaluated at market prices also contains the balance of product taxes and subsidies (excise taxes, VAT) on top of basic price value added.
We calculate labor share usingvalue added at factor cost, which is essentially a measure of income and not output. It represents the amount remaining out of gross value added after the payment of all taxes on production and products and the receipt of all subsidies on production and product.
When the labor share is calculated as compensation of labor divided byvalue added at basic prices, one implicitly adds the balance of other production taxes and subsidies (and the depreciation) to capital. This can be seen by writing the value added at basic prices in the following form:
V Abasic =COM P +M I+GOS+ (OT AXproduction−OSU BSproduction).
Loosely speaking, if the denominator is value added at basic prices, production taxes are assumed to be paid by capital, or in case of net production subsidies, capital income is lessened by the amount of subsidies. In other words, this decomposition implicitly assumes that the production subsidy is given to labor. If extracting (adding) production taxes
(subsidies) from the basic price gross value added - that is, to divide the compensation of labor with value added at factor cost -, one assumes that the production tax (subsidy) is paid (shared) in the same share as the rest of the value added.
The balance of other production taxes and subsidies is negligible in most countries;
Sweden, France and Italy are exceptions. At the industry level, the balance is often sizable (negative) in case of agriculture, due to the considerable amount of production subsidies.
In these cases, labor shares calculated using basic price value added and value added at factor cost differ significantly (see Section 3).
Baseline measure Our baseline labor share indicator is calculated with Assumption 1, as mixed income at the industry level (necessary for applying Assumption 2) is not available. Our basic labor share indicator uses the number of employees and self-employed instead of hours worked mainly because of limited data availability for the latter. As discussed above, we use valued added at factor prices. For the aggregate labor share we also show and compare developments for the different labor share measures.
2.3 Agriculture
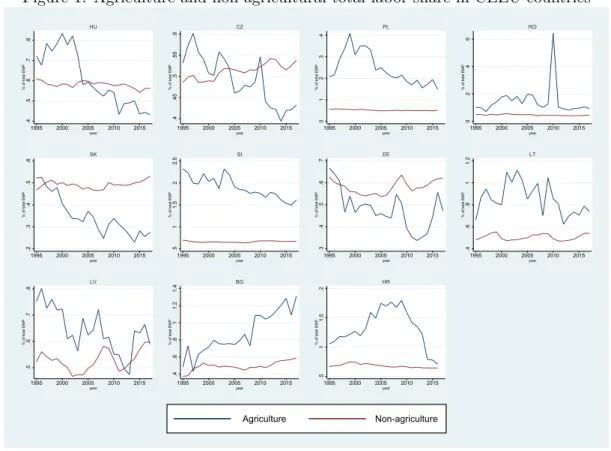
The labor share is much more volatile in agriculture than in other sectors. Occasionally the are are extreme values, sometimes above 100% (see Figure 1 for the CEEU countries).
These are related to some special characteristics of the agricultural sector. Here we discuss two major issues: agricultural subsidies and measurement problems with farmers’ income.
Agricultural subsidies Agriculture is the sector where the distinction between value added at factor cost and basic prices is sizable, as production subsidies, mainly coming from EU funds are large compared to the value added of the sector. When labor shares are calculated using value added at basic prices (for example in EUKLEMS), the balance of taxes and subsidies on production is included in value added. Consequently it does not contain the significant net amounts arriving from agricultural funds, although these subsidies constitute an important part of the income of the sector. We think that value added at factor cost is a more appropriate measure for calculating the labor share. It represents the amount remaining out of gross value added after the paying all taxes and
Figure 1: Agriculture and non-agricultural total labor share in CEEU countries
.4.5.6.7.8
% of total EMP
1995 2000 2005 2010 2015
year HU
.4.45.5.55.6% of total EMP
1995 2000 2005 2010 2015
year CZ
01234% of total EMP
1995 2000 2005 2010 2015
year PL
0246
% of total EMP
1995 2000 2005 2010 2015
year RO
.2.3.4.5.6
% of total EMP
1995 2000 2005 2010 2015
year SK
.511.522.5% of total EMP
1995 2000 2005 2010 2015
year SI
.3.4.5.6.7% of total EMP
1995 2000 2005 2010 2015
year EE
.4.6.811.2
% of total EMP
1995 2000 2005 2010 2015
year LT
.5.6.7.8
% of total EMP
1995 2000 2005 2010 2015
year LV
.4.6.811.21.4% of total EMP
1995 2000 2005 2010 2015
year BG
.511.52% of total EMP
1995 2000 2005 2010 2015
year HR
Agriculture Non-agriculture
receiving all subsidies, which is the amount that is distributed between labor and capital.
The difference between labor shares including and excluding subsidies started to in- crease in the CEEU countries after accession to the EU. It is sizable, 10-20 percentage points in many countries (Figure 20 in the Appendix). Nevertheless, the agricultural labor share can be extreme and highly volatile even taking subsidies into consideration, which is attributable to the measurement problems of farmer’s labor income.
High share of self-employed farmers Sectoral labor shares are constructed with the assumption that entrepreneurs earn the same wage as wage earners in the given sector.
However, in many countries the majority of agricultural employment comes from self- employed farmers who do not report wage income and profit separately (Figure 22 in the Appendix). The assumption that farmers earn the same labor income as employees in agriculture may produce volatile, and in some cases extreme labor shares in agriculture, often above 100% (Figure 1). This problem is not exclusive to the CEEU countries, as some more developed EU countries also have extremely high agricultural labor shares (Figure 23 in the Appendix). Due to the low weight of agriculture in the economy in
advanced countries, these measurement problems are not important for the total economy labor share. For emerging economies such as the CEEU, mismeasurement in agriculture may have a measurable effect on the aggregate labor share, especially at the beginning of the sample period (see Figure 25).
3 Aggregate labor share in the CEEU countries
In the following, we analyze developments in different aggregate labor share indicators in the CEEU countries. We calculate the following alternative aggregate labor share indicators: (i) withAssumption 2 (without mixed income), (ii) the corporate labor share, and (iii) the unadjusted labor share.
3.1 Data sources
Our data sources are the following:
• National accounts aggregates by industry (up to NACE A*64) : consumption of capital, taxes and subsidies, value added, compensation of employees (EUROSTAT)
• National accounts employment data by industry (up to NACE A*64) employment data (EUROSTAT)
• National accounts employment data by industry (up to NACE A*10) Croatia em- ployment 1995-2008, Latvia, Bulgaria employment 1995-2000 (EUROSTAT)
• National accounts aggregates by industry (up to NACE A*10) Croatia value added 1995-2008, Latvia, Bulgaria value added 1995-2000 (EUROSTAT)
• National accounts, Nonfinancial transactions: mixed income, gross of total econ- omy, gross operational surplus and value added at the non-financial corporations, EUROSTAT
• EUKLEMS dataset (2017 release): value added for industries at constant prices (VA QI)
• Poland EUKLEMS 2007: sectoral employment data for 1995-2000
• PPP database, EUROSTAT relative prices, PPS
• Philip R. Lane and Gian Maria Milesi-Ferretti (2017), ”International Financial Inte- gration in the Aftermath of the Global Financial Crisis,” IMF Working Paper 17/115:
net fdi liabilities
Our sample period is 1995-2017, containing 24 EU countries. Out of the 28 EU countries, we dropped 3 small countries (Malta, Cyprus, Luxembourg) and Ireland, as its real GDP jumped by 26 percent in 2015. This increase is related to certain accounting methods of the SNA, rather than to an actual jump in the country’s real economic performance.
The group of CEEU countries consists of Bulgaria, Czech Republic, Croatia, Estonia, Hungary, Latvia, Lithuania, Slovakia, Slovenia, Poland, Romania. Developed EU countries - referred as EU13 - are Austria, Belgium, Denmark, Finland, France, Germany,Greece, Italy, Netherlands, Portugal, Spain, Sweden, United Kingdom.
Employment can be calculated by the number of hours worked or number of persons.
The theoretically correct solution is to take the working time of the employed also into consideration, i.e. to use total number of hours worked. However, data on working hours are often missing and unreliable, so in what follows we use the more accurate and available employment data.
3.2 Comparing labor share measures
Comparing the different labor share indicators reveals that significant changes in the labor share are usually captured by most labor share indicators, with some notable exceptions (Figure 2).1 The unadjusted labor share, which excludes mixed income only from the numerator and not the denominator, is usually well below other indicators. Moreover, in countries where the share of mixed income changed considerably in the sample period, for example in Hungary, its trend also differs from that of other labor share measures.
We think that the unadjusted labor share is not a proper measure for making cross coun- try comparisons and assessing trends over time, as the share of mixed income exhibits significant trends and differences across countries (see Figure 3).
1All indicators are based on value added at factor cost. At the aggregate level, for most countries the choice between basic price or factor cost value added does not influence the labor market share significantly.
In Sweden, France and Italy, however, the two indicators differ by 2-5 percentage points (see Appendix, Figure 21).
Figure 2: Aggregate labor shares in CEEU countries
.5.55.6.65.7% of total EMP
1995 2000 2005 2010 2015
year HU
.4.45.5.55% of total EMP
1995 2000 2005 2010 2015
year CZ
.4.5.6.7% of total EMP
1995 2000 2005 2010 2015
year PL
.3.4.5.6.7.8% of total EMP
1995 2000 2005 2010 2015
year RO
.4.45.5.55% of total EMP
1995 2000 2005 2010 2015
year SK
.55.6.65.7.75.8% of total EMP
1995 2000 2005 2010 2015
year SI
.3.4.5.6.7% of total EMP
1995 2000 2005 2010 2015
year BG
.55.6.65.7.75.8% of total EMP
1995 2000 2005 2010 2015
year HR
.5.55.6.65.7% of total EMP
1995 2000 2005 2010 2015
year EE
.4.45.5.55.6% of total EMP
1995 2000 2005 2010 2015
year LT
.4.5.6.7% of total EMP
1995 2000 2005 2010 2015
year LV
Adjusted Unadjusted W/o mixed income Corporate
Figure 3: Share of mixed income in total value added in CEEU countries
.05.1.15.2.25.3Share of mixed income in total VA
1995 2000 2005 2010 2015
year
BG CZ EE HR HU LT
LV PL RO SI SK
The worldwide decline of the labor share in recent decades, which is documented in the literature extensively (e.g. Karabarbounis and Neiman, 2014; IMF, 2007), is not generally observable in the CEEU countries in the 1995-2017 sample period. Labor share decline is not a common feature of developed EU countries either, as in many countries the labor share decrease had already happened in the preceding decades (see Appendix, Figure 24).
Now we turn to average differences in the level and dynamics of the labor share across two broad country groups, the CEEU countries and the EU13 economies (definitions are given in the data section above). We take simple country averages for both groups, i.e. we do not adjust for different populations or GDP. Doing so would be especially problematic for the CEEU group, since the weight of Poland (and to a lesser extent Romania) would dominate the analysis.
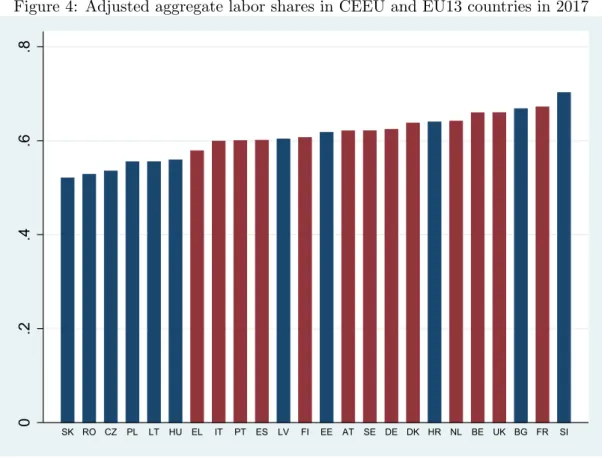
The level of the total labor share is on average lower in CEEU countries than in the EU13 countries.2 As Figure 4 shows, the majority of CEEU countries can be characterized by relatively low aggregate labor shares (exceptions are Slovenia, Bulgaria and Croatia).
Regarding dynamics, total economy labor shares declined in the CEEU countries between 1995-2011, increasing the gap between the two country groups (Figure 5). Since 2011, the total economy labor share has increased on average in the CEEU countries, decreasing the gap between the two country groups.
4 Sectoral analysis
In this section we study the labor share at a more disaggregated level. We again focus on differences between the two country groups, CEEU and EU13. We define four broad sectors in the economy, based on the production side. Using the SNA2010 classification, the categories are the following:
1. Agriculture: A
2. Industry: B, C, D, E, F
3. Market services:G, H, I, J, K, M, N, R, S, T, U 4. Non-market services:L, O, P, Q
2In a pooled OLS regression of all aggregate labor share on the dummy for CEEU countries, the dummy is significant at 1 % and shows that the aggregate labor shares are lower by 4 percentage points including agriculture, and 8 percentage points excluding agriculture.
Figure 4: Adjusted aggregate labor shares in CEEU and EU13 countries in 2017
0.2.4.6.8
SK RO CZ PL LT HU EL IT PT ES LV FI EE AT SE DE DK HR NL BE UK BG FR SI
Figure 5: Adjusted labor shares in developed EU (EU13) and Central-European EU (CEEU) countries (unweighted averages)
.56.58.6.62.64
1995 2000 2005 2010 2015
year
EU13 CEEU
In addition to presenting the evolution of the sectoral indicators, one of our main questions is about the importance of sectoral reallocation in explaining changes in the aggregate labor share. This is particularly interesting for the CEEU countries, where economic transition was accompanied by significant sectoral reallocation. Unfortunately our data only goes back to 1995, when these processes were already well under way.
Nevertheless, a few interesting results emerge, especially when considering changes in agriculture. Our sectoral analysis covers the 1995-2016 period.
4.1 Sectoral labor shares and structural transformation
The basic findings are presented on Figure 6, which plots the labor shares for the four sectors and two country groups. The following results emerge.
Figure 6: Sectoral labor shares in developed EU (EU13) and Central-European EU (CEEU) countries (unweighted averages)
.5.55.6.65
1995 2000 2005 2010 2015
year
Manifacturing, EU13 Manifacturing, CEEU
.55.6.65.7
1995 2000 2005 2010 2015
year
Market services, EU13 Market services, CEEU
.48.5.52.54.56.58
1995 2000 2005 2010 2015
year
Nonmarket services, EU13 Nonmarket services, CEEU
.6.811.21.4
1995 2000 2005 2010 2015
year
Agriculture, EU13 Agriculture, CEEU
First, all labor shares in the non-agricultural sectors are lower in the CEEU countries.
The opposite is true in agriculture, but as we discussed above and explore below in more detail, the agricultural labor share suffers from severe data problems. The obvious indica- tion for these issues in the CEEU economies is that the labor share in agriculture is very
high, and it is actually above one before 2010.
Second, the dynamics of the labor share are very different across sectors in the CEEU countries. We see a large drop and divergence in industry labor share, and convergence - increases - in both market and non-market services. A partial exception is the 2009- 2014 period, where the labor shares in the nonmarket services sector diverged sharply.
This might be a consequence of the economic crisis, when fiscal consolidation hit wages in the public sector particularly hard in the CEEU countries. By 2016, the labor shares in the manufacturing and nonmarket sectors were back to their pre-crisis levels, and further convergence between the country groups looks likely.
Figure 7: Average aggregated labor share excluding agriculture in CEEU and EU13 coun- tries
.54.56.58.6.62.64
1995 2000 2005 2010 2015
year
Total,EU13 Total w/o agri EU13 Total,CEEU Total w/o agri CEEU
Third, the agricultural labor share is unreliable, at least in the CEEU countries. To see the impact of agriculture on the aggregate labor share, we reproduce Figure 5 for the non-agricultural part of the economy. Figure 7 presents the results, along with the total economy labor shares from Figure 5. Strikingly, while the non-agricultural labor share is also much lower in the CEEU group, the large decline between 1995-2006 is hardly visible any more. Without agriculture, the labor shares are quite stable in both the CEEU and
EU13 groups.
4.2 Shift-share analysis
Figure 8: Weight of subsectors in total value added
0.2.4.6.81
CEEU EU13
1995 2005 2016 1995 2005 2016
Manufacturing Agriculture
Market services Non-market services
The sectoral composition of the economy has changed considerably in the EU countries for the last twenty years and the basic pattern of sectoral transformation is similar in EU13 and non CEEU countries (Figure 8). Specifically, the period can be characterized by an increase in the service sectors and a decrease in manufacturing and agriculture. However, in CEEU countries, the weight of agriculture was much higher in the beginning of the period and the decrease is more pronounced in the 1995-2016 period. Also, the decrease in manufacturing is less marked (it has even increased in some countries), and the increase in market services is more robust. Structural transformation still lags behind in CEEU countries3. The weights of agriculture and manufacturing are higher, and the weight of services is lower than in the more developed EU countries.
3In this section we do not consider the role of cross-country relative prices, i.e. that the relative price of services to GDP is much lower in the CEEU than in the EU13. At international prices the weight of services in CEEU countries increases. We address comparisons at international prices in section 5.2 and 5.3.
We now turn to the role of changes in structural composition in aggregate labor share developments. The change in the aggregate labor share can be decomposed into the contribution of changes in sectoral labor shares, and the contribution of changes in sectoral composition. The weights are given by the share of the given sector in total value added:4
αt=X
j
sjtαjt
∆αt=X
j
sjtαjt−X
j
sj,t−1αj,t−1
=X
j
αj,t−1(sjt−sj,t−1) +X
j
sjt(αjt−αj,t−1)
Figure 9 displays the decomposition. The bulk of the aggregate labor share change comes from within sector labor share changes. However, in some Central European coun- tries (Romania, Poland and Slovenia) sectoral restructuring also contributed to a lower aggregate labor share. In particular, the decrease in the ratio of high labor share agricul- ture in total value added also contributed to the decrease in the aggregate labor share in some CEEU countries (See Figure 10 below). Note that in Poland, Romania, and Slovenia the labor share in agriculture is excessively high and exceeds 100% (see section 2).
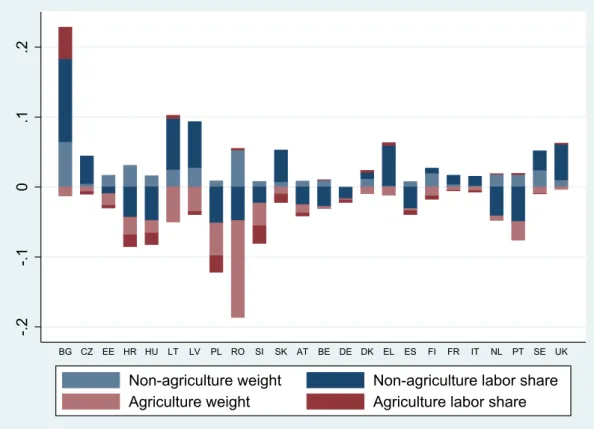
Figure 10 looks at the contribution of agriculture in more detail. The total impact of agriculture is defined as the sum of the reallocation component (the shrinkage of the sector), and the within sector component (labor share changes within agriculture). We find that in many CEEU countries (Croatia, Hungary, Poland and Romania) agriculture did in fact play a large role in the overall fall in the aggregate labor share. However, when excluding agriculture from the analysis, we find that sectoral transformation does not add much to the aggregate dynamics in the non-agricultural labor share (see Appendix, Figure 26).
4The sum of contribution of changes in sectoral composition and sectoral labor shares might slightly differ from change in aggregate labor share in the same period. The explanation lies in the following aggregation problem. The adjusted labor share adjusts the compensation of employees to value added with the employed over employee ratio. As this ratio might vary significantly across sectors, the total economy labor share, calculated aggregating the sectoral labor shares does not necessarily coincide with the aggregate labor share calculated by adjusting the aggregated compensation of employee to value added ratio with aggregated employee-employment ratio. To ensure additivity, in the section we decompose the labor share which is aggregated from sectoral labor shares, while in aggregate analysis, we use original labor share, which is calculated from total economy aggregates.
Figure 9: Decomposition of contribution of change in sectoral composition and sectoral labor shares to change in aggregate labor share including agriculture,1995-2016
-.15-.1-.050.05.1.15.2
BG CZ EE HR HU LT LV PL RO SI SK AT BE DE DK EL ES FI FR IT NL PT SE UK
Sectoral composition Sectoral labor shares
Figure 10: Contribution of agriculture to change in aggregate labor share,1995-2016
-.2-.10.1.2
BG CZ EE HR HU LT LV PL RO SI SK AT BE DE DK EL ES FI FR IT NL PT SE UK
Non-agriculture weight Non-agriculture labor share Agriculture weight Agriculture labor share
4.3 Shift share analysis - cross-sectional decomposition
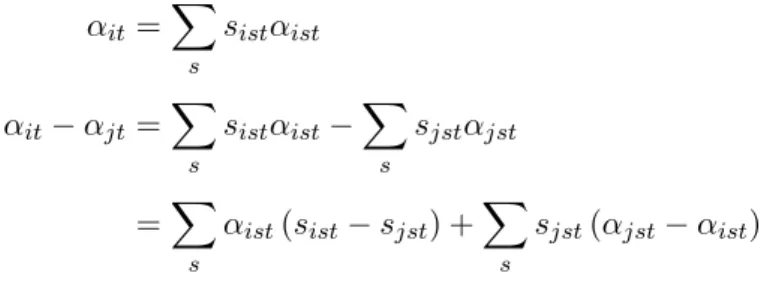
After looking at changes over time, in this section we decompose cross-sectional differences in the aggregate labor share into within sector components and the composition effect. We decompose the aggregate labor share including agriculture.
αit=X
s
sistαist
αit−αjt =X
s
sistαist−X
s
sjstαjst
=X
s
αist(sist−sjst) +X
s
sjst(αjst−αist)
The bulk of the difference in country labor shares compared to Germany is explained by differences in sectoral labor shares, and the contribution of different sectoral composition is negligible (Figure 11).
Figure 11: Decomposition of difference in aggregate labor share (including agriculture) compared to Germany, 2016
-.2-.10.1
BG CZ EE HR HU LT LV PL RO SI SK AT BE DE DK EL ES EU15 FI FR IT NL PT SE UK
Sectoral composition Sectoral labor shares
5 Relative prices, the level of development and labor share
5.1 Relative price and labor share
In theory, the relationship between the level of economic development and the labor share is not straightforward and might depend on a number of factors (the elasticity of substitution, capital mobility, trade integration, sectoral differences). Section 3 demonstrates that labor shares are lower in the less developed CEEU countries on average, and in Section 4 we show that this difference can not be attributed to differences in sectoral labor shares. Lower labor shares in developing and emerging countries is also documented in IMF (2007).
Table 1: Panel regressions of labor share on value added per employment
(1) (2) (3) (4)
VARIABLES relative labor share relative price of AIC relative productivity 0.116** 0.0401 0.0716***
(0.0534) (0.0742) (0.0208)
relative price of AIC 1.192*** 1.064**
(0.364) (0.511)
Constant 0.873*** -0.283 -0.178 0.988***
(0.0559) (0.375) (0.489) (0.0182)
Observations 529 529 529 529
R-squared 0.099 0.213 0.220 0.264
Year FE YES YES YES YES
country FE NO NO NO NO
Robust standard errors in parentheses All variables are expressed relative to Germany
*** p<0.01, ** p<0.05, * p<0.1
We run panel regressions to find that there is indeed a positive correlation between value added per employed and the labor share among EU countries. In the first column of Table 1, our baseline labor share indicator (adjusted, based on value added at factor cost) is regressed on labor productivity (the value added at factor cost per number of employed in PPS), and both indicators are expressed relative to Germany. The results indicate that there is a significant positive correlation in time fixed effect specification.5
In international comparisons, the ratio of the price level of consumption (Pc) to the price level of GDP (Pgdp) tends to increase with the level of development (Figure 12,
5The correlation disappears in the country fixed effect specification, which implies that the positive correlation between labor productivity and the labor share is identified from cross-country variation.
first panel). In other words, the purchasing power of wages in terms of consumption - as compared to the purchasing power of a unit of currency over total GDP - tends to decrease with the level of development. This positive correlation between the relative price of consumption and income is documented for example in Barro (1991) and Hsieh and Klenow (2007). As Hsieh and Klenow (2007) argue, the lower relative price of consumption and the higher relative price of investment in poorer countries is a consequence of these countries being relatively less productive in tradables. As the share of nontraded services is larger in consumption goods than in investment goods, poor countries have a lower productivity in producing investment goods, and also in producing tradable goods in exchange for investment goods (relative to their productivity in the nontradable service sector).
Figure 12: The relationship between (a) the relative price of AIC to GDP and productivity;
(b) the level of producer real wage and the relative price of AIC to GDP; (c) the adjusted labor share and the relative price of AIC to GDP: EU 24, pooled cross-section data relative to the EU15 average, 1995-2017
-.15-.1-.050.05
-1.5 -1 -.5 0 .5
GDP/employed (logs)
Relative price of AIC to GDP (logs) -1.5-1-.50.5
-.15 -.1 -.05 0 .05
Relative price of AIC to GDP (logs) producer real wage (log)
-.4-.20.2.4
-.15 -.1 -.05 0 .05
Relative price of AIC to GDP (logs) labor share (logs)
This implies that between countries at different levels of development, differences in the consumption value (purchasing power) of wages, i.e., adjusted for differences in the
relative price of consumption, tend to be milder than what is suggested by differences in producer real wages (i.e. wages in euros deflated by the price level of GDP, Figure 12,b).
Similarly to producer real wages, adjusted labor shares are also positively correlated with the relative price of individual consumption see (Figure 12,c).
Again, we run panel regression and find a positive relationship between the relative price of consumption and value added per employment and between the relative price of consumption and labor shares (see 2. and 4. columns of Table 1). In the estimations, the relative price of actual individual consumption is measured by the index of price level of actual individual consumption to the price level of GDP, and similarly to labor productivity and the labor share, it is expressed relative to Germany. When the labor share is regressed on both the adjusted relative price of consumption and productivity, the coefficient of relative productivity looses its significance (see 3. column in Table 1 ).
5.2 Labor share corrections and decompositions
We can decompose the adjusted labor share (LS) into the producer real wage and labor productivity. The decomposition, using logarithms of the variables can be written as the following:
ls= (comp−gdp)−(empe−emp)
= (comp−empe)−(qgdp+pgdp−emp)
= [(comp−pgdp)−empe]
| {z }
Prod. real wage
− (qgdp−emp)
| {z }
Labor productivity
(1)
= [(comp−empe+emp)−qgdp]
| {z }
Unit labor cost
−pgdp, (2)
where qgdp and pgdp denote the (logs of) the volume and price level of GDP. From the point of view of the welfare of wage-earners, however, what matters is the price level of consumption (rather than that of GDP). Therefore, for the purposes of international comparisons, it makes sense to correct the conventionally interpreted labor shares with
the relative price of consumption:
lscorr =ls−(pc−pgdp)
= [(comp−pc)−empe]−(qgdp−emp)
The above correction implies that nominal wages are deflated by the price of consumption instead of the price of GDP. The logarithm of ourcorrected labor shareis thus the difference between thelog consumer real wage and log labor productivity.6
However, the “welfare” argument (i.e., the relative purchasing power of wages) is not essential for correcting conventionally interpreted labor shares by the relative price level of actual individual consumption to GDP. It is sufficient to observe that, in international comparison, conventionally measured labor shares are positively correlated with this par- ticular internal relative price. Therefore, if the ratio of wages to GDP is compared across countries by valuing both wages and GDP at the cross-country relative price of GDP (what is implicitly done by applying the conventional measure of adjusted labor shares), observed international differences in labor shares tend to be distorted by an internal rela- tive price, which should actually be adjusted for, if the purpose is cross-country comparison in real terms. The essential argument for correcting wage shares by differences in relative prices is exactly the same as the one that applies for correcting “nominal” consumption and/or investment shares in GDP by the relative prices of these items for the purposes of comparisons across countries at significantly different levels of economic development.
(e.g. Hsieh and Klenow, 2007). Comparisons in “nominal” terms (at current prices and exchange rates) are affected by the fact that the lower the relative level of economic de- velopment, the lower is the relative price of consumption and the higher is the relative price of investments. These systematic differences in relative prices need to be corrected for in order to make economically meaningful (real) comparisons between consumption
6It is important to note that our deflator for quantifying the relative “consumer real wage” is the cross-country relative price index of actual individual consumption (AIC), which includes, in addition to household consumption expenditure (roughly: the cross-country concept of the CPI), the relative price of transfers in kind to households by the government (e.g. education, healthcare etc.). The reason for including these items in the deflator is that the concept of wages considered in our study is a gross one (compensation of employees includes taxes and social contributions). Taxes on wages and social contributions are assumed to cover social transfers in kind to households. Our deflator of wages does not include the relative price of collective consumption (e.g., police, defense etc.), as the latter item is not directly related to the concept of household consumption and to the “purchasing power” of gross wages.
(investment) shares of less and more affluent countries. This argument obviously applies for international comparisons of labor shares as well.
Figure 13 displays the conventional adjusted labor share and the corrected labor share for the average of CEEU and EU13 countries. The main message of the chart is that a significant part of the difference in conventionally measured labor shares between the two country groups can be attributed to differences in relative prices.
Figure 13: The evolution of the conventional and the corrected labor share in the CEEU and the EU13 (unweighted averages, 1995-2017)
.56.58.6.62.64
1995 2000 2005 2010 2015
year
Corrected, EU13 Conventional, EU13 Corrected, CEEU Conventional, CEEU
There was relatively little change between 1995 and 2017 in the average of the EU13 (disregarding a temporary increase in 2009) and the conventional and corrected labor shares moved closely together. By contrast, in the CEEU11 the differences between the two indicators were significant and both made large swings over the 23 years observed.
The conventional labor share in the EU13 was continuously above that of the CEEU11 during the period. The corrected labor share, in turn, was at the same level in the two regions both at the beginning and the end of the period observed. This implies that the difference in conventionally measured labor shares in the beginning and the end of the period between the CEEU11 and the EU13 was due to differences in relative prices. The
cross-section “nominal” differences observed in 1995 and 2017 (bold lines) disappear if the effect of relative prices is controlled for (dashed lines).
The labor share of country i relative to the EU average can be decomposed in two meaningful ways: first, into a relative producer real wage (wprod) and a labor productivity (lp) component (this follows directly from eq. [1], and second,into the relative unit labor cost (ulc) and the spatial price index of GDP (pgdp), (which follows directly from eq. [2]).
lsi−lseu= wiprod–weuprod
− lpi−lpeu
(3) lsi−lseu= ulci−ulceu
− pigdp−peugdp
. (4)
The relative producer real wage is the nominal wage per employee (in euro) deflated by the spatial price index of production (pgdp), and relative productivity is nominal GDP at factor cost (in euros) per employed persons deflated bypgdp – as compared to the EU.
As for the second decomposition, relative ULC is the ratio of compensation per employee (in euros) to productivity – also compared to the EU. The first decomposition indicates that, in an accounting sense, relative levels of labor shares are positively related to relative levels of producer real wages, and negatively to relative levels of productivity. The second shows that, in an accounting sense, labor shares are positively related to the relative level of ULC, and negatively to the spatial price index of GDP.
These decompositions concern the conventional interpretation of the labor share. How- ever, as discussed above, there are grounds for defining the concept of a “corrected labor share”, which corrects for the cross-country differences in the relative price of actual in- dividual consumption to GDP (Pc/Pgdp, which is positively correlated with the level of development). The correction is motivated by welfare arguments (from the point of view wage earners, the purchasing power of wages matters) and by the observation that con- ventionally interpreted (or “nominal”) labor shares, similarly to consumption rates, are positively associated with the relative price of consumption. The corrected labor share in country i relative to the EU13 average (in logs):
lsicorr −lseucorr =lsi−lseu−
pic−peuc
− pigdp−peugdp
, (5)
where the second term on the right hand side is the relative price of AIC to GDP as com- pared to the EU. This expression can be decomposed, similarly to (3) and (4), into a real wage and a productivity component on the one hand, and a ULC and a price component on the other. The difference in the decomposition of the conventional (“nominal”) and the corrected labor share is that in the latter case the real wage in (3) is close to the concept of “consumer real wage” (nominal - euro - wages are deflated by Pc), and in (4) nominal ULC is also adjusted byPc, rather than byPgdp.
Figure 14: Components of the conventional (left) and the corrected (right) labor share:
CEEU/EU13 (unweighted averages); 1995-2017
.88.9.92.94.96.98
.4.5.6.7
1995 2000 2005 2010 2015
year
Prod. real wage CEEU/EU13 GDP/emp CEEU/EU13 Labor share CEEU/EU13 (right scale)
.9.9511.05
.4.5.6.7
1995 2000 2005 2010 2015
year
Corr Prod. real wage CEEU/EU13 GDP/emp CEEU/EU13 Corr labor share CEEU/EU13 (right scale)
.88.9.92.94.96.98
.35.4.45.5.55.6
1995 2000 2005 2010 2015
year
ULC CEEU/EU13 P_gdp CEEU/EU13
Labor share CEEU/EU13 (right scale)
.9.9511.05
.35.4.45.5.55.6
1995 2000 2005 2010 2015
year
ULC CEEU/EU13 P_aic CEEU/EU13
Corr labor share CEEU/EU13 (right scale)
The two interpretations and two decompositions of the labor share imply two stories from two angles regarding developments in labor shares in the CEEU relative to the EU137 (Figure 14). One is about the conventionally interpreted labor share (the two charts on the left), the other concerns the corrected labor share (the two charts on the right). Both are decomposed into a productivity and a real wage component (upper two charts), as well as into an ULC and a price component (lower two charts). The comparison of the charts
7As before, we aggregate the country-level measures introduced above for the two group of countries as simple arithmetic averages.
referring to the conventional (left) vs. the corrected (right) labor share indicate that with respect to the former, the CEEU was constantly below the EU13, while the average of the two groups was the same in both 1995 and 2017, if the corrected labor share is considered.
One story is about the relationship between productivity, producer real wages and labor shares. The other one is about the evolution of ULCs, relative prices and labor shares. The upper two panes indicate that relative productivity increased continuously in the CEEU, but the increase in relative producer real wages fell behind the increase in productivity (left pane), while relative consumer real wages caught up to productivity by 2017. The lower two charts, in turn, suggest that there has been a relative fall in both ULC and relative prices after 2011, however, the fall in the relative price of actual individual consumption was less pronounced than in the GDP deflator, which contributed to a steady increase in the corrected labor share between 2011 and 2017.
Figure 15: The relative price of gross fixed capital formation (GFCF) to GDP and to actual individual consumption as a function of GDP per employed in the EU24 between 1999 and 2017; pooled cross-section data (EU15=1)
.811.21.41.61.8
.2 .4 .6 .8 1 1.2
GDP/emp
Relative price of GFCF to GDP Relative price of GFCF to AIC
5.3 The relative price of investment, the investment rate and the capital share measured at domestic and international prices
As shown by Figure 15, similarly to the global pattern (addressed by e.g., Hsieh and Klenow, 2007), within the EU the relative price of investments (gross fixed capital forma- tion, GFCF) to both GDP and actual individual consumption (AIC) decreases with the level of productivity.8 This has implications for the comparison of investment rates and capital shares among countries at different levels of economic development.
Figure 16: The investment-to-GDP ratio measured at domestic and international (average EU15) prices as a function of GDP/employed in the EU24 between 1999 and 2017; pooled cross-section data
.1.2.3.4
.2 .4 .6 .8 1 1.2
GDP/emp
GFCF/GDP, domestic prices GFCF/GDP, international prices
Given that the relative price of investments tends to be higher (lower) in less (more) developed economies, the international comparison of investment rates measured at do- mestic prices may be misleading. More specifically, the nominal share of investments in
8It is worth noting that the data for the EU support the claim of Hsieh and Klenow (2007): “The high relative price of investment in poor countries is due to the low price of consumption goods in those countries. Investment prices are no higher in poor countries.” This claim was contested by e.g., Alfaro and Ahmed (2010), who found evidence of investment goods being more expensive in less developed countries.
Regarding the EU, however, the price level of investments is clearly lower in less developed countries than in more developed ones, while the price level of consumption is yet even lower. This pattern accounts for the high relative price of investment in less developed countries within the EU.
GDP at current prices is affected by both the relative price of investments and the “real”
ratio of investments to GDP. In cross-country comparisons this “real” ratio can be inter- preted as the share of investments measured at common international prices (in our case:
the average prices of the EU15; see Figure 16).
Figure 16 indicates that, within the EU, the negative relationship between the invest- ment rate and the level of productivity, as measured at domestic prices, turns positive, if the investment rate is measured at international (EU15-average) prices. That is, the “real”
investment rate – the nominal rate adjusted by relative prices – increases with the level of development.9
Figure 17: The conventionally defined capital share (KS) and alternative indicators of the corrected capital share as a function of GDP per employed in 24 EU countries relative to the EU15 average: pooled cross-section data for the period 1999-2017
0.511.5
.2 .4 .6 .8 1 1.2
GDP/emp
Conventional Implied
Using relative price of GFCF
This observation leads to the international comparison of capital shares. The capital share, as conventionally defined, is 1 minus the adjusted labor share in GDP at factor cost.
However, as discussed in the foregoing, for the purposes of international comparisons, the
9Our panel regressions indicate that in our sample, covering 24 EU-countries over 19 years, 1% higher real productivity involves 0.11% lower nominal investment rate (s.e.: 0,051; R2= 0,052), but 0.22% higher real investment rate (s.e.: 0.046; R2= 0.19). By “nominal” and “real”, respectively, we refer to investment
labor share may be rewritten by correcting for the relative price of actual individual consumption to GDP. By implication, the corrected capital share can be defined as 1 minus the corrected labor share. Alternatively, it can also be defined as the conventionally defined capital share corrected for the relative price of investment to GDP. Figure 17 shows the pooled cross-section data for the three interpretations of the capital share as a function of GDP/employed for 24 EU countries.
The relationship between the conventionally defined capital share and the level of pro- ductivity – similarly to the relationship between the investment rate measured at domestic prices and the level of productivity (see Figure 16) – is clearly negative in the EU. However, if capital shares are corrected for differences in the relative price of investments (see the black regression line) – again, similarly to the investment ratio – a positive association can be observed between the capital share and the level of development. The corrected capital share as implied by the corrected labor share (red line) is much closer to the conventionally interpreted capital share. The reason is that the weight of consumption, as compared to investments, is higher in GDP, therefore the price level of consumption is much closer to that of GDP than the price level of investments.
Finally, we show the evolution of the three indicators of the capital share for the CEEU10 countries relative to the more developed EU13 (Figure 18). The ratios of un- weighted averages are considered for the period 1999-2017. The comparison of the con- ventionally interpreted capital share (blue line) suggests that, in relative terms, the portion of capital income in GDP at factor cost was constantly higher in the CEEU than in the EU13, it even increased until 2011, and gradually fell to the level of 1999 by 2017 (to 110%). If we correct the capital share by the relative price of investments to GDP (green line), we observe a completely different picture, suggesting that the capital share in the CEEU has been consistently below that of the EU13, reached a peak of 95% in 2011 and fell to 90% by 2017.
This, however, is unlikely to be an adequate representation of actual developments. The relative price of investments serves for correcting the nominal level (ratio) of investments, and may be unsuitable for correcting the share of capital income. In our judgement, the
10In this section, aggregates, the group of CEEU countries does not contain Croatia due to data avail- ability